| Start Time | End Time | Duration (hrs) |
|---|---|---|
| 2023-07-02 22:45:00 | 2023-07-02 23:15:00 | 0.75 |
| 2023-07-05 00:30:00 | 2023-07-05 01:15:00 | 1.00 |
| 2023-07-06 01:15:00 | 2023-07-06 02:00:00 | 1.00 |
| 2023-07-07 02:00:00 | 2023-07-07 02:45:00 | 1.00 |
| 2023-07-21 00:45:00 | 2023-07-21 01:30:00 | 1.00 |
| 2023-07-23 02:15:00 | 2023-07-23 03:00:00 | 1.00 |
| 2023-08-03 00:00:00 | 2023-08-03 00:30:00 | 0.75 |
| 2023-08-04 05:30:00 | 2023-08-04 06:00:00 | 0.75 |
| 2023-08-04 17:30:00 | 2023-08-04 18:00:00 | 0.75 |
| 2023-08-05 01:30:00 | 2023-08-05 02:00:00 | 0.75 |
| 2023-08-05 06:15:00 | 2023-08-05 06:45:00 | 0.75 |
| 2023-08-06 02:15:00 | 2023-08-06 03:15:00 | 1.25 |
| 2023-08-07 02:45:00 | 2023-08-07 03:15:00 | 0.75 |
| 2023-08-07 15:30:00 | 2023-08-07 16:15:00 | 1.00 |
| 2023-08-08 07:30:00 | 2023-08-08 09:00:00 | 1.75 |
| 2023-08-08 16:30:00 | 2023-08-08 17:00:00 | 0.75 |
| 2023-08-09 09:00:00 | 2023-08-09 10:00:00 | 1.25 |
| 2023-08-09 22:45:00 | 2023-08-09 23:15:00 | 0.75 |
| 2023-08-10 05:00:00 | 2023-08-10 05:30:00 | 0.75 |
| 2023-08-10 10:15:00 | 2023-08-10 10:45:00 | 0.75 |
| 2023-08-10 18:30:00 | 2023-08-10 19:45:00 | 1.50 |
| 2023-08-10 20:15:00 | 2023-08-10 20:45:00 | 0.75 |
| 2023-08-11 06:15:00 | 2023-08-11 07:00:00 | 1.00 |
| 2023-08-11 19:30:00 | 2023-08-11 20:45:00 | 1.50 |
| 2023-08-12 20:15:00 | 2023-08-12 21:15:00 | 1.25 |
| 2023-08-13 00:15:00 | 2023-08-13 01:30:00 | 1.50 |
| 2023-08-13 08:00:00 | 2023-08-13 08:30:00 | 0.75 |
| 2023-08-13 12:15:00 | 2023-08-13 12:45:00 | 0.75 |
| 2023-08-15 02:15:00 | 2023-08-15 03:30:00 | 1.50 |
| 2023-08-15 22:45:00 | 2023-08-15 23:30:00 | 1.00 |
| 2023-08-16 02:15:00 | 2023-08-16 04:00:00 | 2.00 |
| 2023-08-29 08:45:00 | 2023-08-29 09:15:00 | 0.75 |
| 2023-08-29 22:15:00 | 2023-08-29 22:45:00 | 0.75 |
| 2023-08-31 03:00:00 | 2023-08-31 03:45:00 | 1.00 |
5 Nutrient Indicators
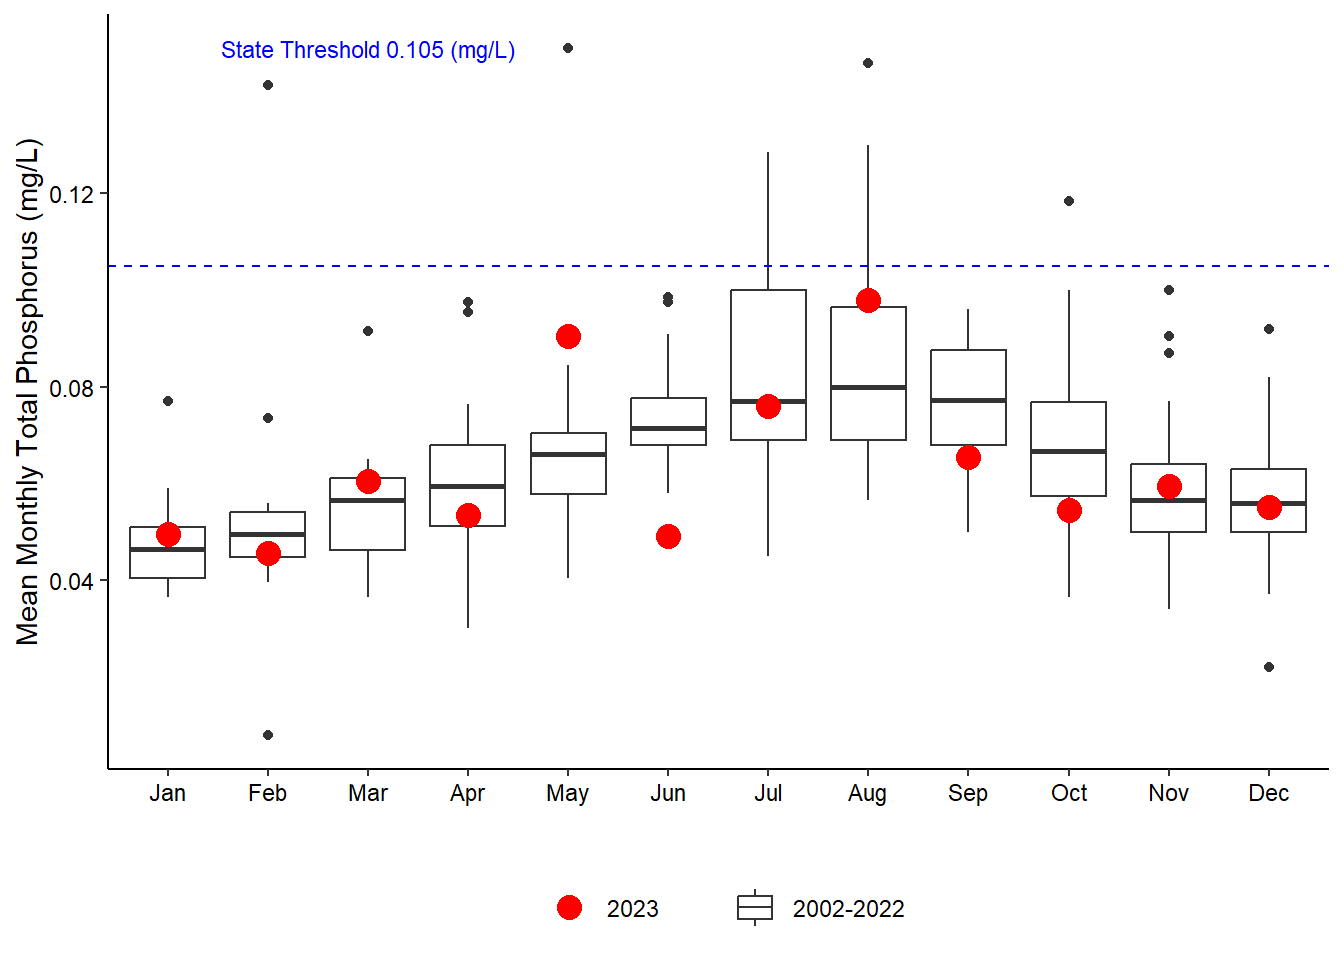
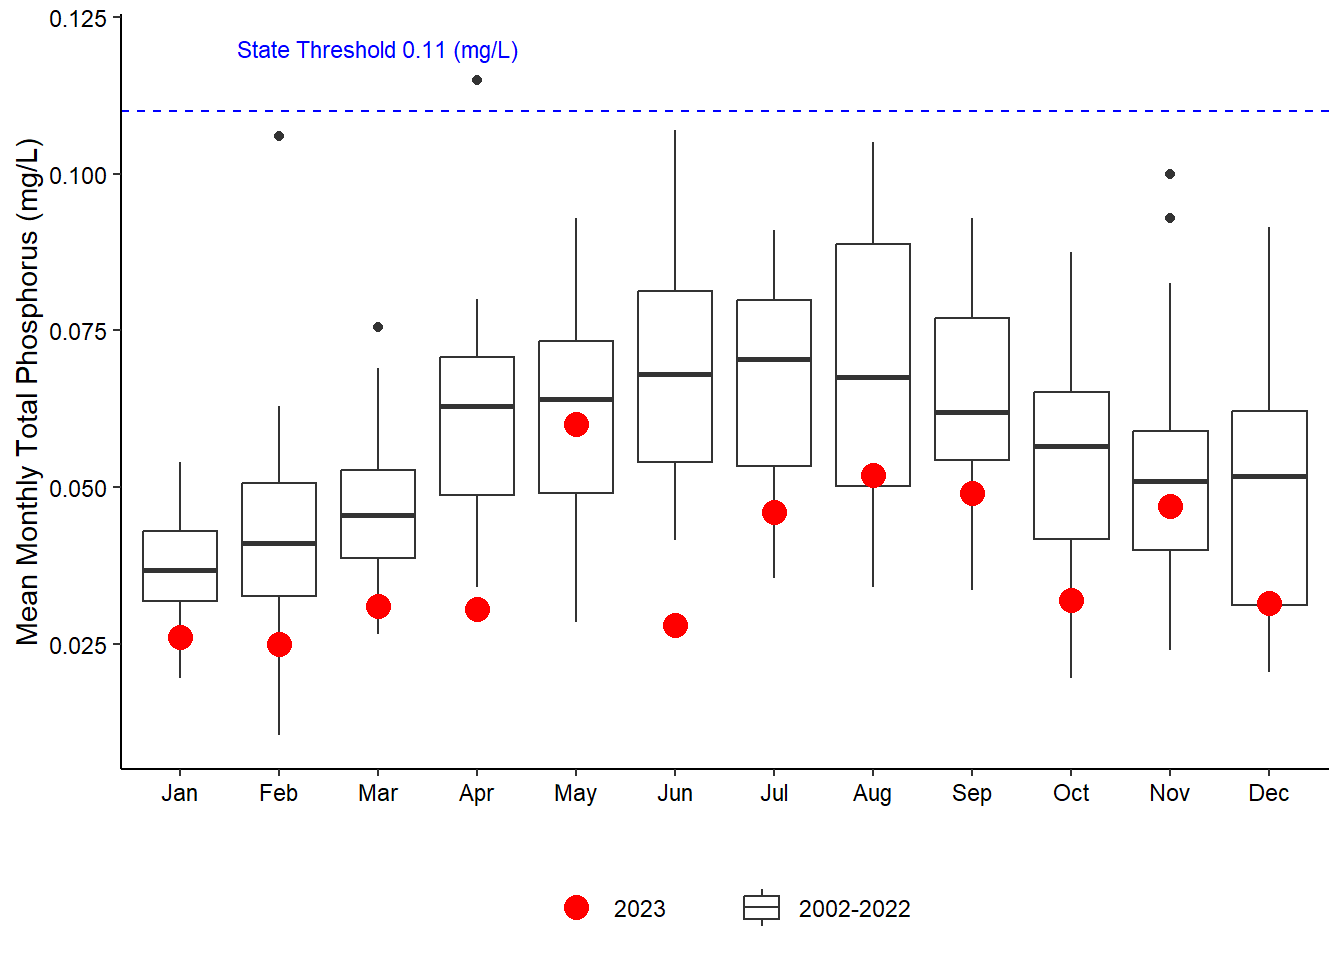
The state thresholds used in the chlorophyll a, total nitrogen, and total phosphorus visualizations come from Florida State Surface Water Quality Standards within the Florida Administrative Code.
Access the Standards
By visiting Florida Rules
5.1 Summary
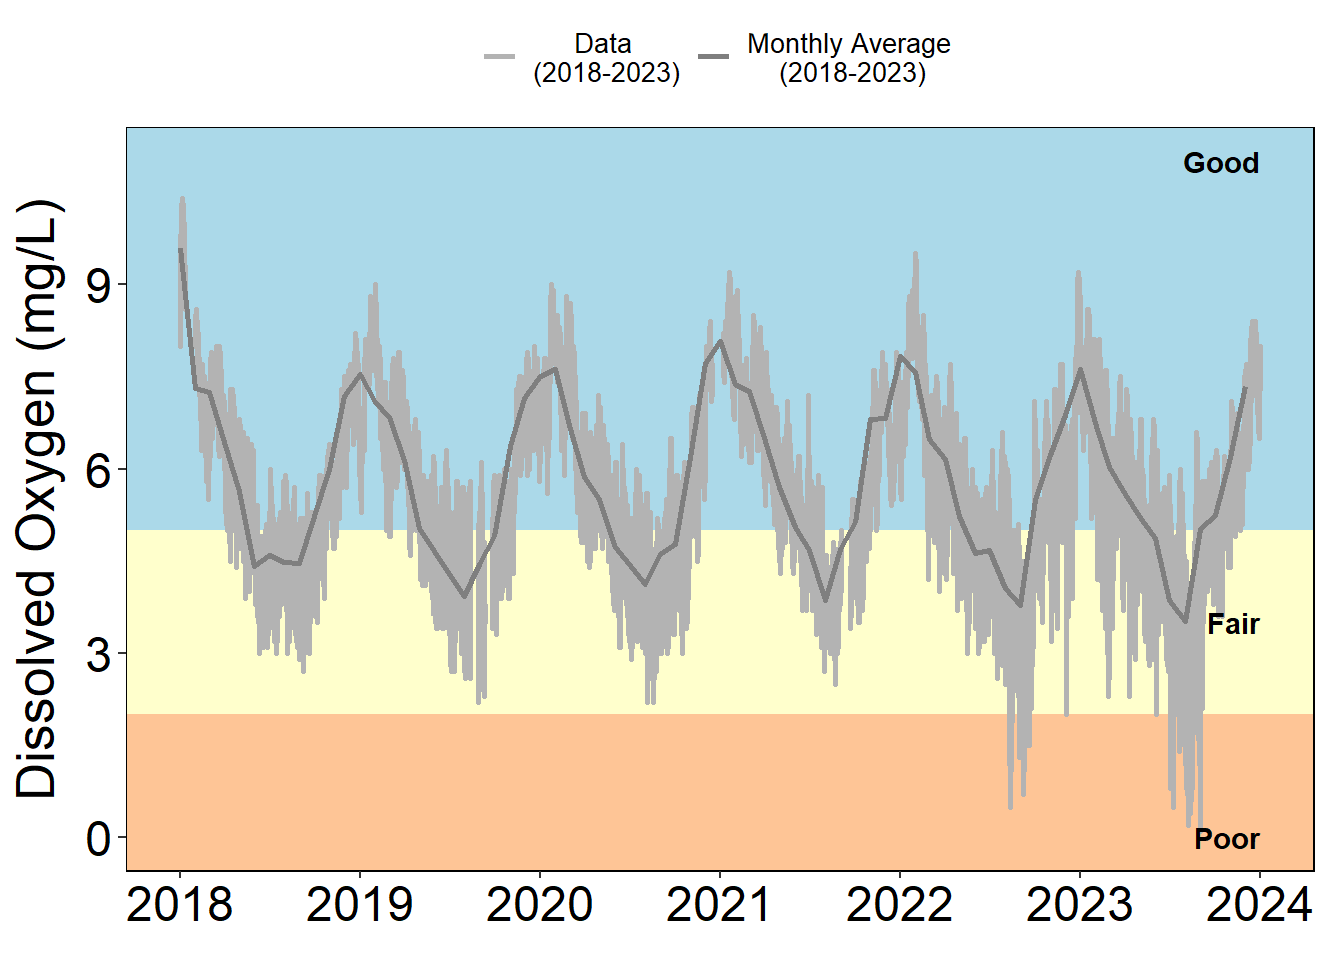
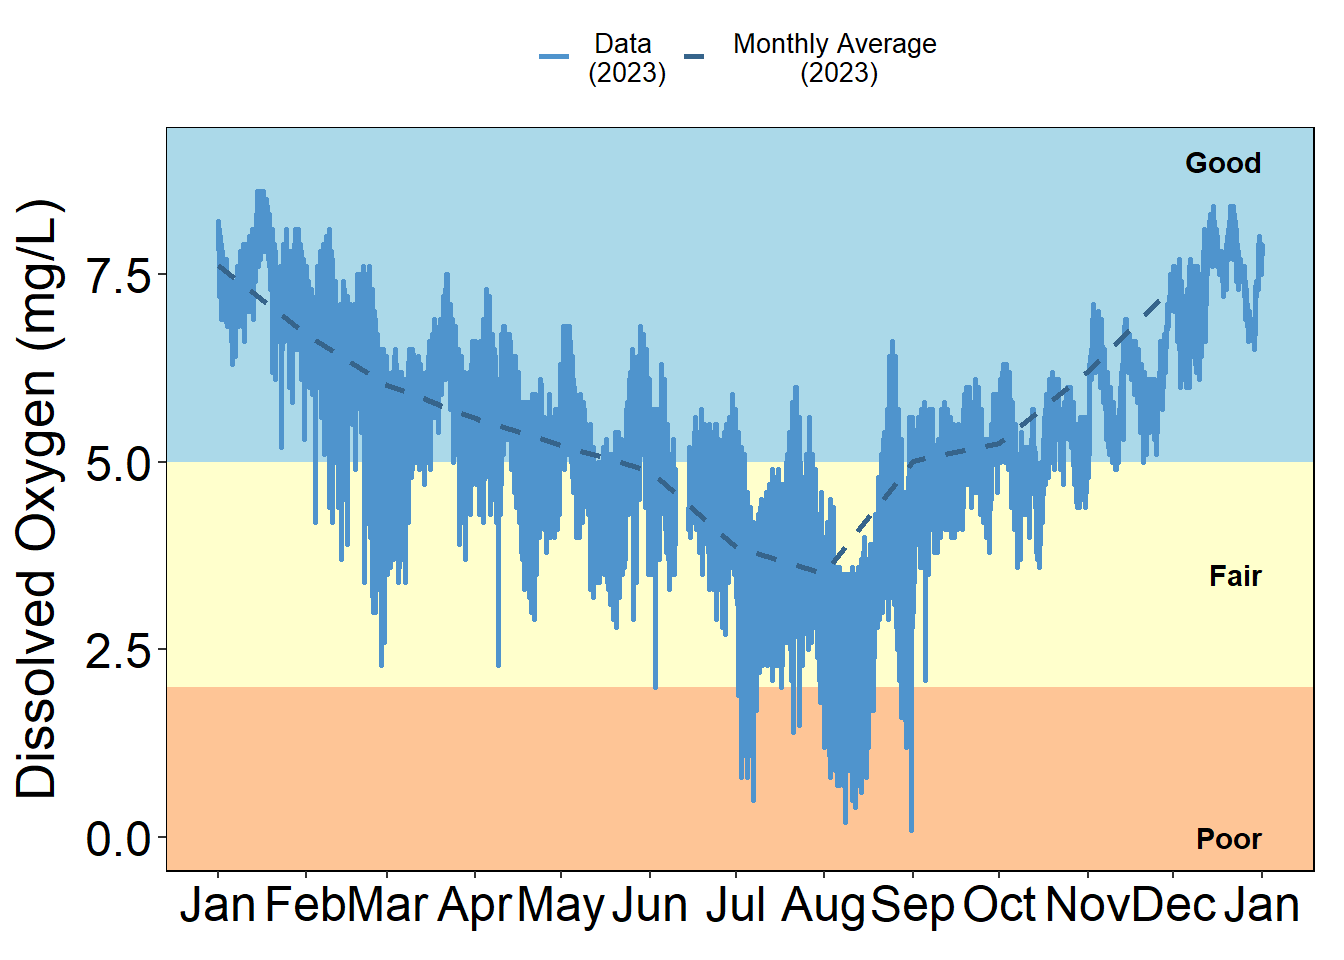
Most of the stations reported daily average dissolved oxygen values on the lower end of their average ranges in the first quarter of the year (Figure 5.1), generally coinciding with the higher temperatures observed during the same period of time (Figure 4.4). Daily averages fell outside average ranges at Pine Island several times throughout the year (Figure 5.1 (a)). When temperatures were warmer (Jan-Mar, Aug), the values were lower than the average limit. After the cooler weather in October and the various weather events in the fall (Nor’easters and King Tides), the daily dissolved oxygen values increased above the average range. This year saw some of the lowest and most prolonged periods of dissolved oxygen at Pine Island in the last five years (Figure 5.2). Values fell below the 2 mg/L hypoxia threshold several times a day and for multiple days in August (Figure 5.2 (b); Table 5.1).
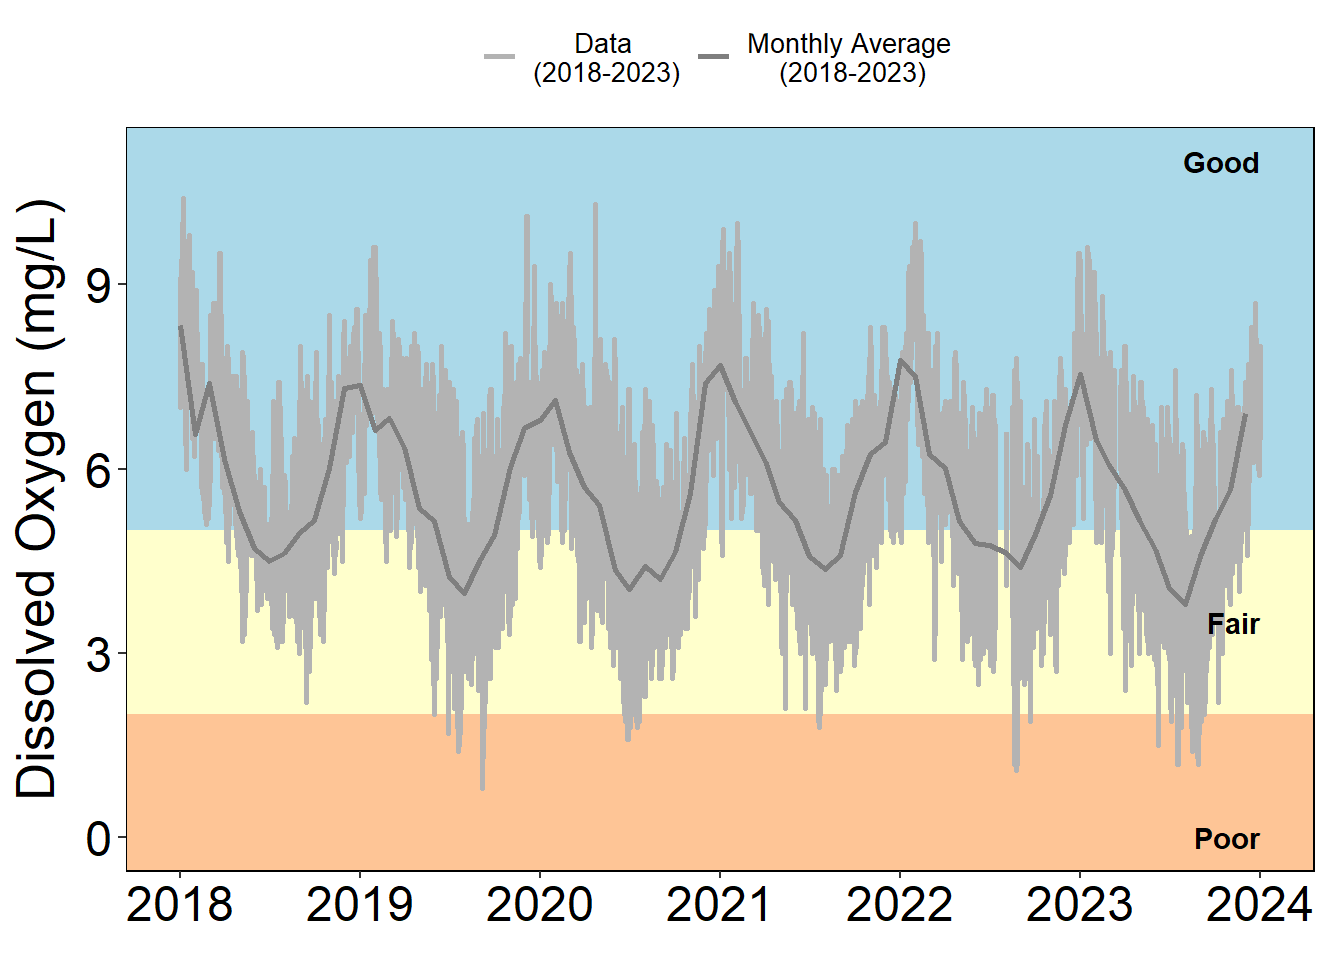
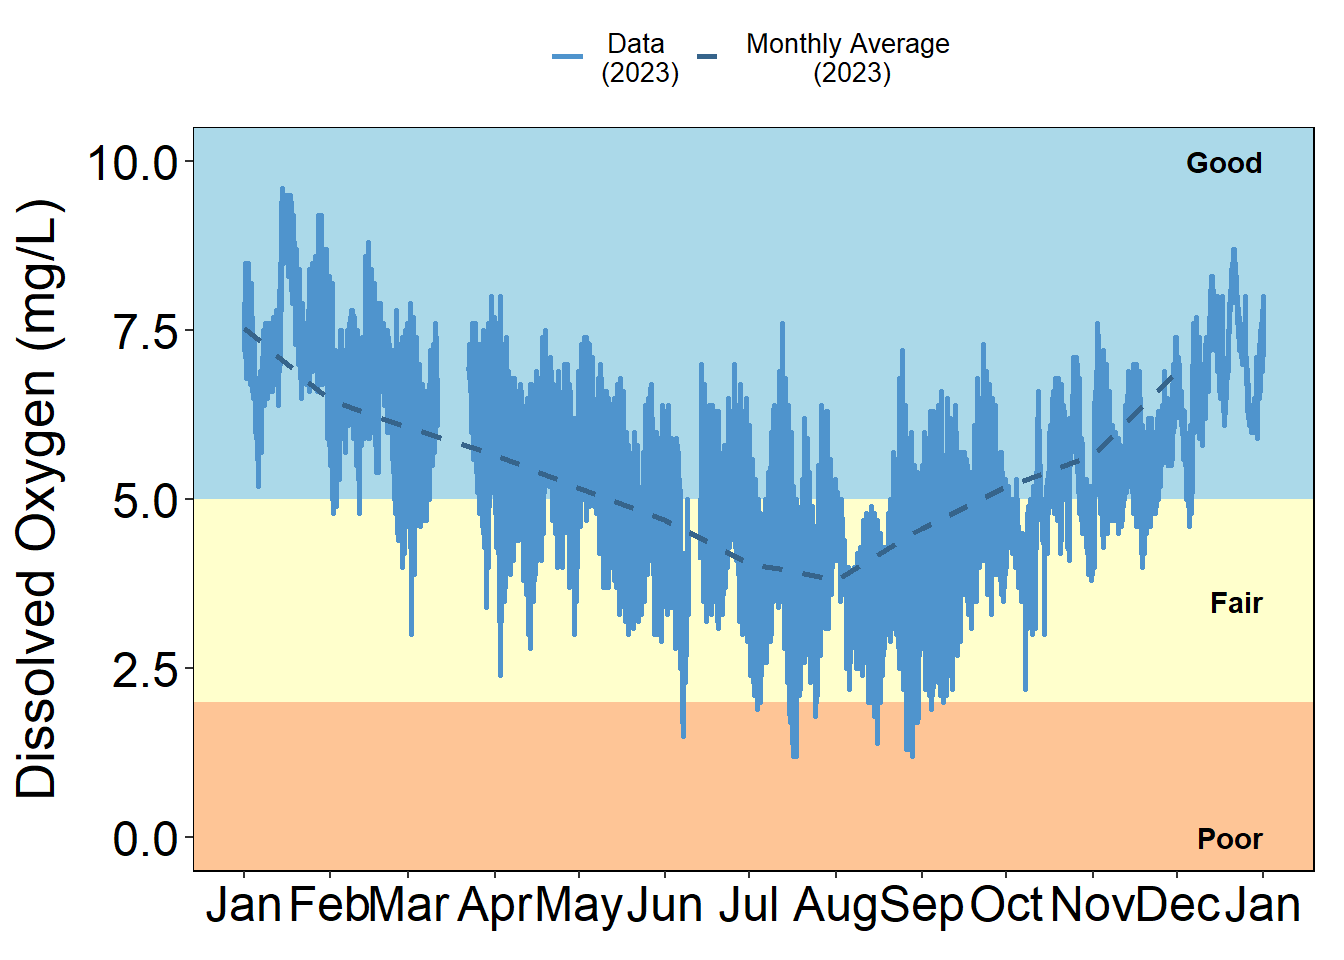
Pellicer Creek frequently experiences low dissolved oxygen events annually (Figure 5.3 (a)) and this year was no exception. Though daily averages were relatively within the average daily range (Figure 5.1 (d)), closer inspection of the continuous data show several low dissolved oxygen events in July and August, in particular (Figure 5.3 (b)). The duration of these events were often not long and not as frequent as Pine Island (Table 5.2).
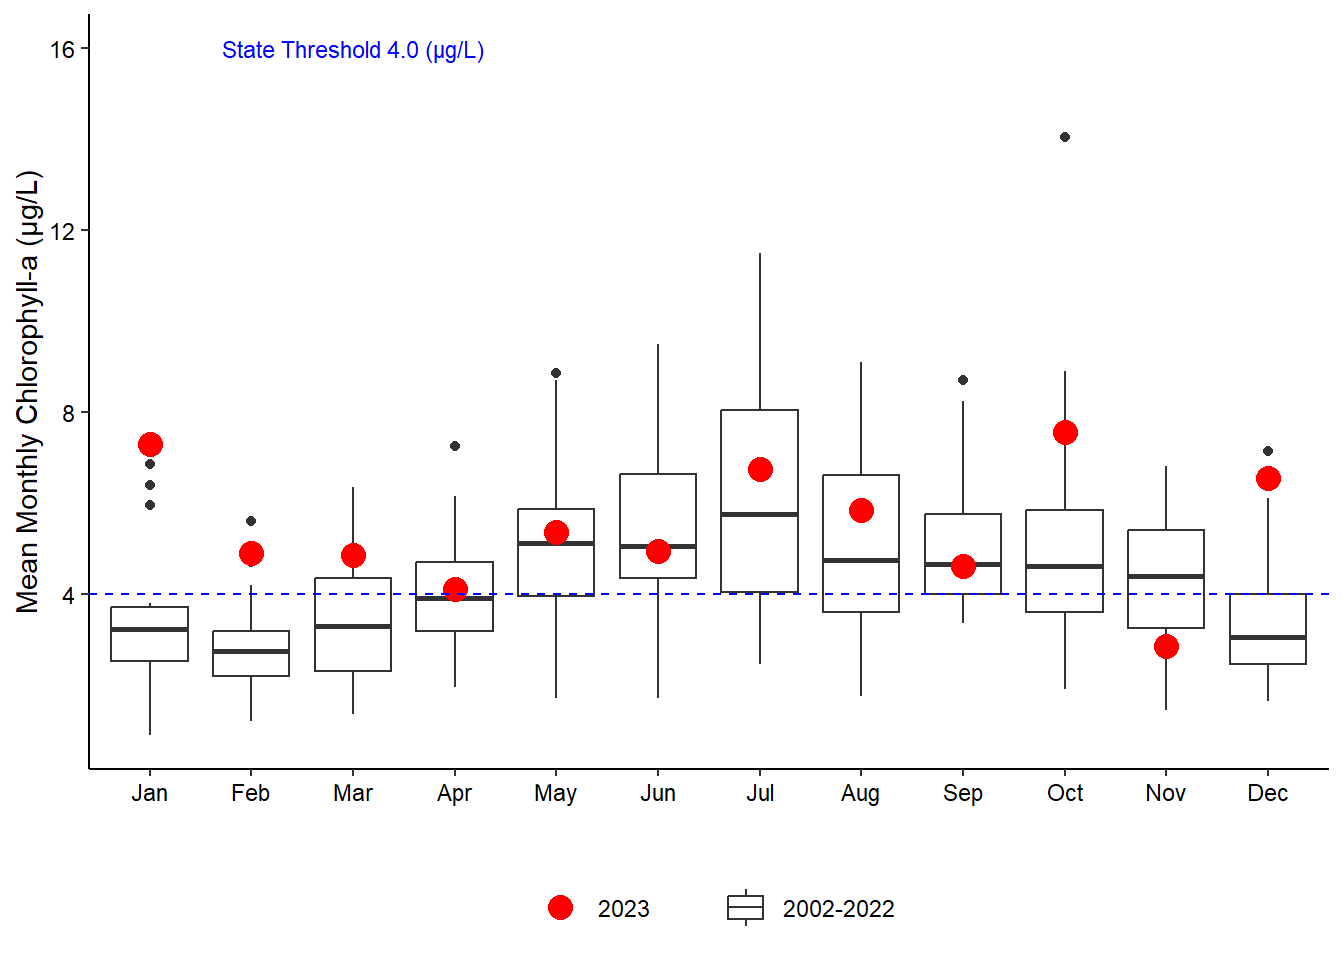
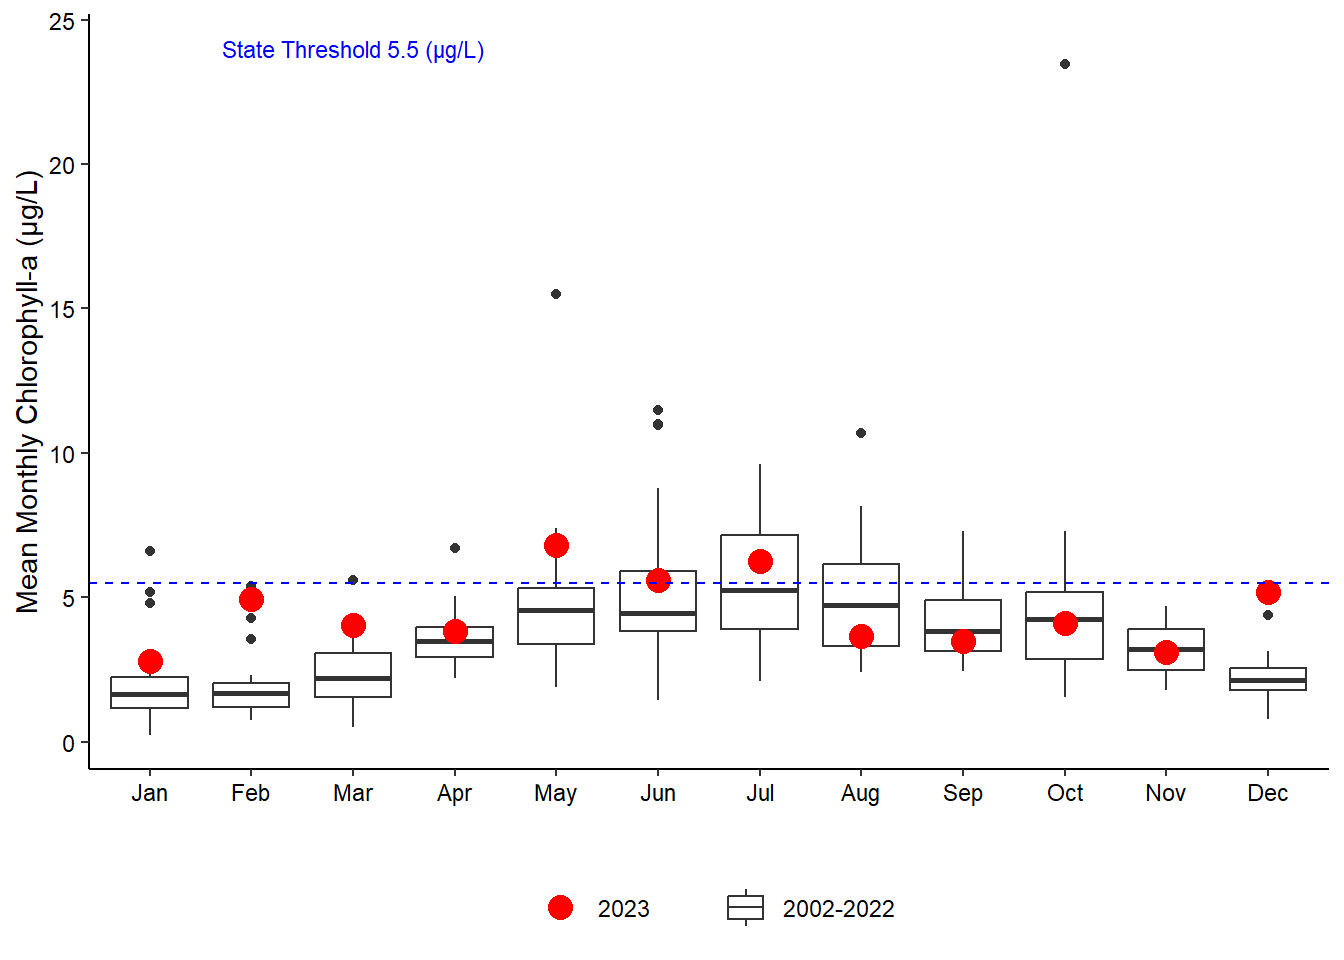
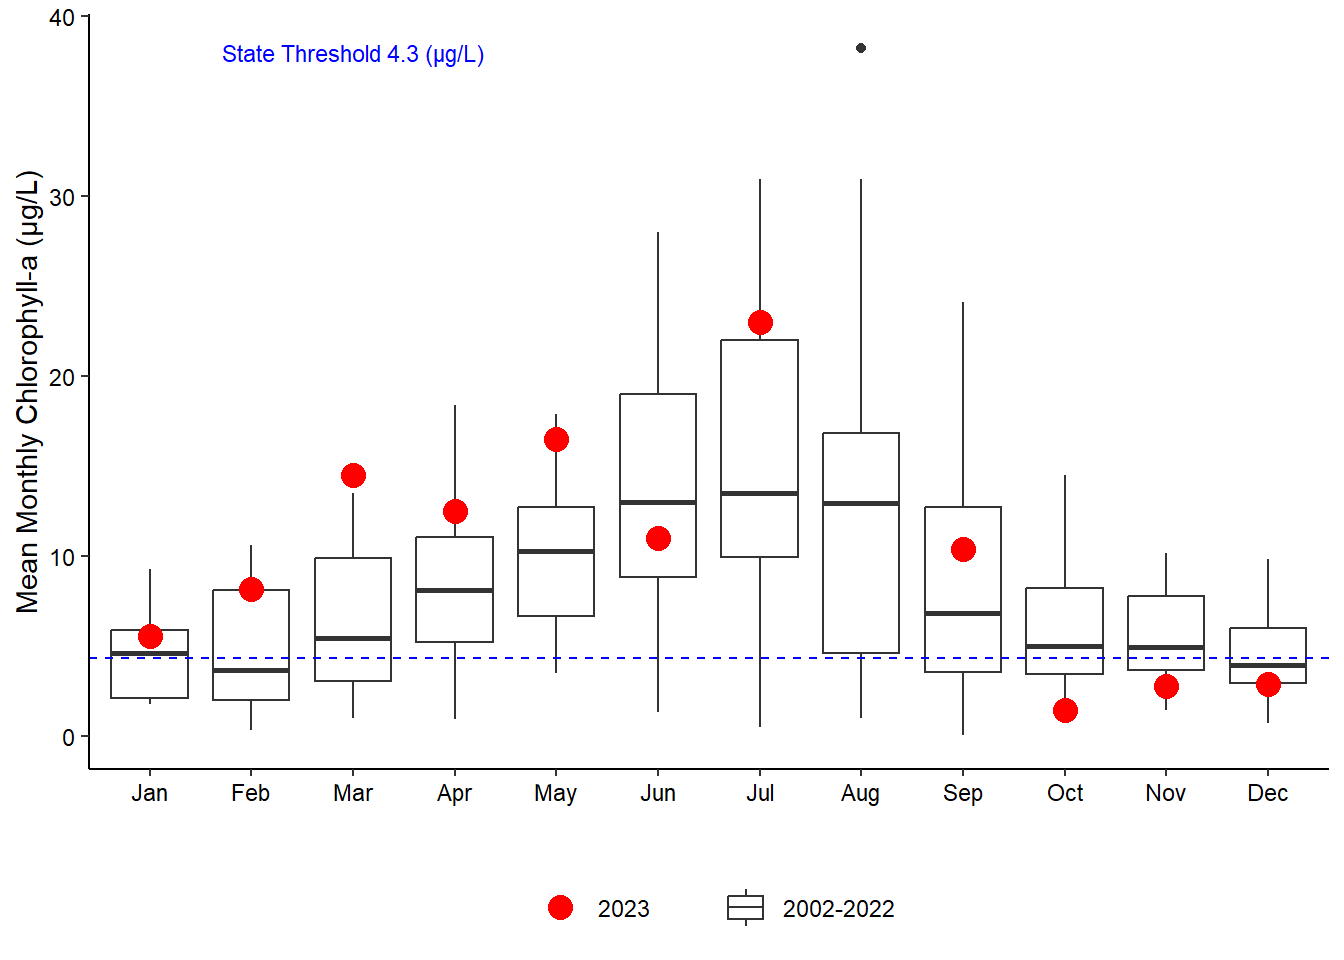
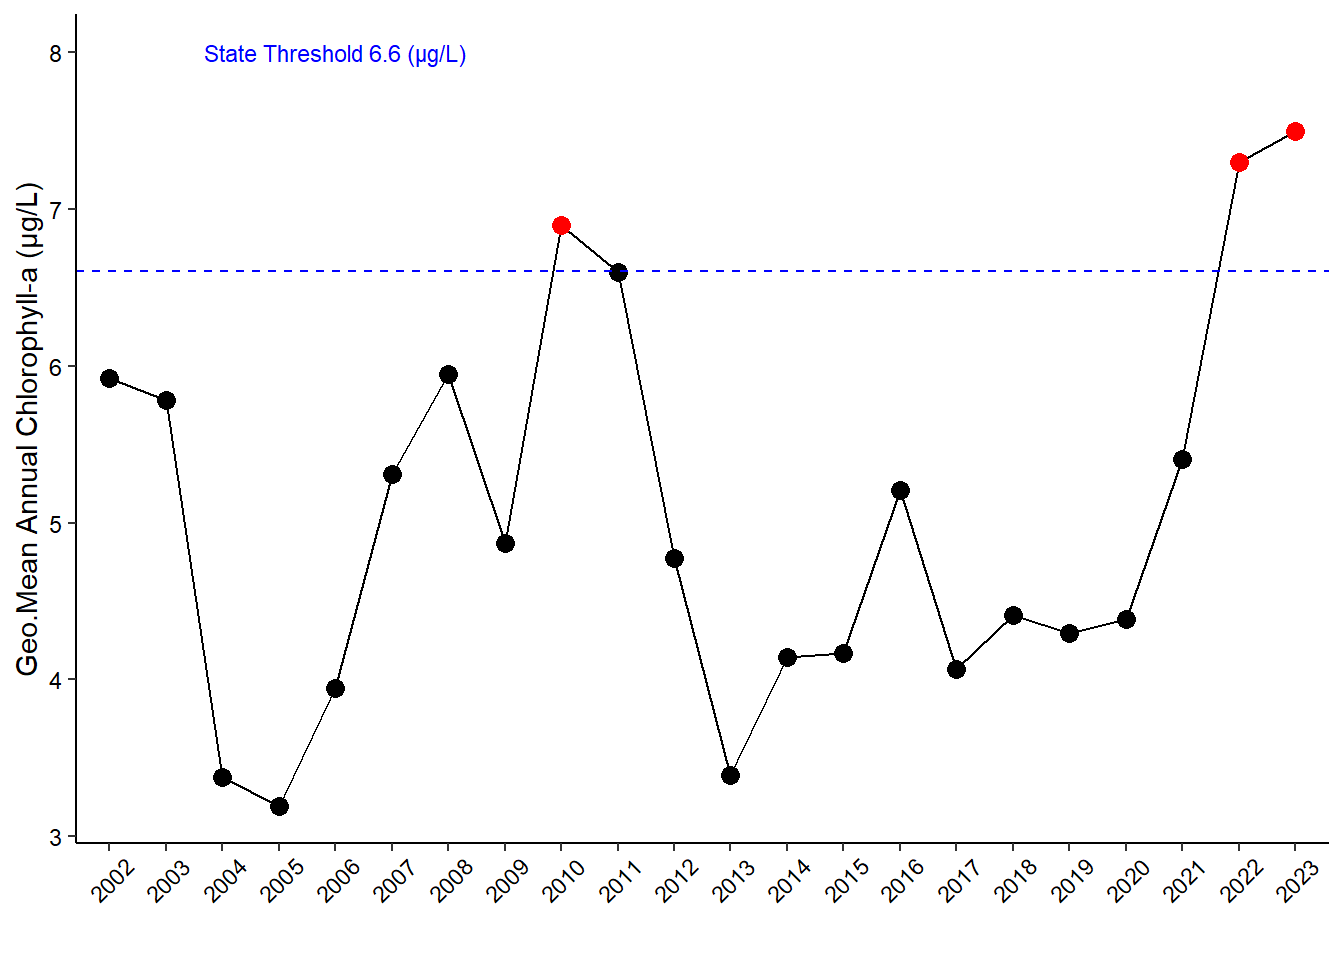
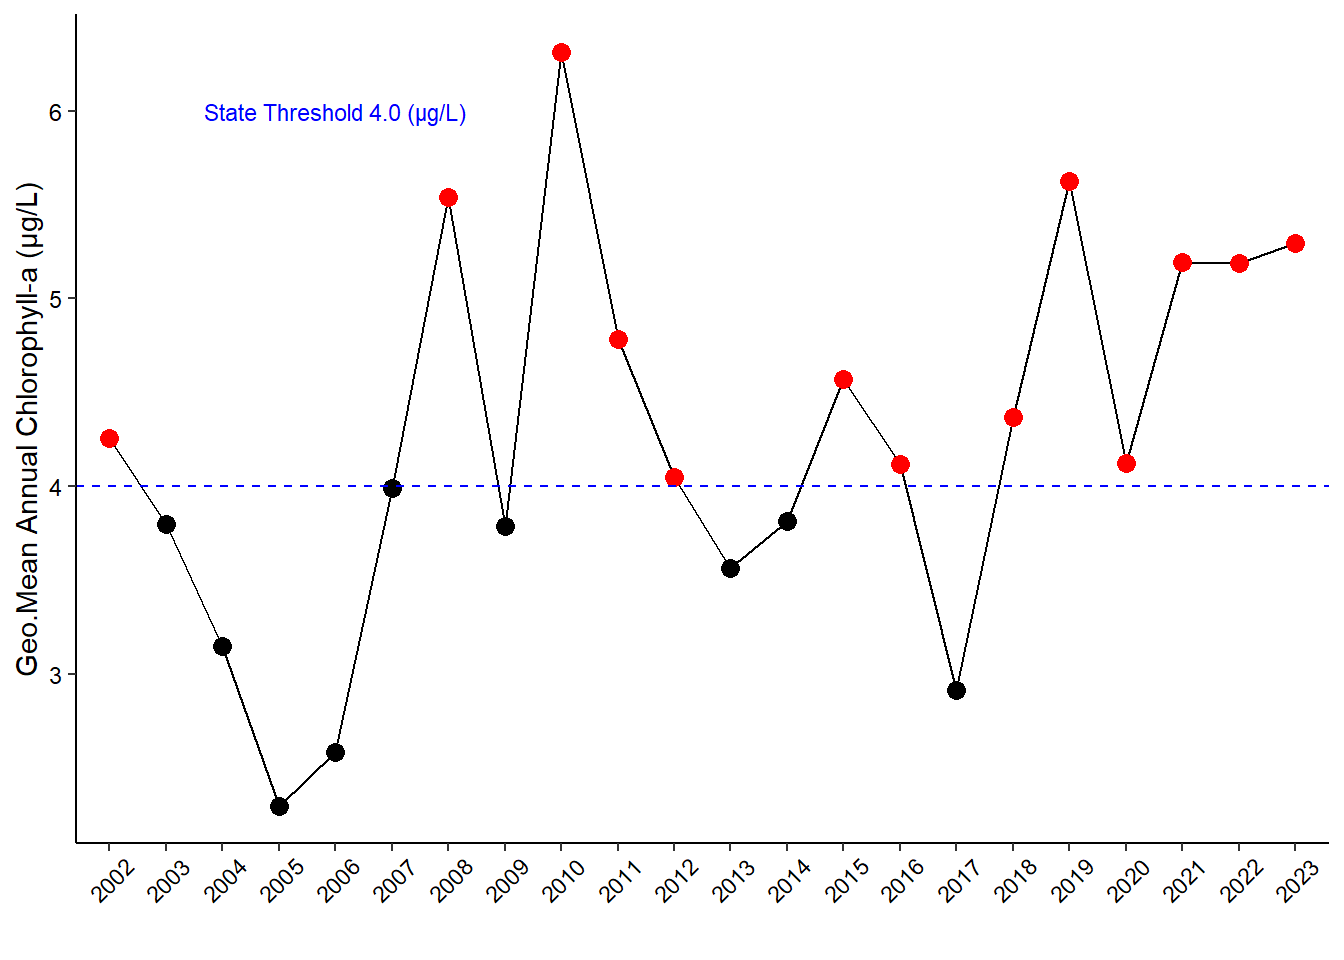
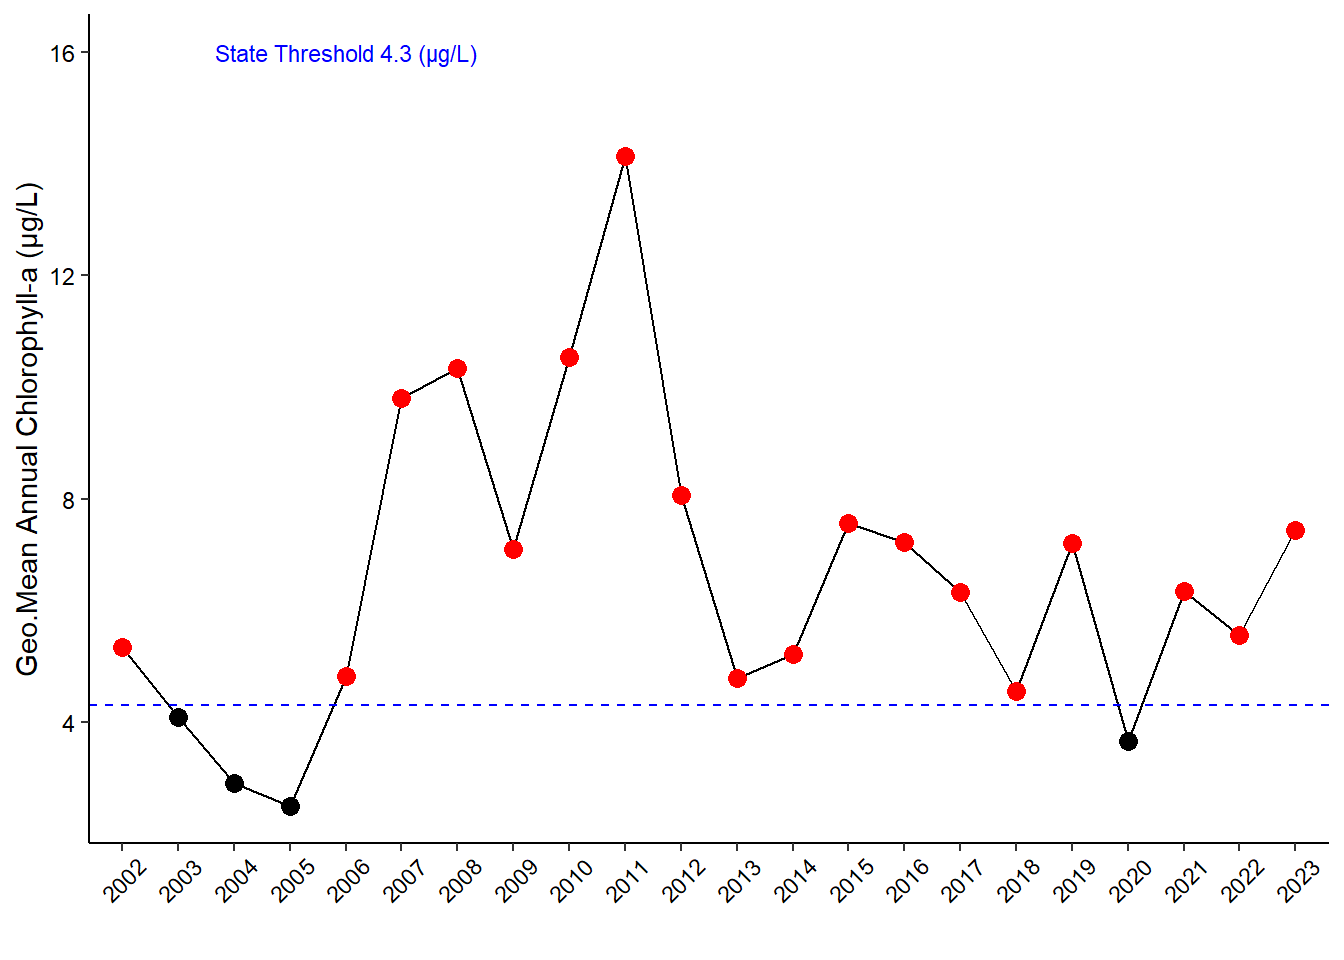
Chlorophyll a values were often higher than average at all stations this year (Figure 5.4). Chlorophyll a at Pine Island more often fell above the state threshold (6.6 \(\mu\)g/L) than below and record monthly high values were observed in January (7.0 \(\mu\)g/L), March (9.8 \(\mu\)g/L), and September (12 \(\mu\)g/L) (Figure 5.4 (a)). San Sebastian also saw high chlorophyll a for every month except November and December (data of which is not included in this report at this time) with a record high in January of 7.3 \(\mu\)g/L. November, however, was much lower than normal at this station (Figure 5.4 (b)). Elevated chlorophyll a was observed from May through July at Fort Matanzas (Figure 5.4 (c)). Pellicer Creek was consistently high for most of the year, with a record value in March (14.5 \(\mu\)g/L), but experienced lower than normal ranges in October and November (Figure 5.4 (d)). Annual geometric mean (AGM) chlorophyll a values were high and above the state threshold levels at all sites except for Fort Matanzas (Figure 5.5). These values do not include data from December 2023 as that data has not been received from the laboratory as of the current edition of this report. Therefore, these values are likely to change following the addition of the final month of the year.
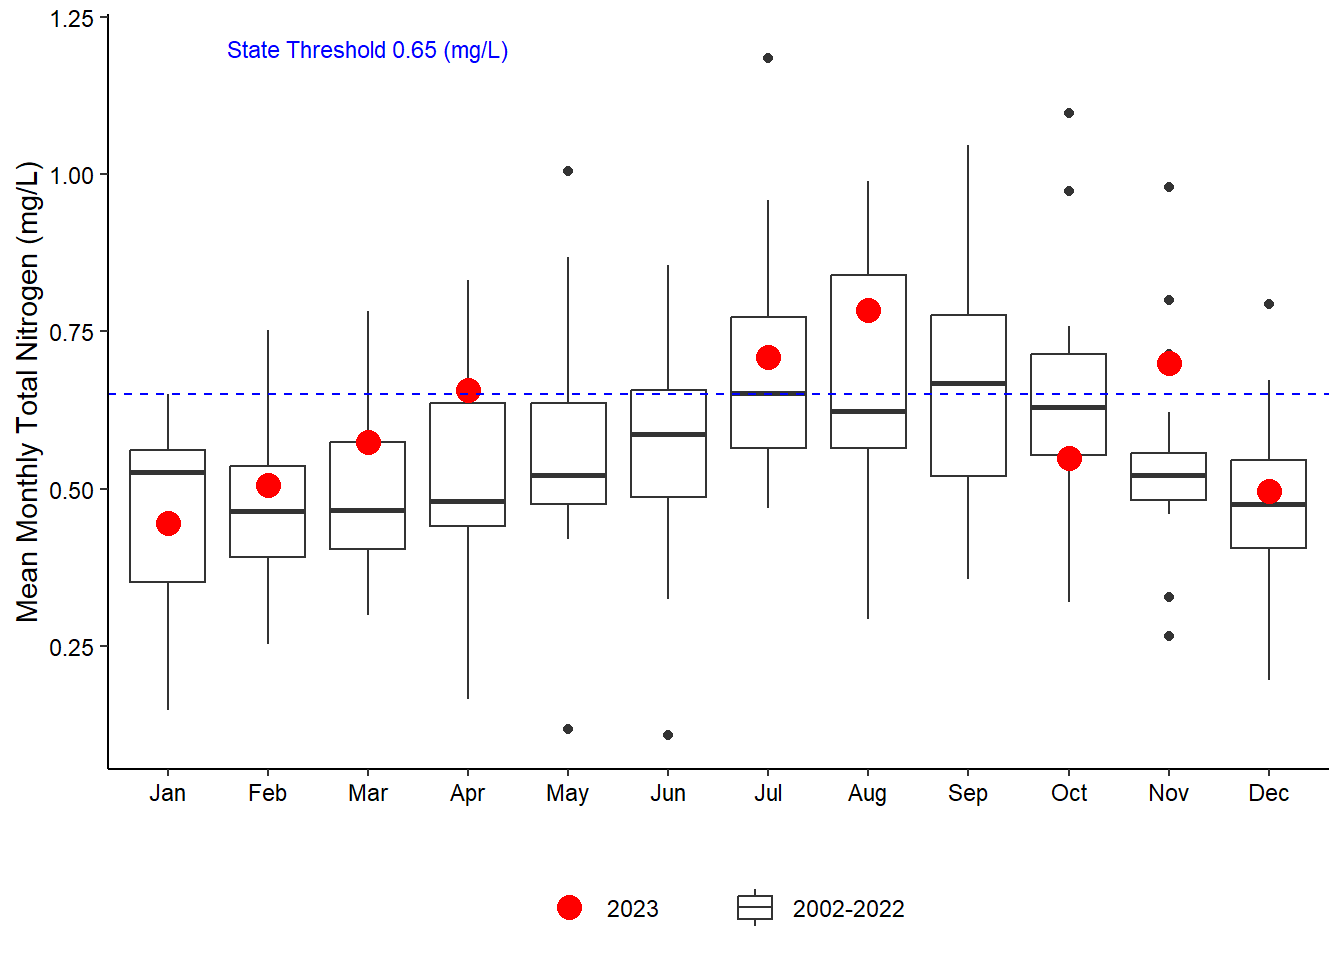
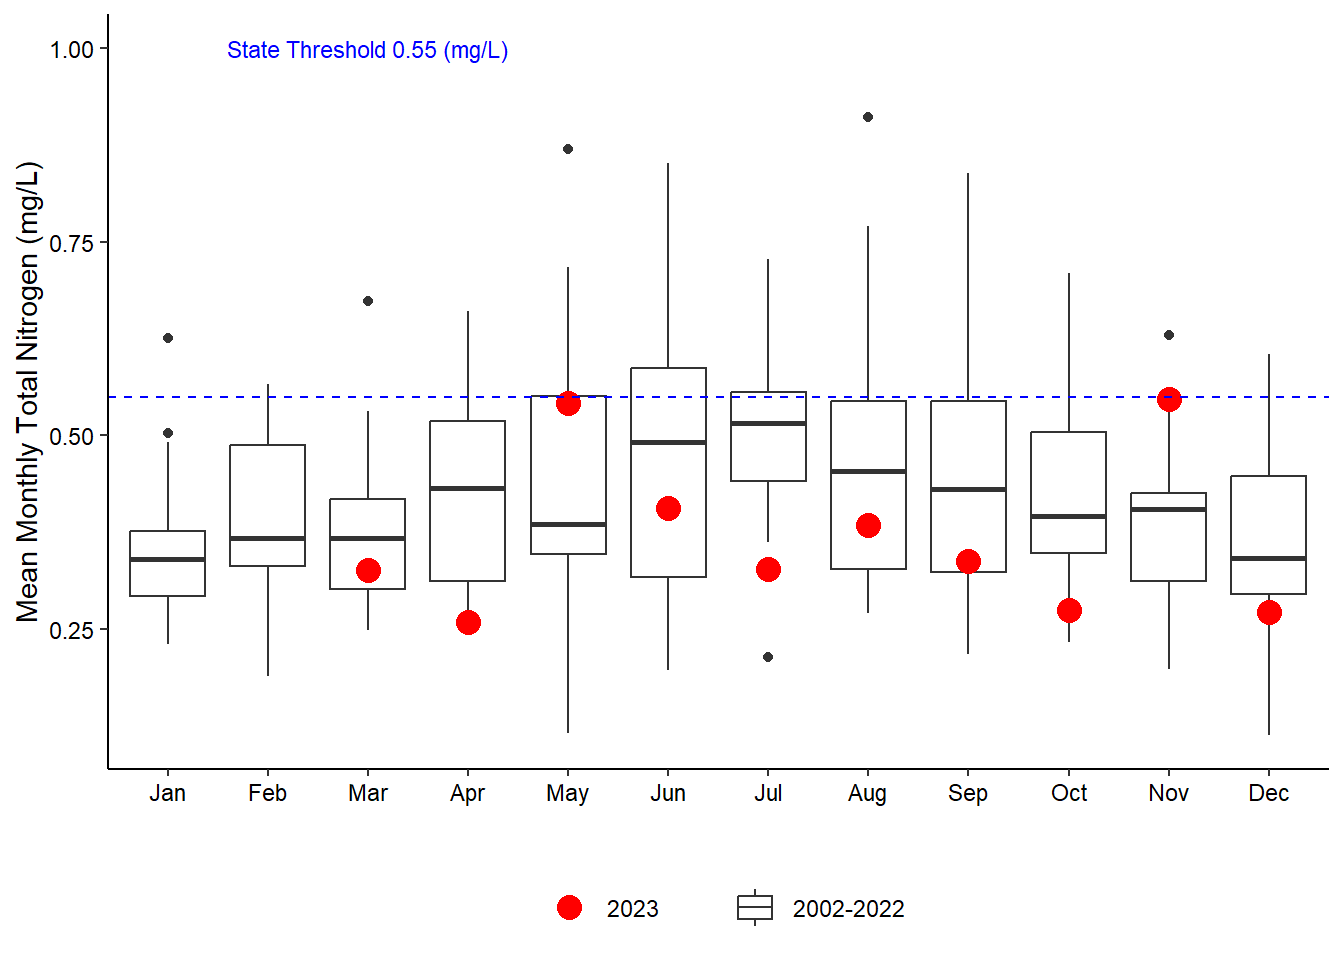
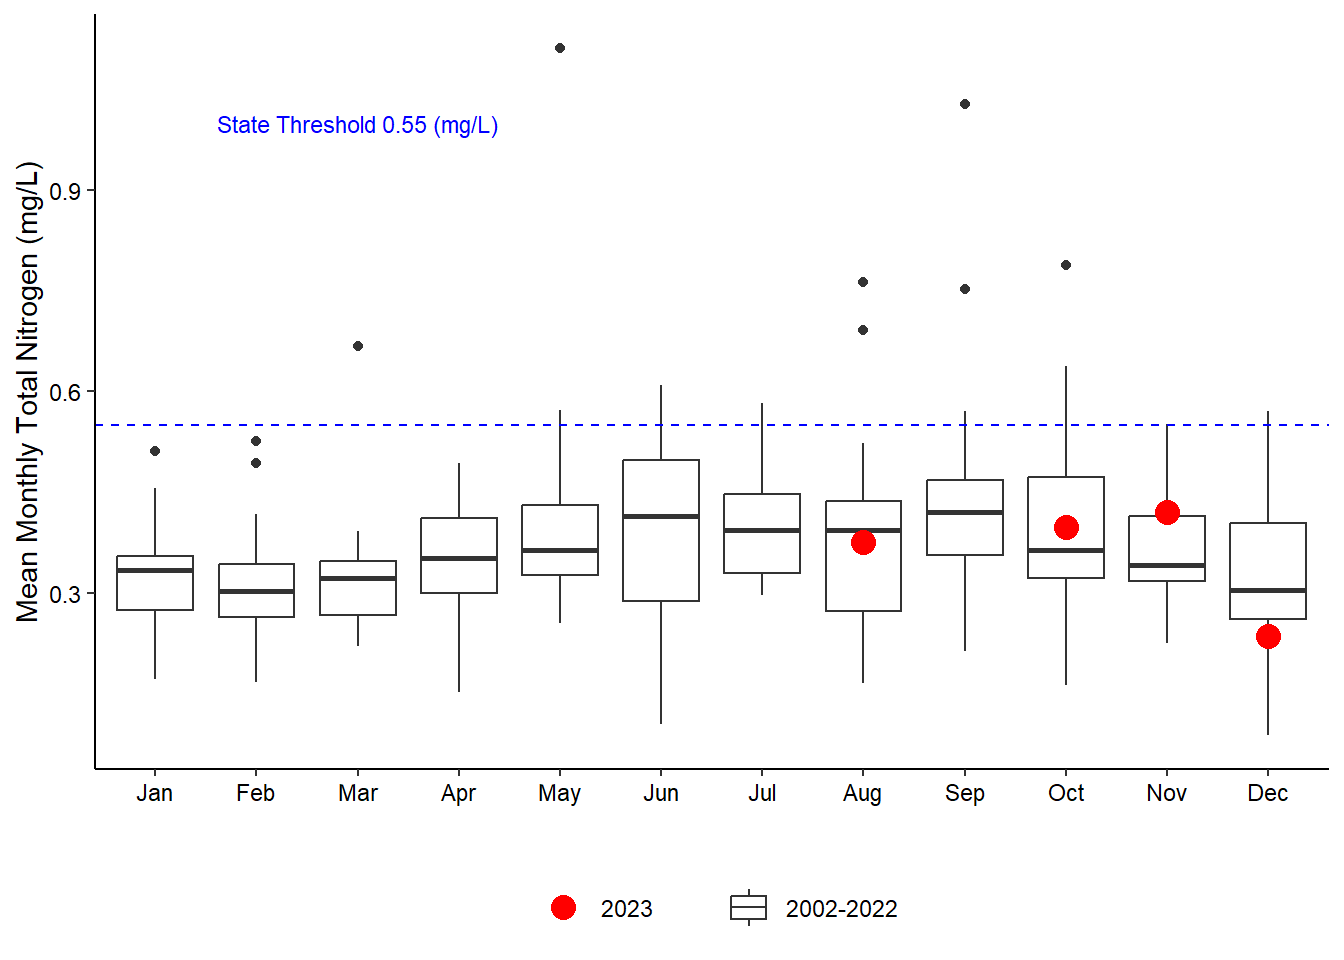
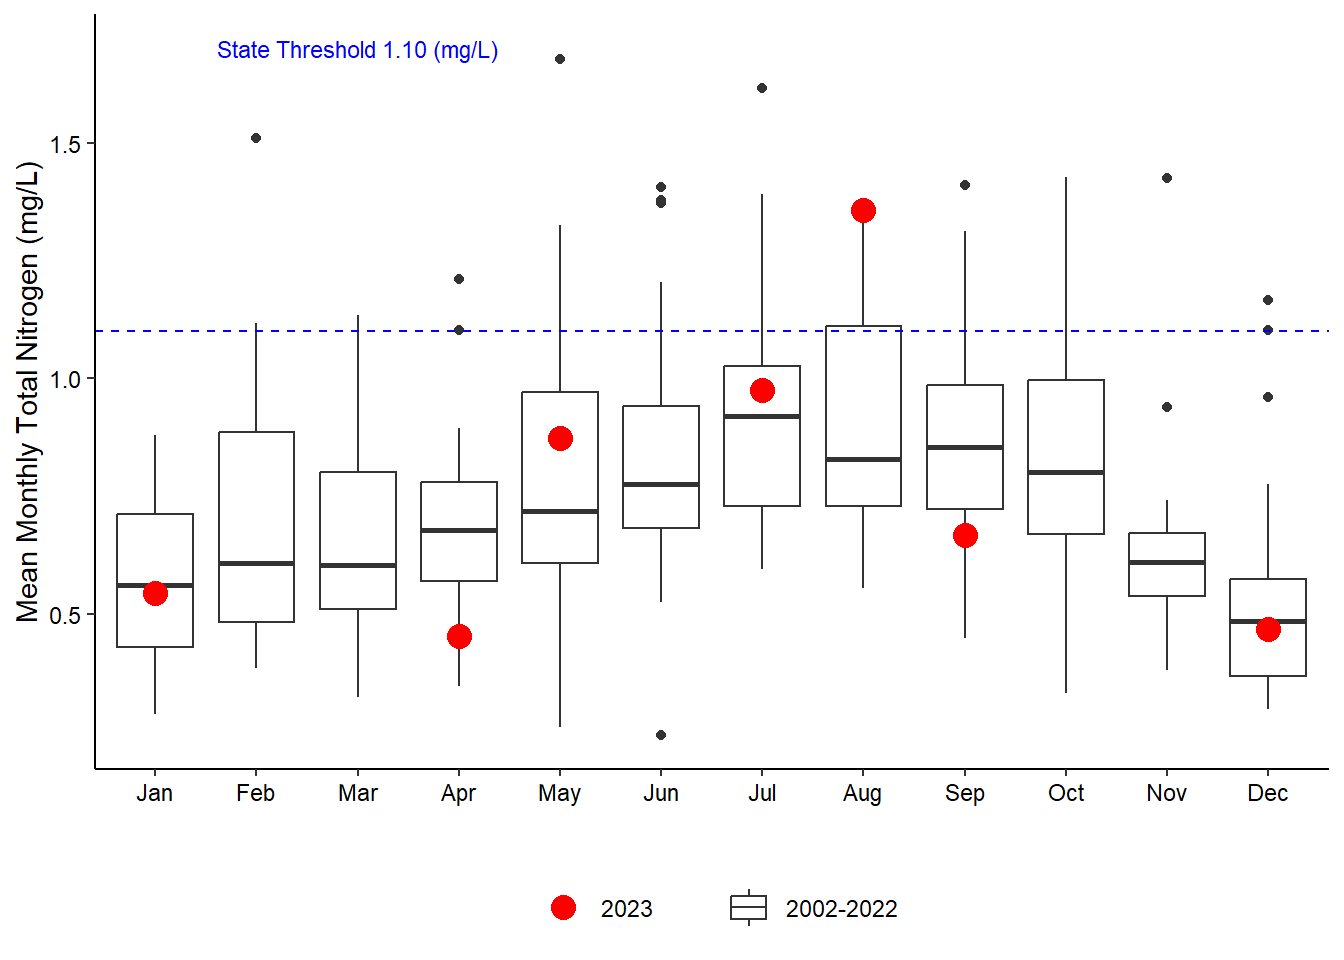
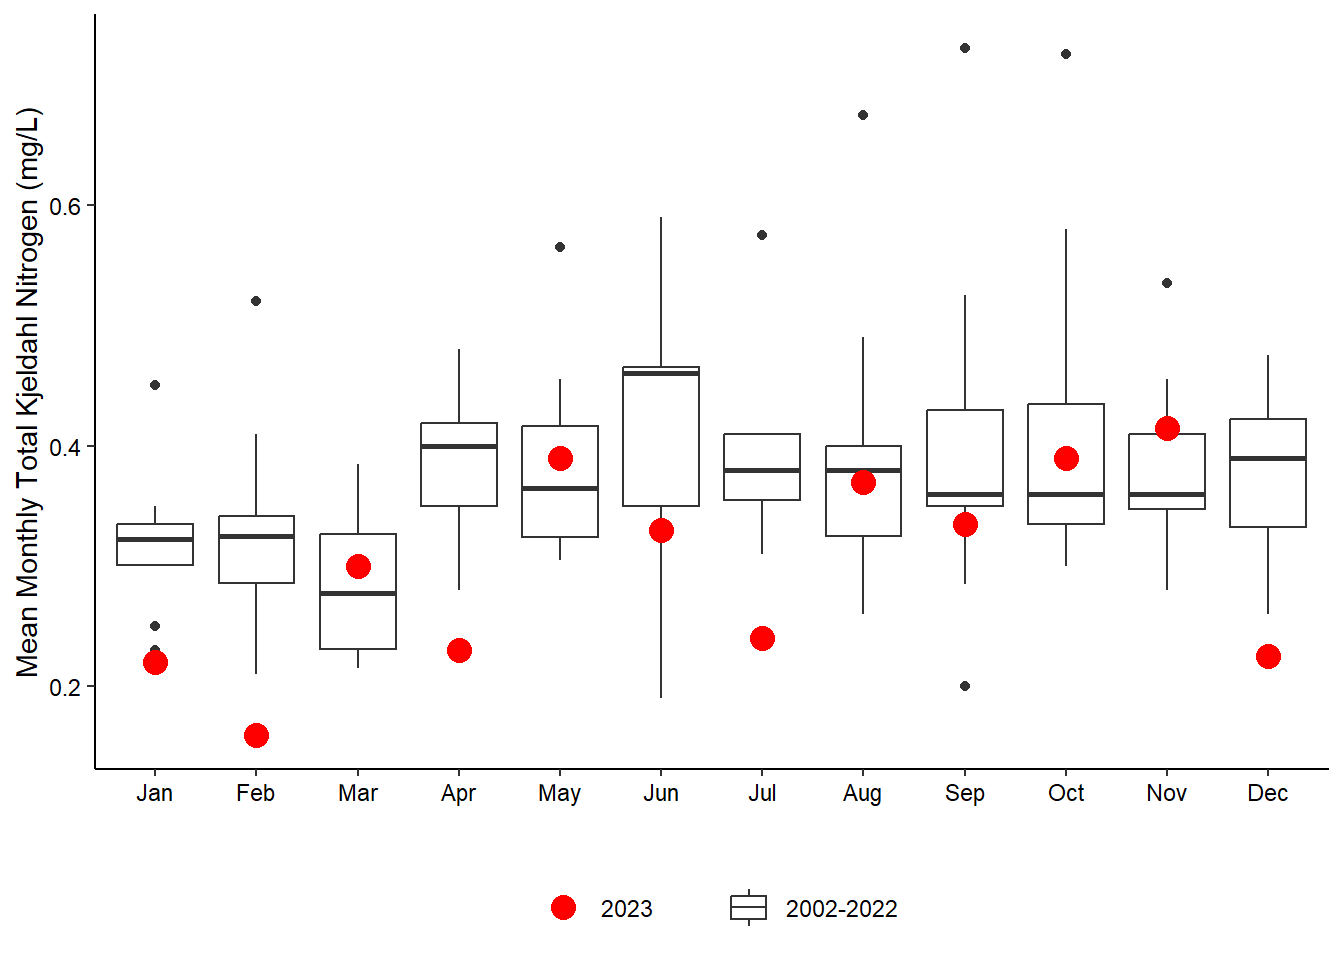
Interpretations of patterns in total nitrogen (TN) and dissolved inorganic nitrogen (DIN) were difficult this year since quite a bit of the values were not able to be calculated. At Pine Island and Pellicer Creek, however, high TN was observed in the high rainfall months of July and August and also in November (Figure 5.6). Total Kjeldahl Nitrogen (TKN) was lower than average for most stations; however, all stations experienced higher levels in May, August, and November (Figure 5.8).
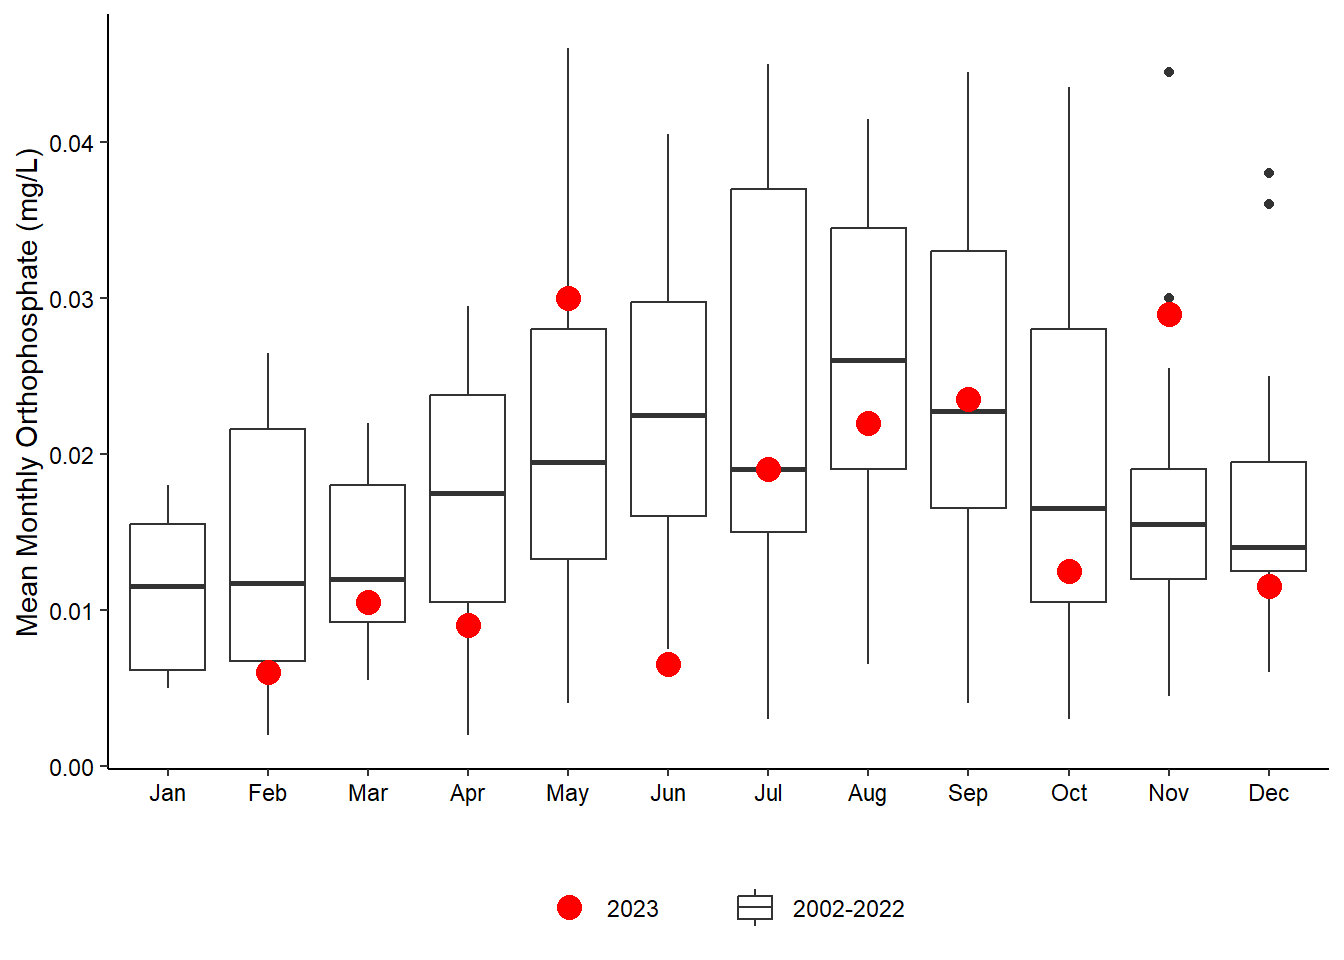
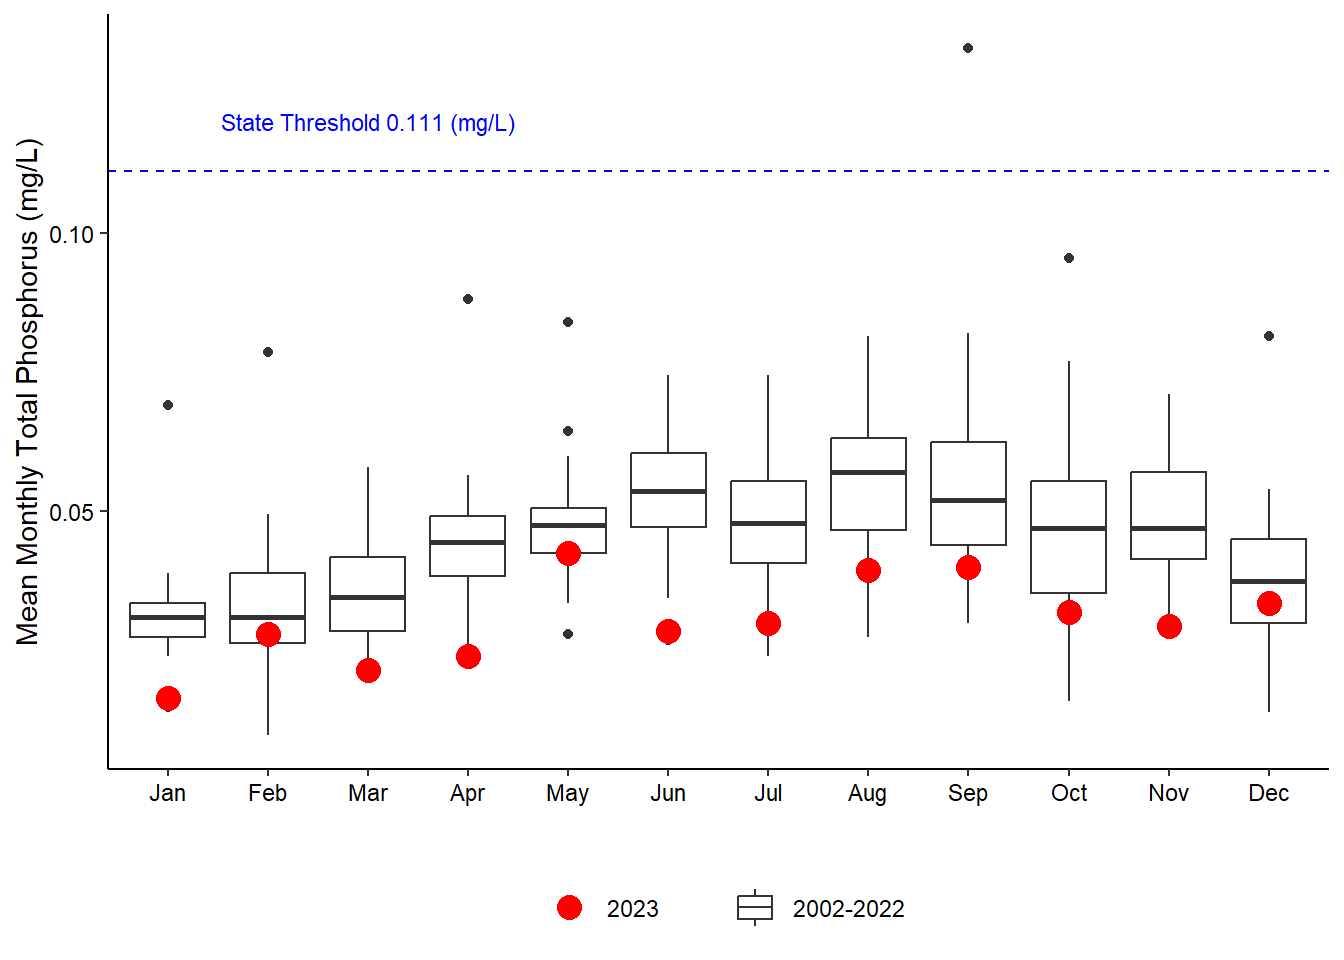
Total phosphorus continues to fall below the state threshold for every station and similar to TKN, all stations experienced elevated values of total phosphorus and orthophosphate in May (Figure 5.9; Figure 5.10). Relatively high levels of orthophosphate were observed at Pine Island January through May and again in August (Figure 5.10 (a)).
5.2 Data
5.2.1 Dissolved Oxygen

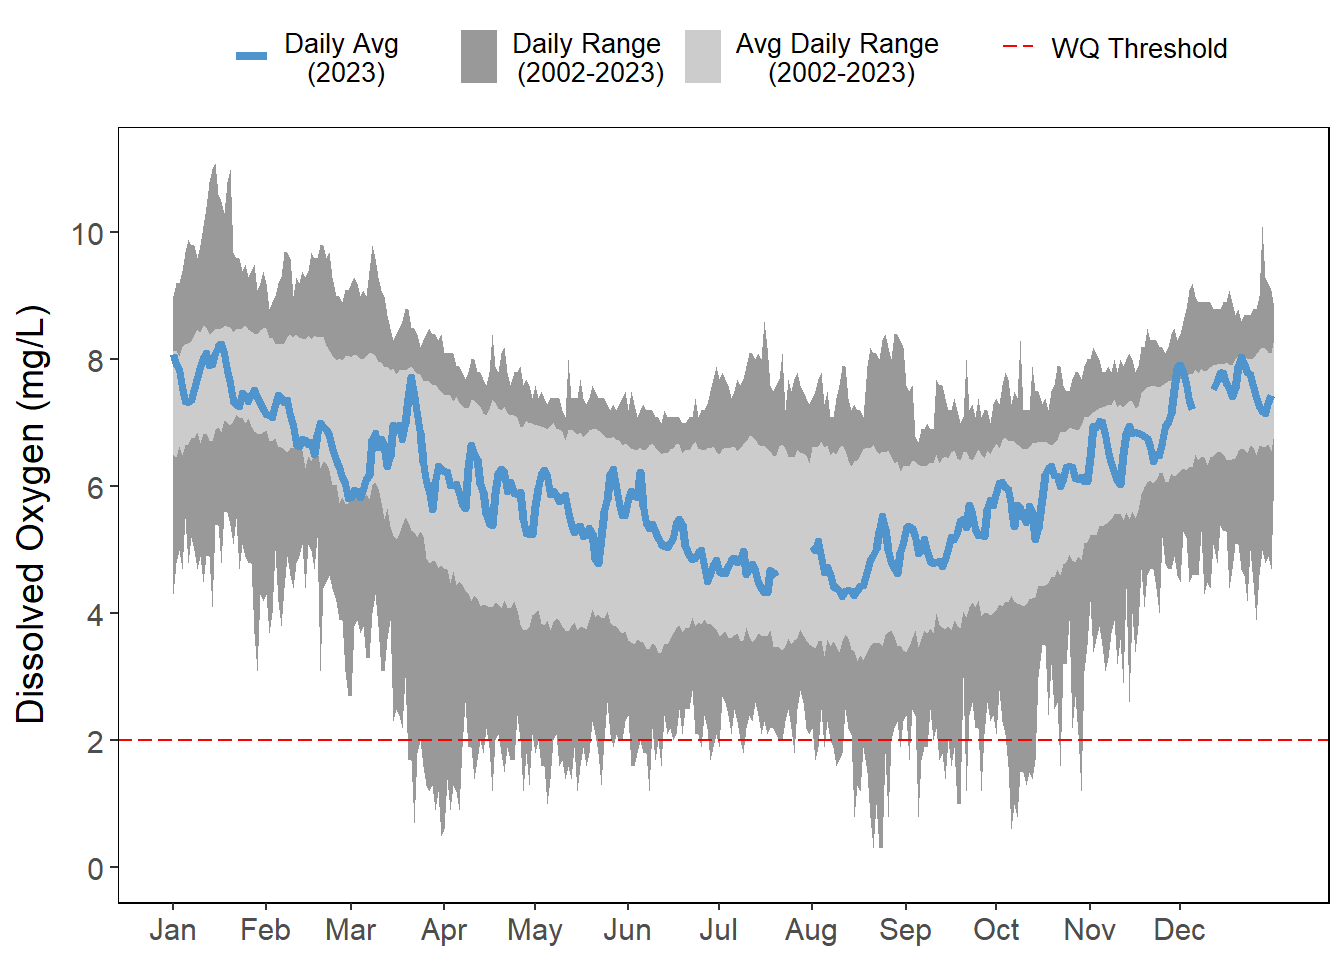


Dissolved oxygen at Pine Island has been uncharacteristically low in the past two years.
Pellicer Creek is located within a waterbody with known impairments for dissolved oxygen, chlorophyll a, and fecal coliform bacteria. As such, this station frequently experiences low dissolved oxygen values, particularly in the summer months (Figure 5.3).
| Start Time | End Time | Duration (hrs) |
|---|---|---|
| 2023-07-17 14:15:00 | 2023-07-17 15:00:00 | 1.00 |
| 2023-08-15 13:00:00 | 2023-08-15 15:30:00 | 2.75 |
| 2023-08-26 09:15:00 | 2023-08-26 10:15:00 | 1.25 |
| 2023-08-26 10:45:00 | 2023-08-26 13:15:00 | 2.75 |
| 2023-08-27 12:00:00 | 2023-08-27 14:30:00 | 2.75 |
| 2023-08-30 05:15:00 | 2023-08-30 05:45:00 | 0.75 |
5.2.2 Chlorophyll a


5.2.3 Nitrogen
5.2.3.1 Total Nitrogen
TN is calculated by adding TKN and NO23. It accounts for the inorganic nitrogen fraction as well as larger pools of organic bioavailable forms.
Several of the NO23 values fell below the Florida Department of Environmental Protection Central Lab’s minimum detection limit and therefore TN was not able to be calculated and is missing for quite a few months at all the stations (Figure 5.6). This was especially true at Fort Matanzas which has the least amount of TN data (Figure 5.6 (c)).
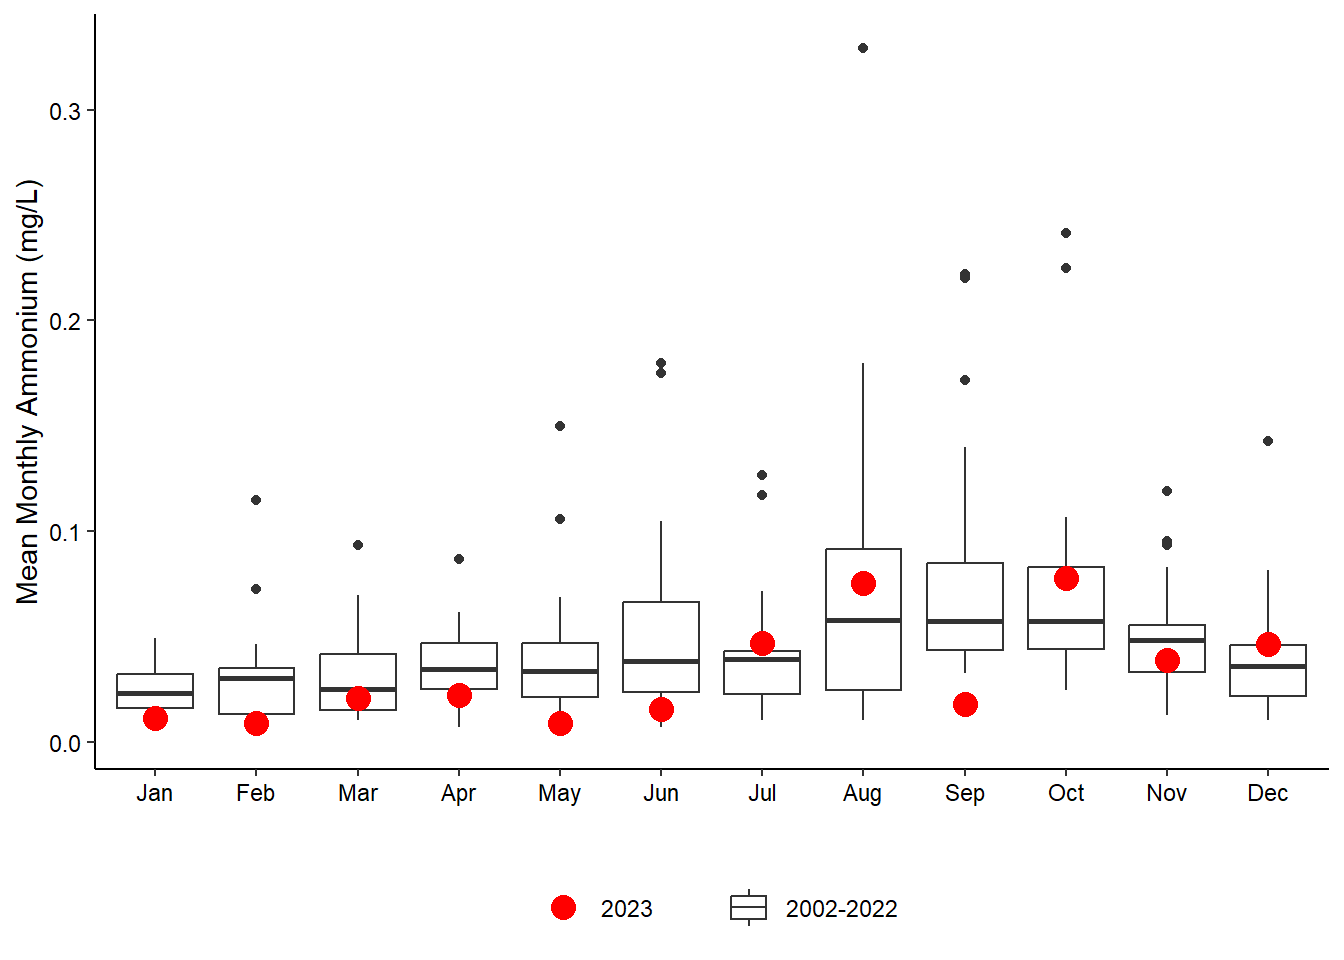
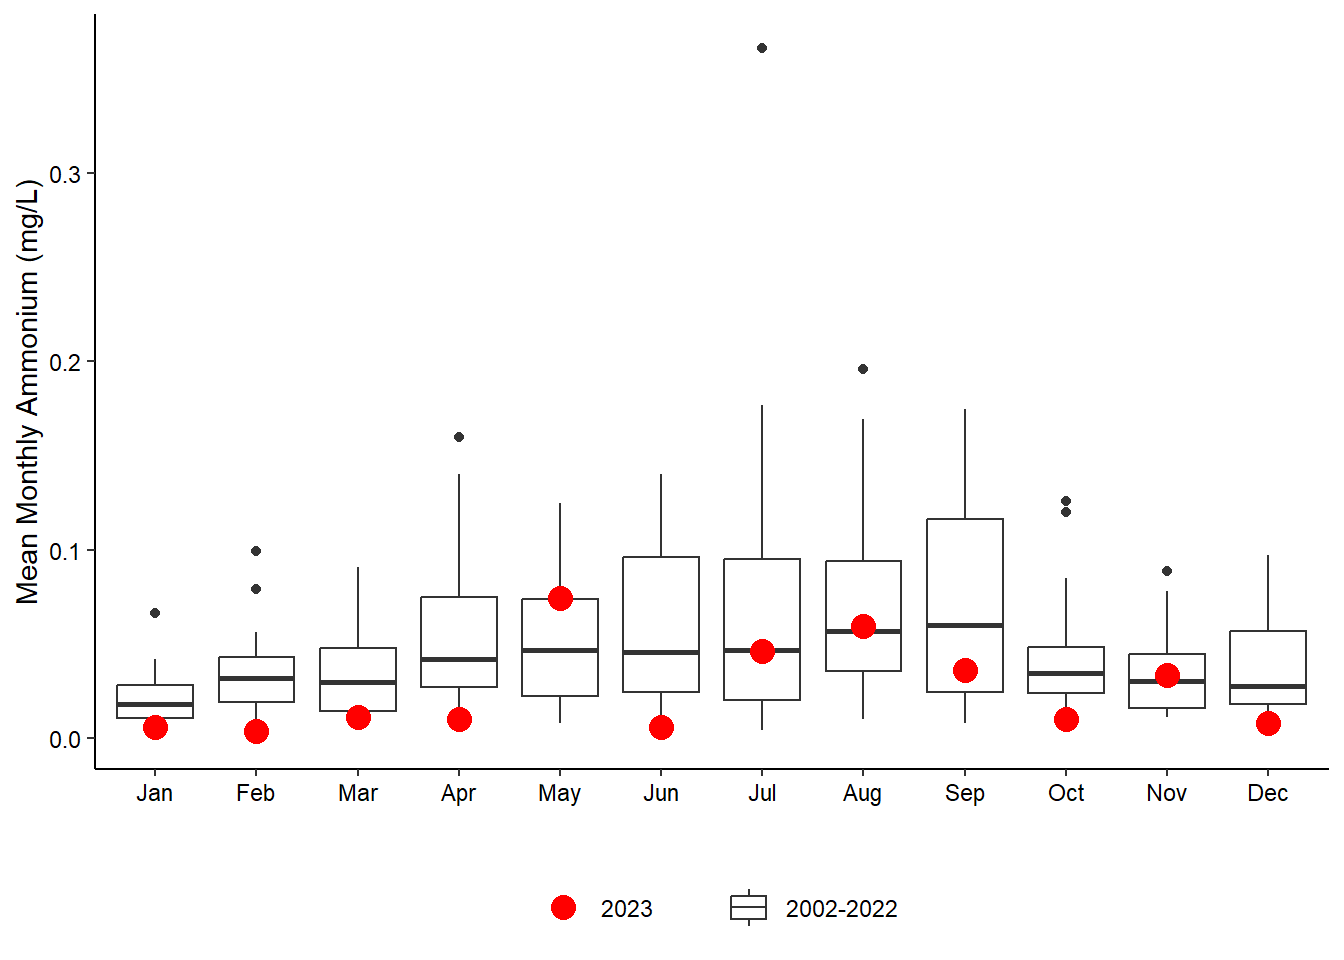
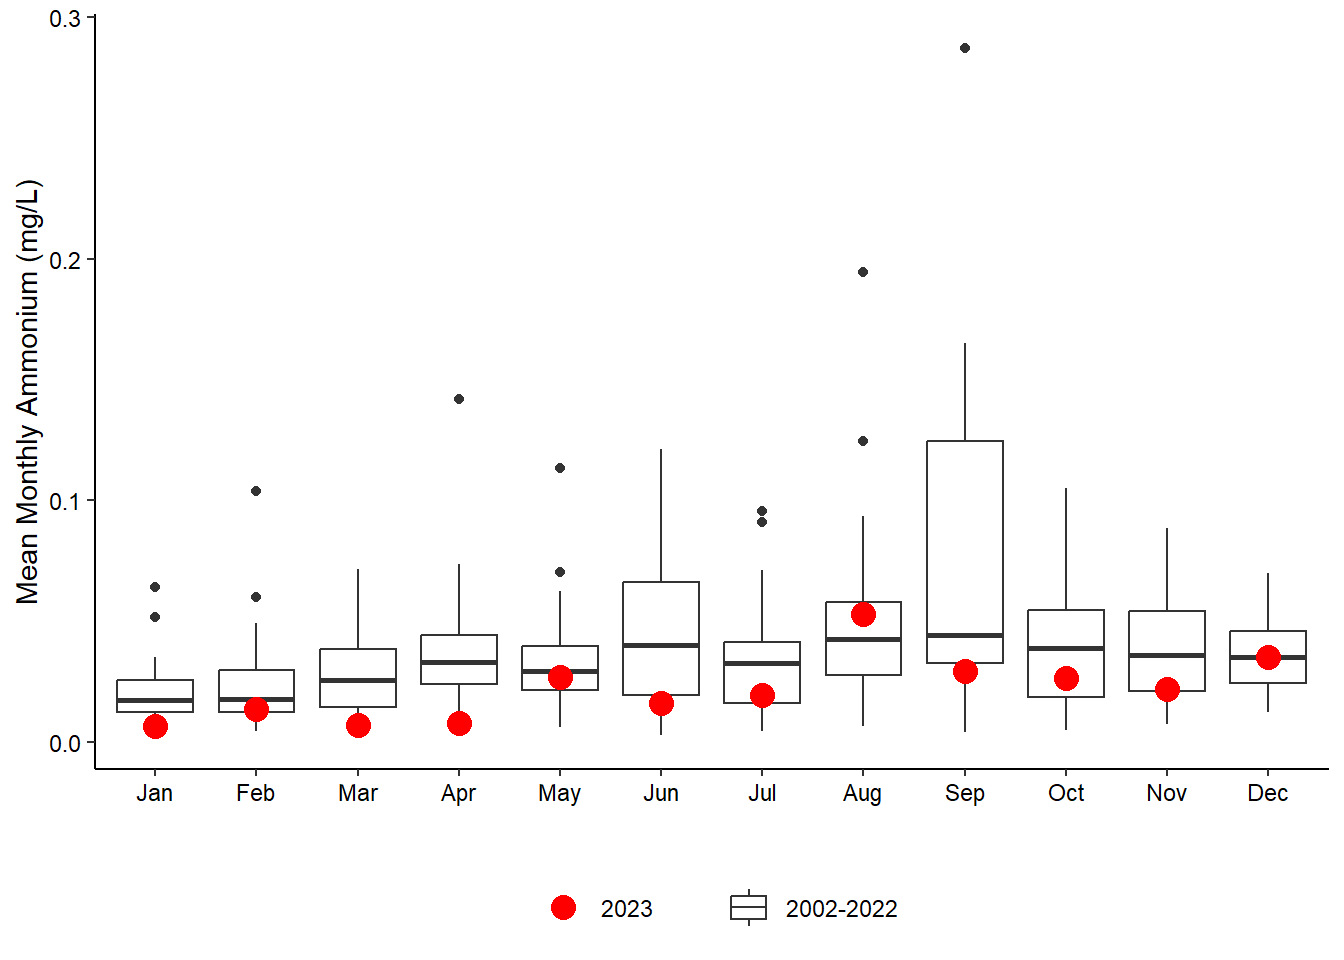
5.2.3.2 Ammonium
Ammonium is directly measured in our samples and is a key inorganic nutrient assimilated by phytoplankton in primary production.

5.2.3.3 Total Kjeldahl Nitrogen
TKN is the total concentration of organic nitrogen and ammonia. It is directly measured in our samples.


5.2.4 Phosphorus
5.2.4.1 Total Phosphorus

5.2.4.2 Orthophosphate