7 Other Indicators
Other indicators include dissolved organic carbon (DOC) and bacteria levels (fecal coliform and Enterococcus) that are collected at each station.
The SWMP began analyzing water samples at each station for fecal coliform bacteria in 2013. In 2019, collections for Enterococcus bacteria began and both are now collected at all four stations. Due to overnight shipping requirements, all bacteria samples are qualified by the DEP laboratory as out of hold times. For proper analyses, hold times for these samples are not to exceed 7 hours from collection. Therefore, the SWMP uses this data to show general patterns and trends only.
7.1 Summary
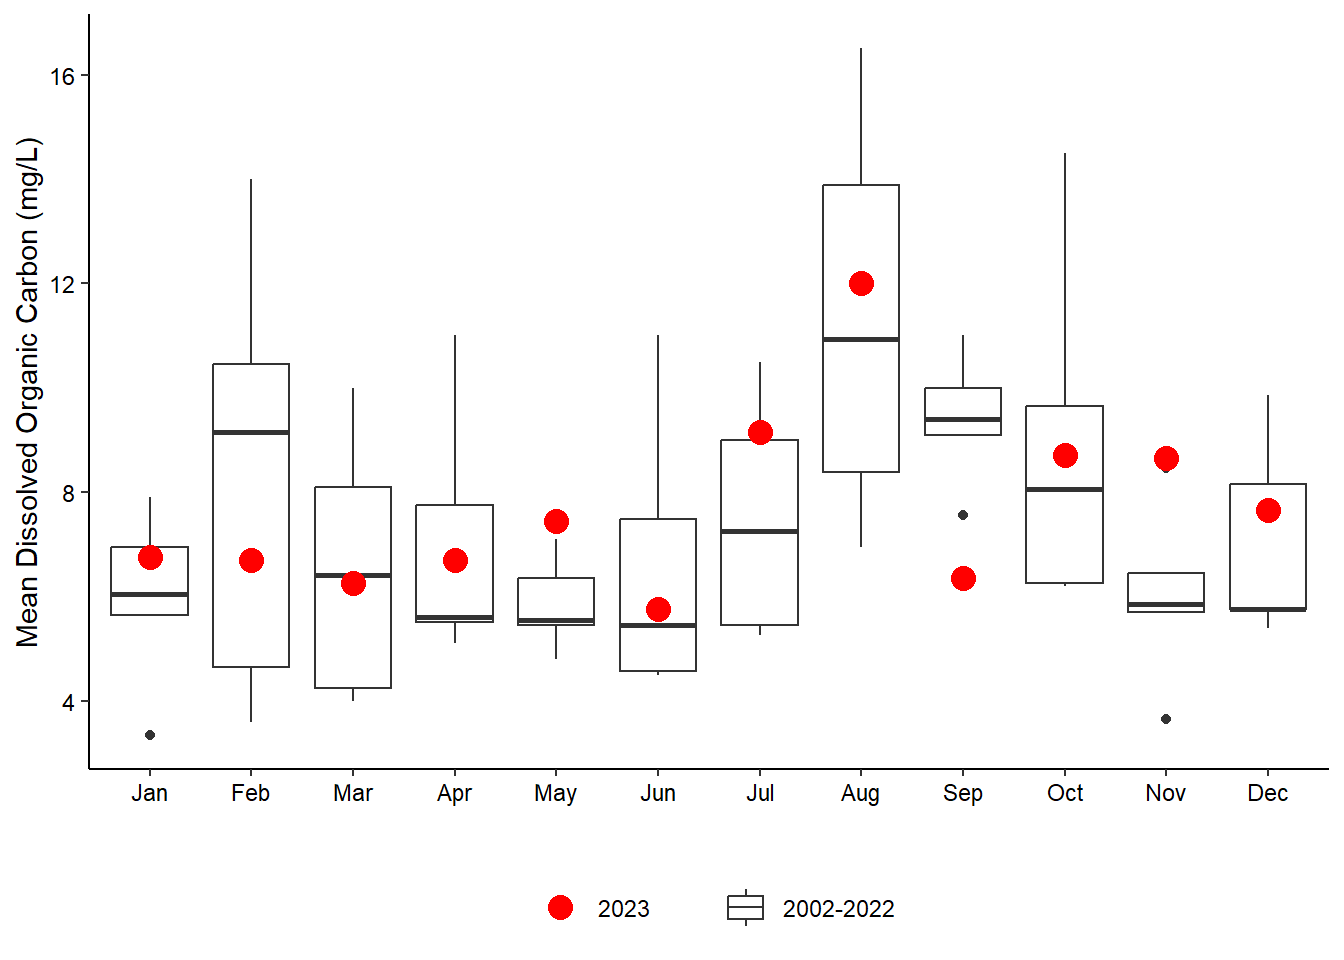
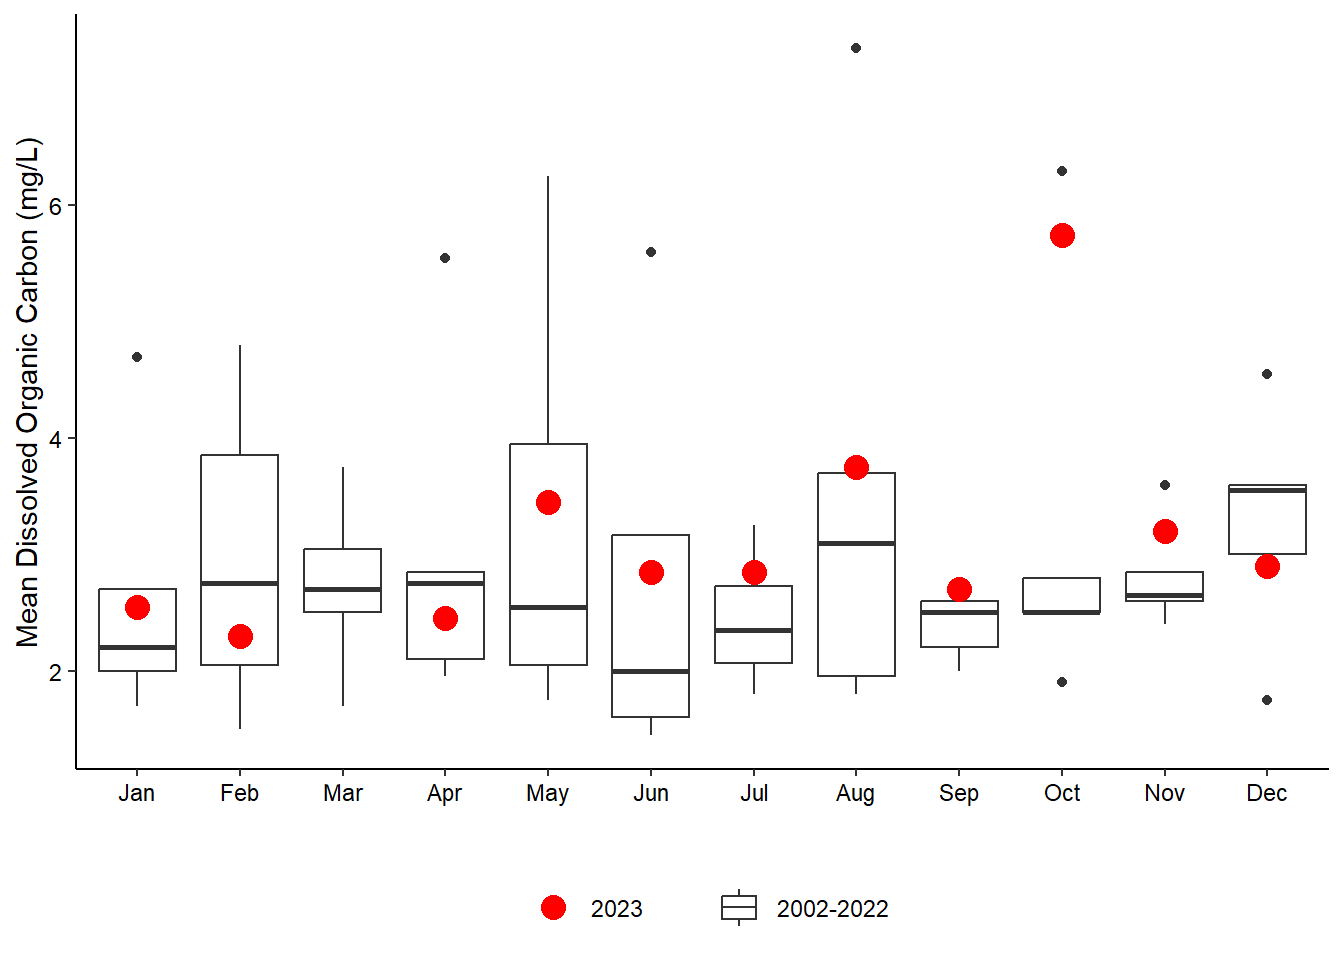
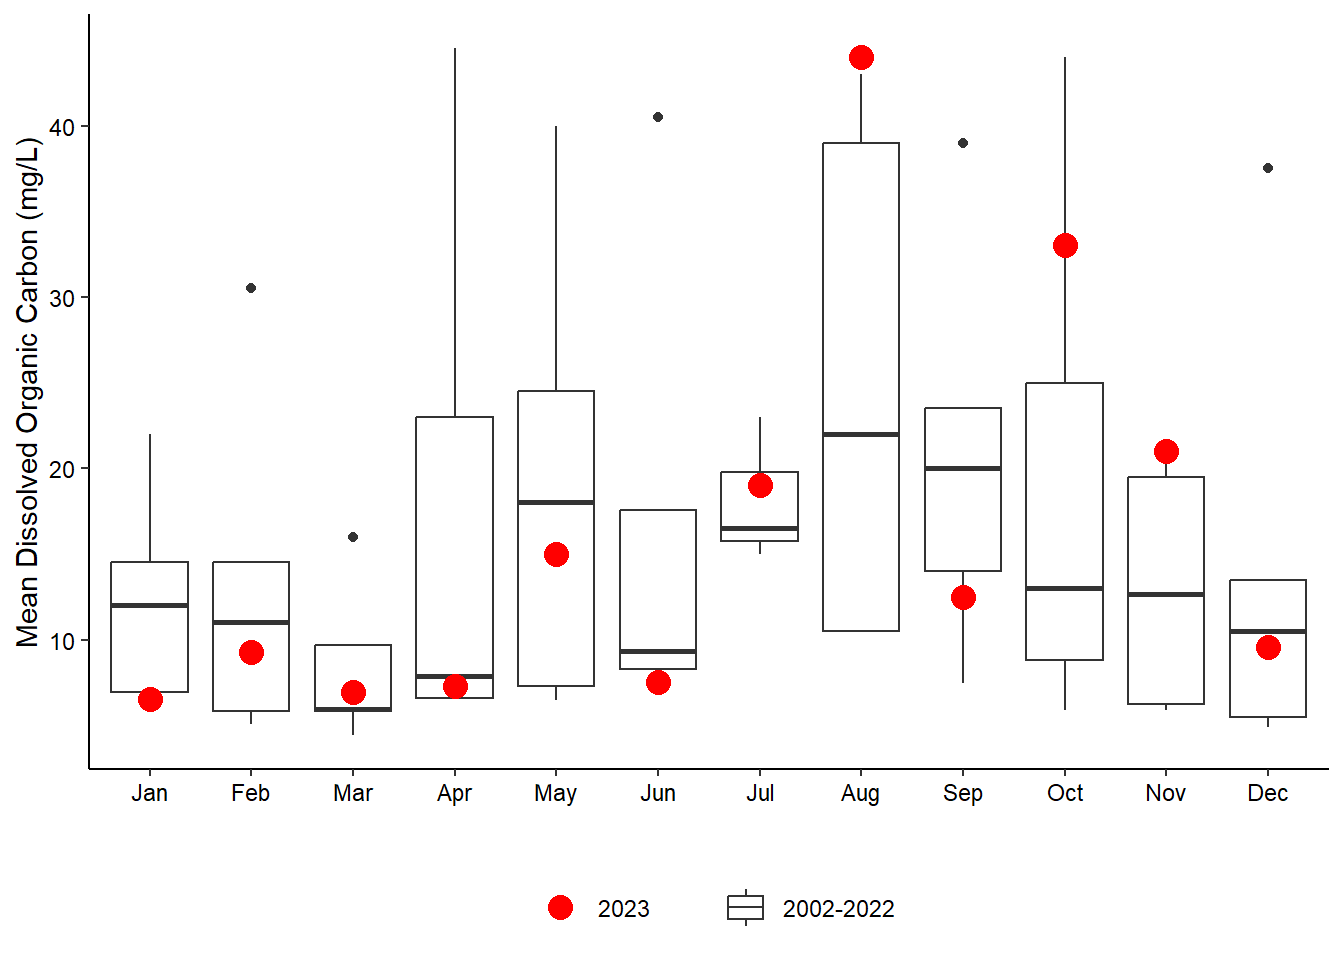
Dissolved organic carbon (DOC) at the stations was within ranges in the first half of the year (Figure 7.1); however, following the heavy summertime rains in July, many stations experienced elevated DOC in July (Figure 7.1 (b)) or August. October saw some of the highest values at many of the stations, particularly Fort Matanzas (Figure 7.1 (c)).
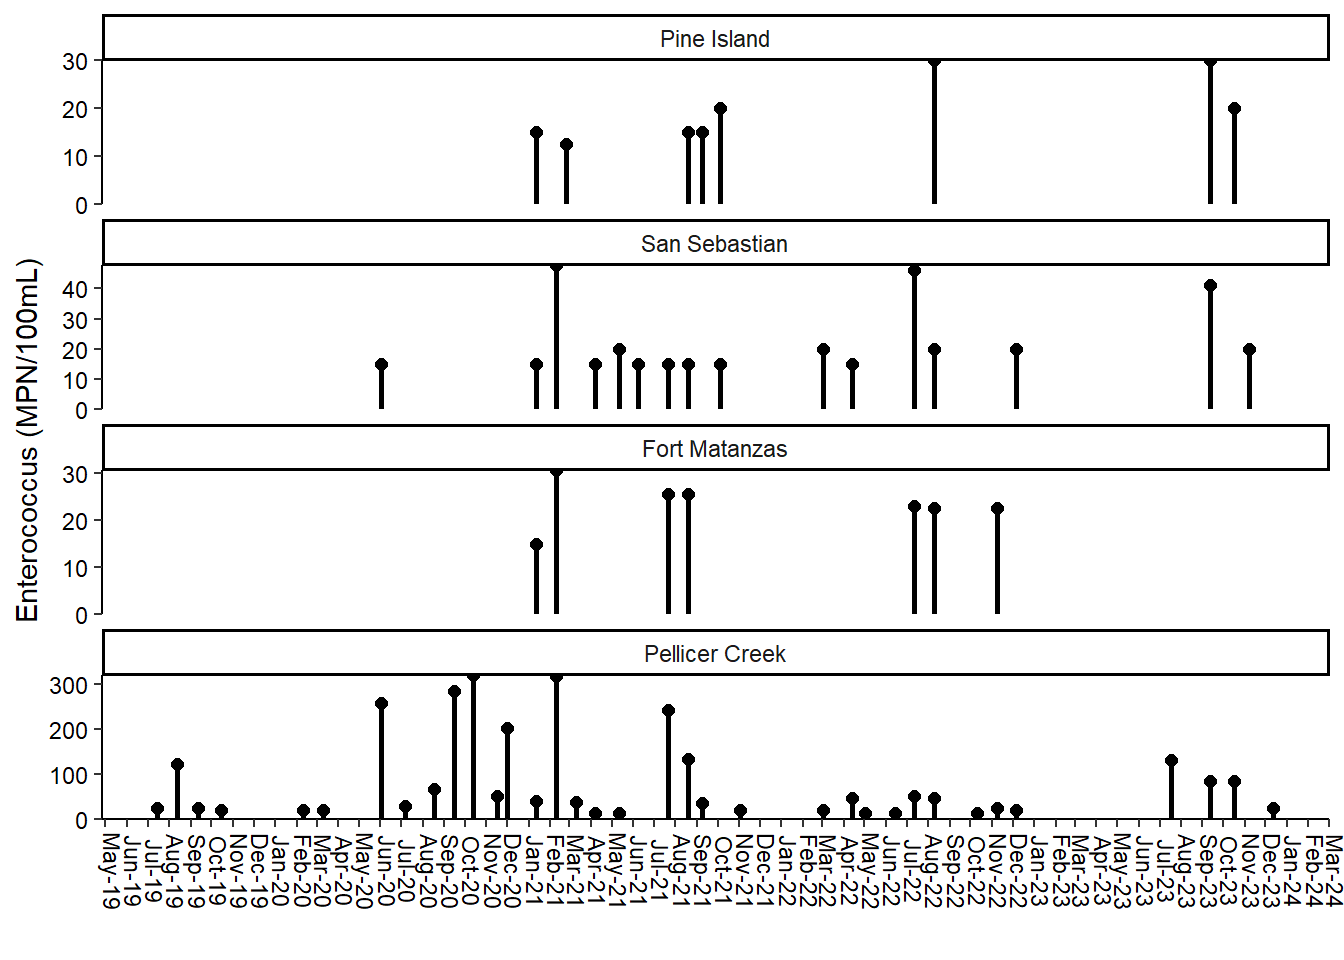
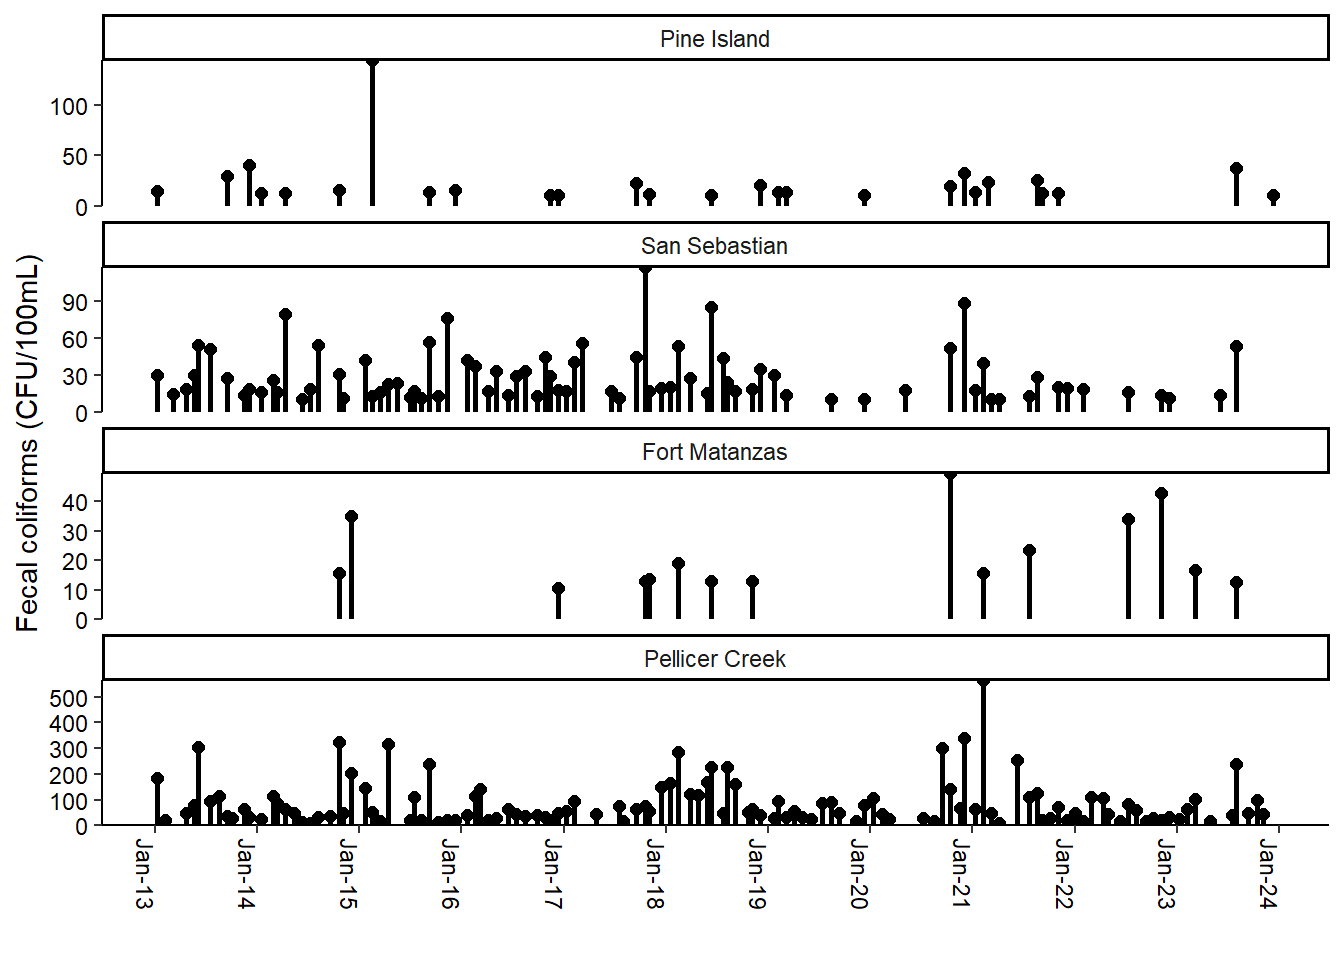
Bacteria is detected in water samples from Pellicer Creek more often and in higher quantities than the other three stations (Figure 7.2 (a); Figure 7.2 (b)). Fecal coliforms are also often detected at San Sebastian (Figure 7.2 (b)). This year, bacteria samples were frequently reported at the minimum detection limit for all stations except for the months that saw heavy rains.
7.2 Dissolved Organic Carbon

7.3 Bacteria