2 Data Collection
2.1 Weather
The meteorological data were collected using a Campbell Scientific CR1000 logger and sampled 15-min averages of 5-sec readings for air temperature, wind direction, and wind speed. The precipitation sensor measured 15-min totals. Historically, a CR10x-2M logger was used to collect meteorological data. The CR10X-2M logger sampled all weather station sensors every 5 sec and calculated both hourly and daily averages for air temperature, wind direction, and wind speed. Additionally, instantaneous samples of these parameters were recorded every 15 min. Precipitation data were summed and recorded as 15-minute, hourly, and daily totals.

A maximum four-week sampling interval (i.e., time between data downloads) was used to avoid losing data and to provide for regular inspection and maintenance of the station. At each visit to the station, sensor performance was checked by comparing weather station values to those of a handheld Kestrel 4000 wind/weather instrument. All sensors were inspected for damage or debris and repaired and cleaned accordingly after the download of data were downloaded to a Palm Pilot. Except for the rain gauge (which was calibrated in-house), all sensors were removed and sent to Campbell Scientific for re-calibration when appropriate. In addition to data obtained directly from the data logger, data were also transmitted via Campbell Scientific telemetry equipment to a NOAA GOES satellite hourly.
2.2 Water quality – continuous
The continuous water quality stations were equipped with YSI 6-Series Multiparameter (2003-2015) and YSI EXO2 (2015-present) data sondes. The sondes were anchored within a 10-cm (inside diameter) PVC housing pipe mounted vertically onto a piling. Either a steel pin at the bottom of the pipe held the sonde at a position within 1 m from the bottom, or the sonde was suspended by a chain or rope such that the sensor portion of the sonde extended beyond the end of the PVC housing 1 m from the bottom. To facilitate water flow across the sensors, several 2-cm holes were drilled into the submerged portion of the pipe. Hole density was greatest near the base where the sonde sensors were located.
Data sonde exchanges at all stations were made at approximately two-week intervals and usually took less than five minutes. The inside of each deployment tube was scraped clean with a customized tool prior to the deployment of the newly calibrated sonde. All calibration, post-deployment readings, and reconditioning of the sondes and sensors were performed in accordance with the methods outlined in the standard operating procedures for the sonde model, in addition to procedures created by the NERRS CDMO (NERRS, 2013).
Data sondes collected temperature, salinity, dissolved oxygen, pH, depth (water depth above instrument placement), and turbidity data at 30-min intervals, beginning at the Pine Island and Fort Matanzas monitoring stations in December 2000 and at the San Sebastian and Pellicer Creek monitoring stations in February 2002. In January 2007, the NERRS changed from collecting continuous data at 30-min intervals to 15-min intervals. Data used in this report contain both sampling intervals.
2.3 Water quality – discrete
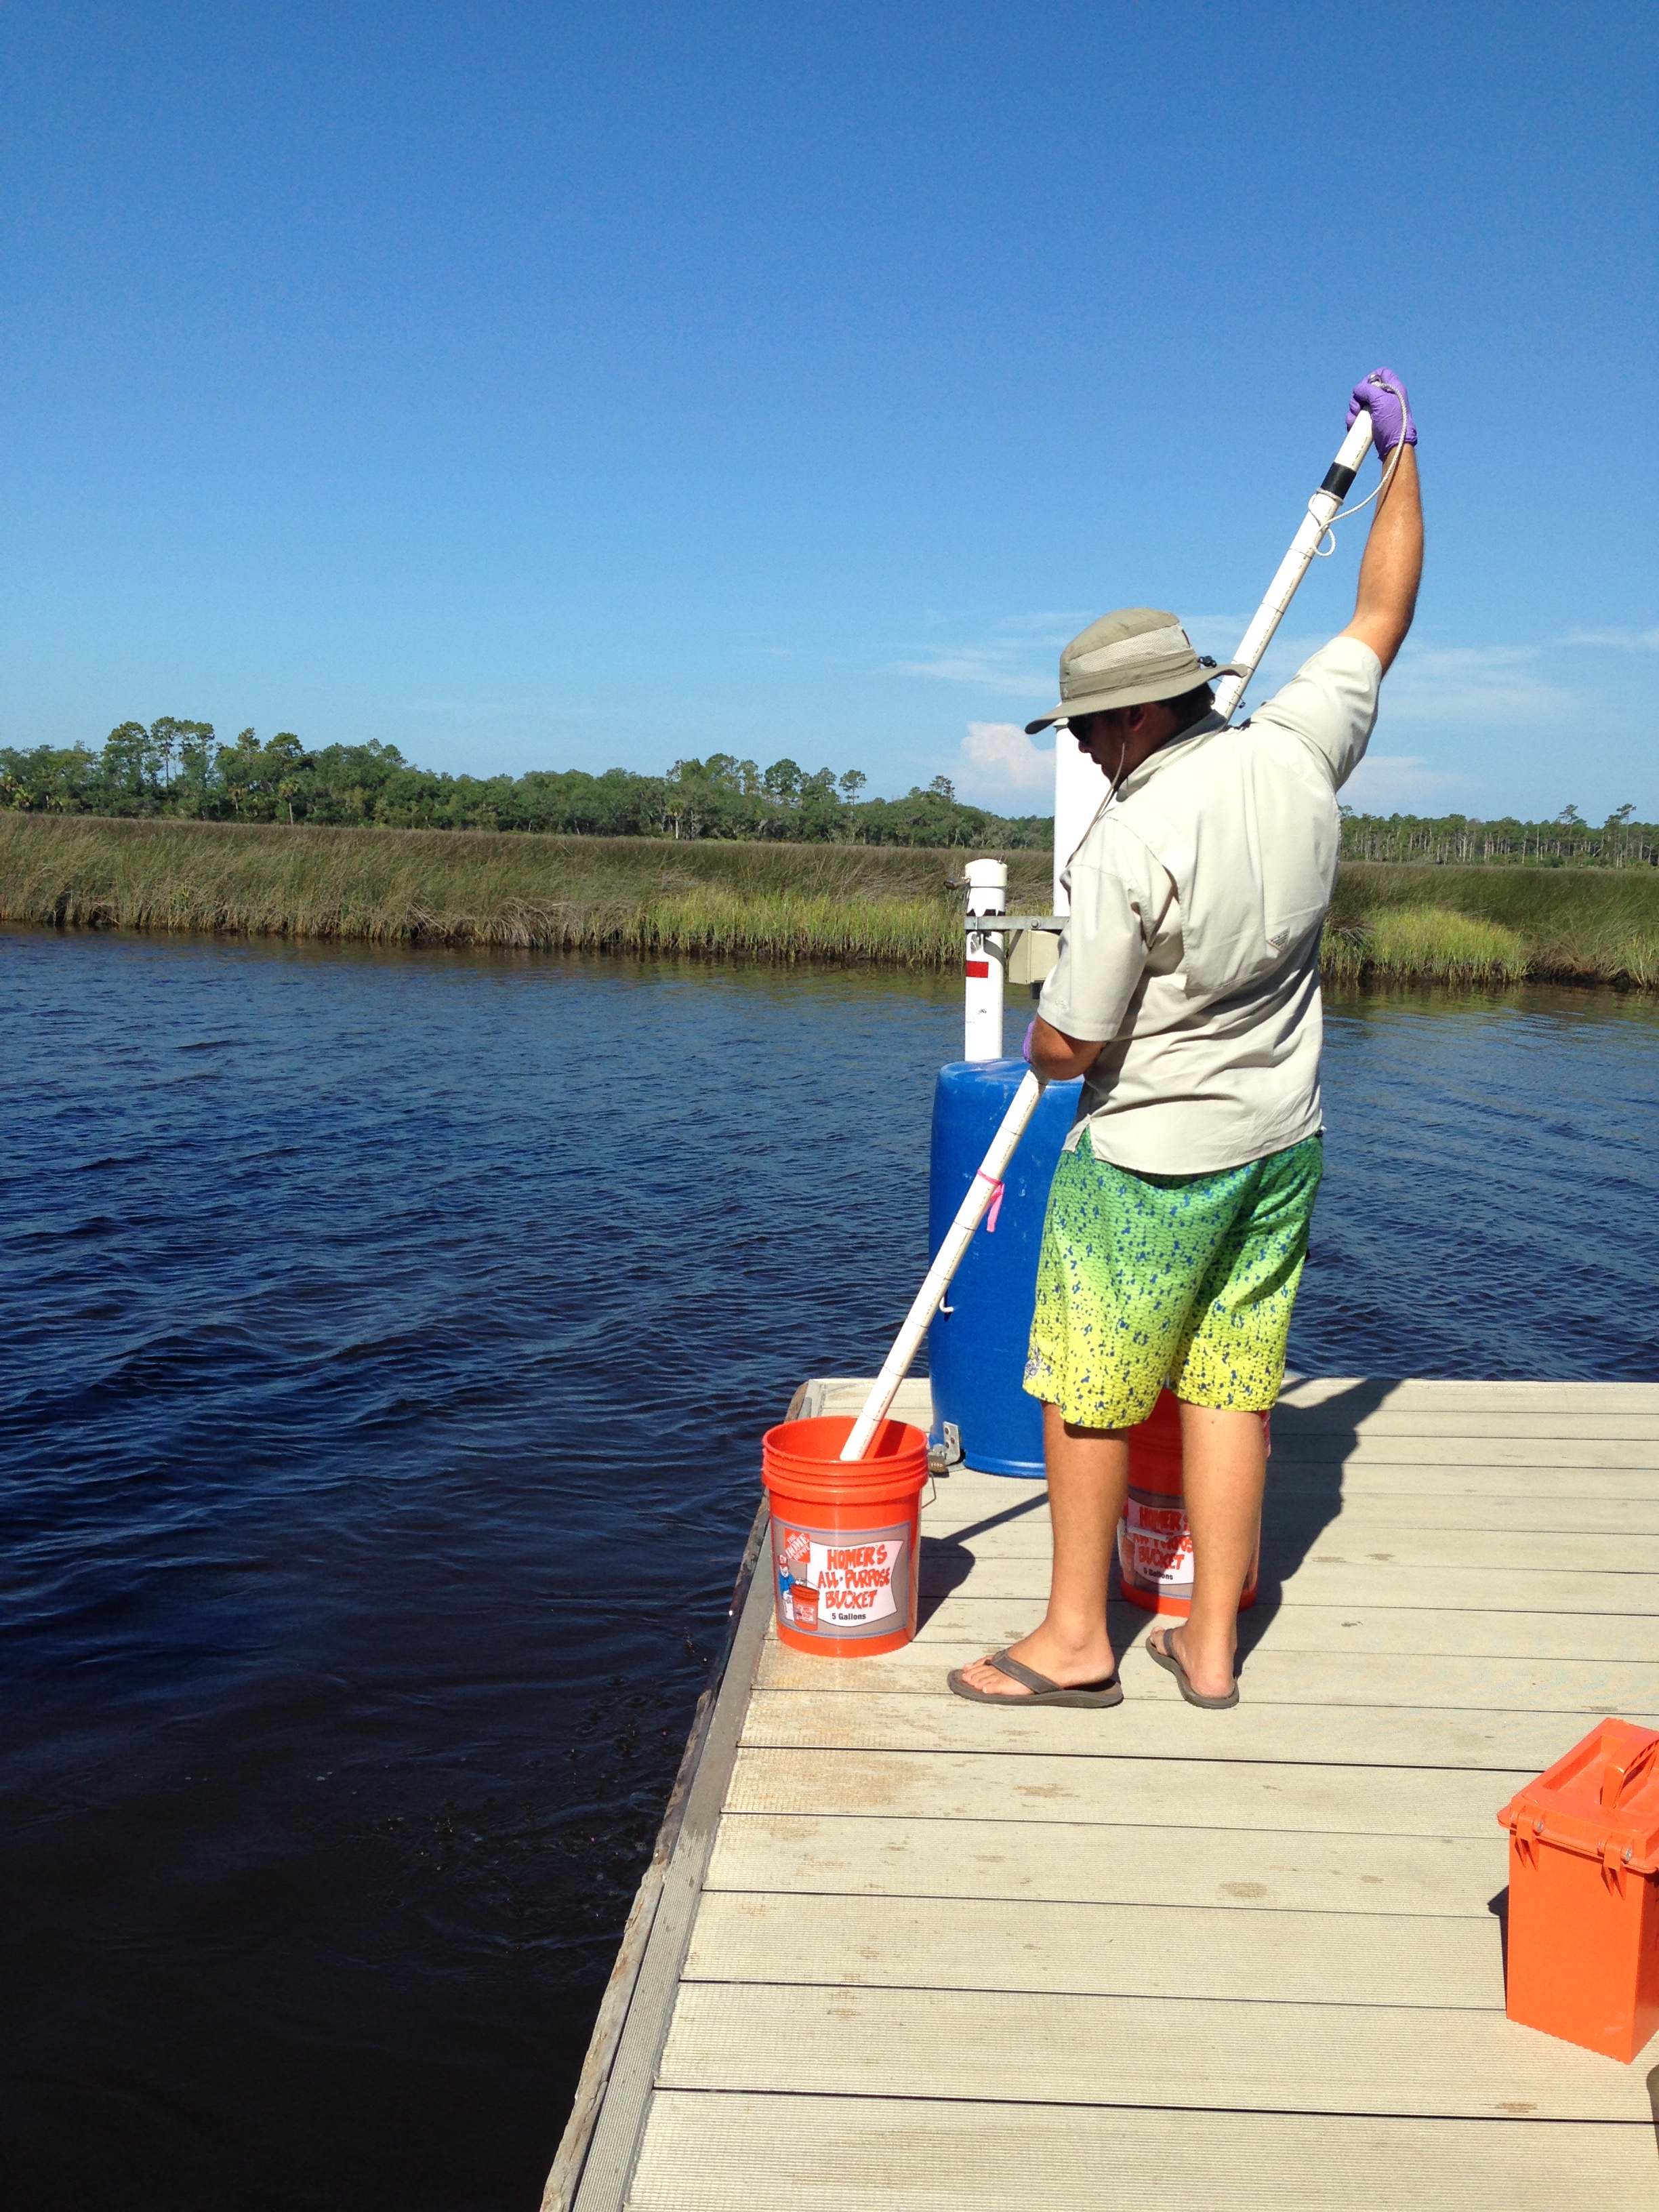
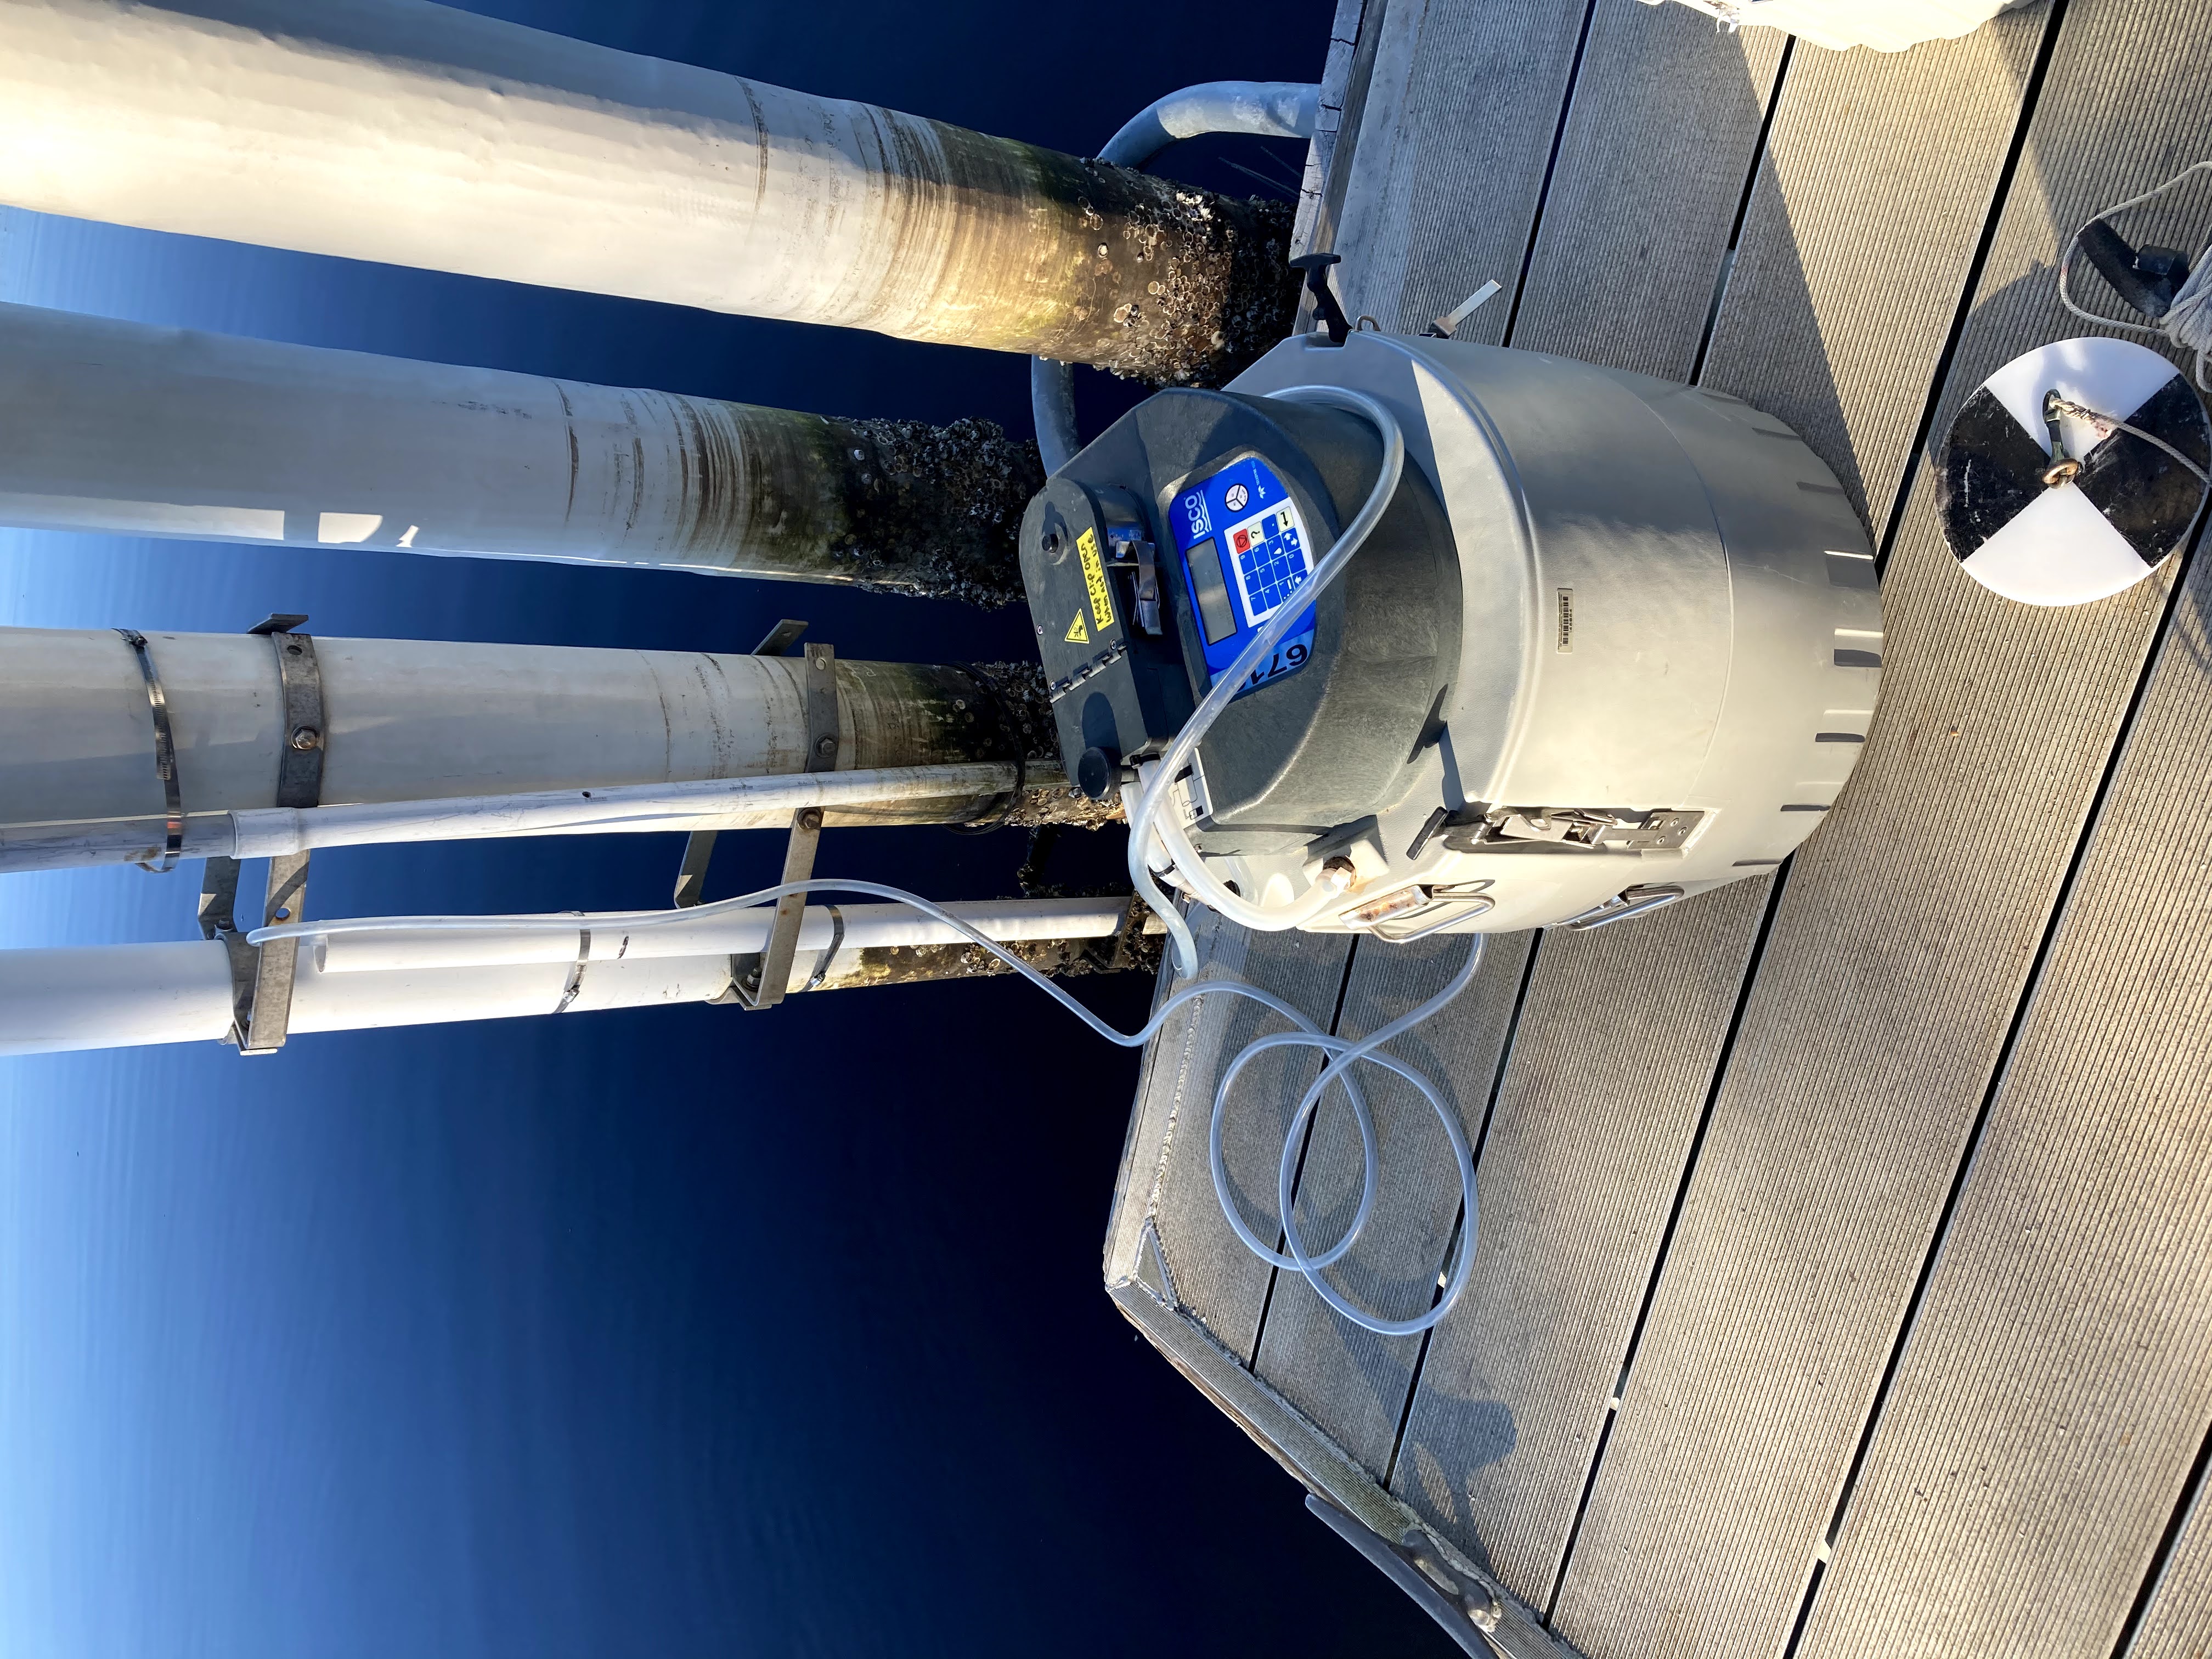
Water samples were collected monthly at each of the four water quality monitoring stations for nitrite + nitrate, ammonium, total nitrogen, orthophosphate, total phosphorus, chlorophyll a, and total suspended solids using two types of sampling methods (grab and diel), on the same day during an ebb tide. Grab samples were collected from all stations in duplicate using a pole sampler and bucket. Diel samples were only collected at the Pellicer Creek station at 2.5-hour intervals for a 25-hour (lunar day) period using a Teledyne ISCO automatic sampler equipped with an internal ice bath to keep samples cold. Both grab and diel samples were collected from the approximate depth of the sonde sensors, 1 m above the bottom. Samples were filtered in the field whenever feasible; otherwise, they were placed on ice in the dark and filtered immediately upon returning to the laboratory.
Water samples collected between January 1, 2003 and June 30, 2010 were collected and analyzed by University of Florida’s (UF) Department of Fisheries and Aquatic Sciences. Samples collected between July 1, 2010 and November 30, 2012 were collected by GTMNERR and analyzed by the UF lab. Samples collected on or after December 1, 2012 were collected by GTMNERR and analyzed by the Florida Department of Environmental Protection’s (FDEP) Central Laboratory. Both laboratories were certified through the National Environmental Laboratory Accreditation Program and used the American Public Health Association and Environmental Protection Agency methods for analyses. Method details can be found in annual metadata files which are downloadable from (https://cdmo.baruch.sc.edu).