4 Environmental
The following includes variables that establish the estuarine setting: rainfall, light intensity, water temperature, and salinity. These variables are driven primarily by climatic patterns and largely influence water quality condition.
4.1 Summary
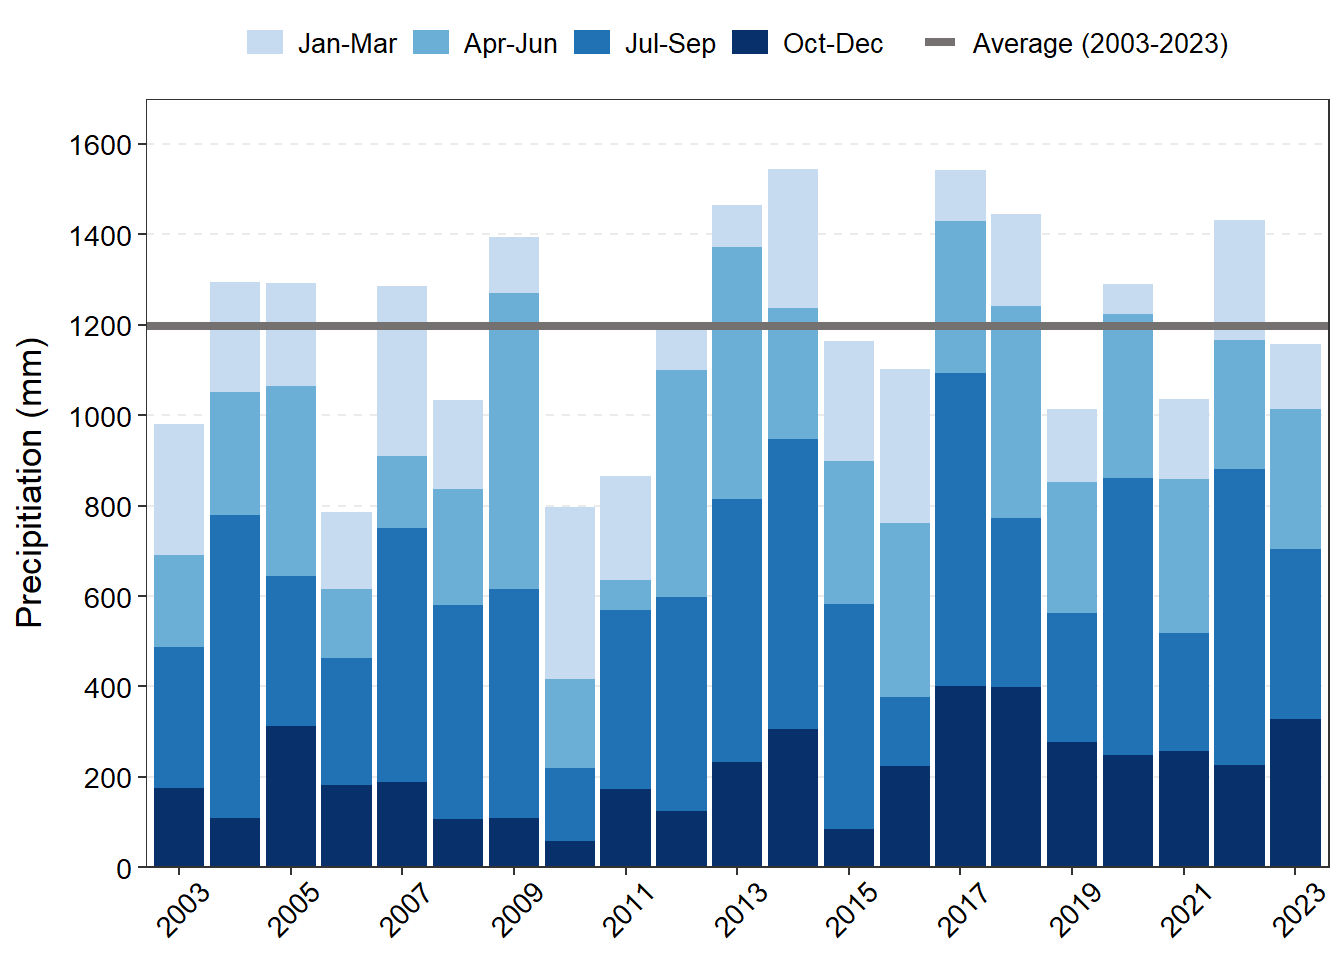
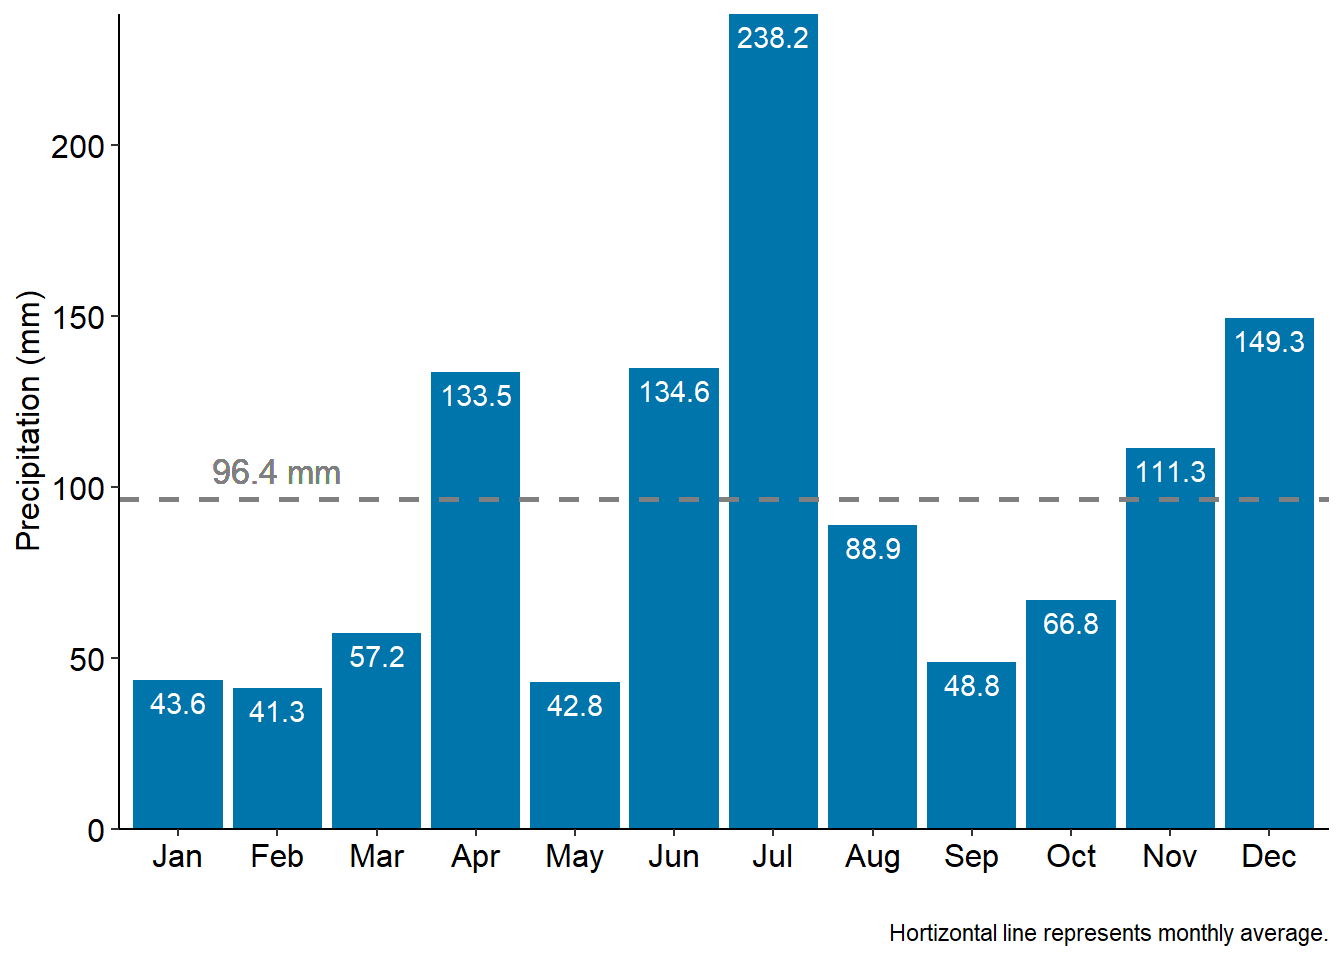
In July, northeast Florida received consistent and large amounts of precipitation (Figure 4.1). Almost 61% of days in July had detectable levels of rainfall (Figure 4.1 (b)) and it also had the most amount of heavy rain (7.6 - 50 mm/hr) (Figure 4.1 (c)). After the summer rains, however, early fall (September - October) was pretty minimal with very few rain days (rain greater than 1 mm) (Figure 4.1 (b)). However, even though there were not many rainy days in October at the weather station, all the rainfall for the month was collected on one day: October 12, 2023 (Figure 4.1 (a)). Nor’easters brought heavy rainfall in March, April, June, and December (Figure 4.1 (a); Figure 4.1 (b)). These events are discussed in further detail in Section 6.2.
In 2023, the average daily amount of light intensity for each month is shown in Figure 4.2. There was less intense light in the extreme months of the year (Jan, Feb, Nov, Dec) and more in the mid-months of the year. The most intense light was observed between April - August.
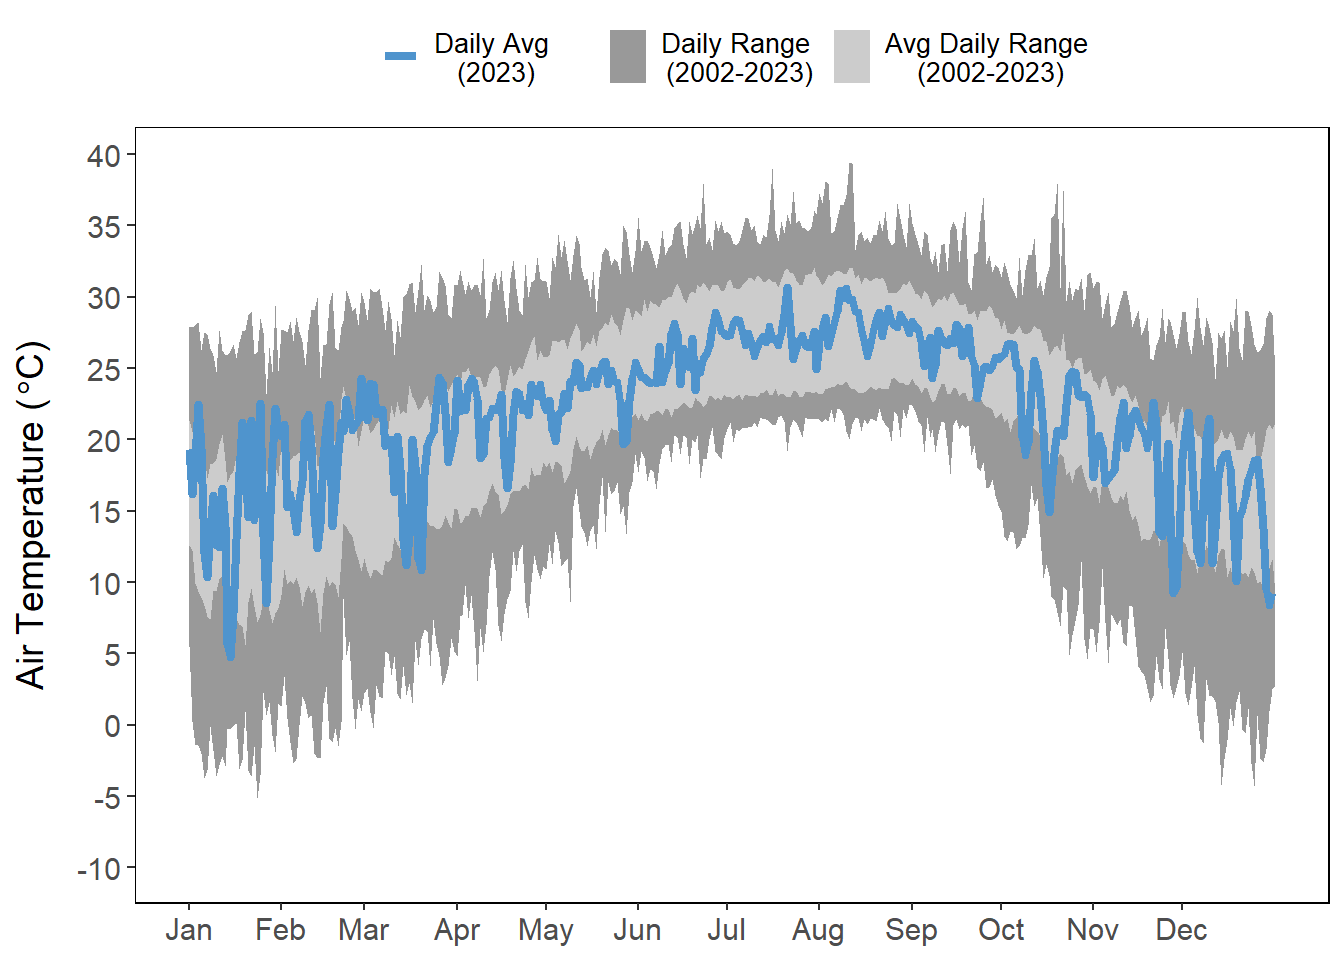
Daily average air temperatures were high and variable during the first part of the year, particularly in February, but fell within the historical range for the GTMNERR station through October (Figure 4.3). October also experienced a few temperature drops outside of the average range (Figure 4.3). More discussions on temperature anomalies can be found in Section 6.4.
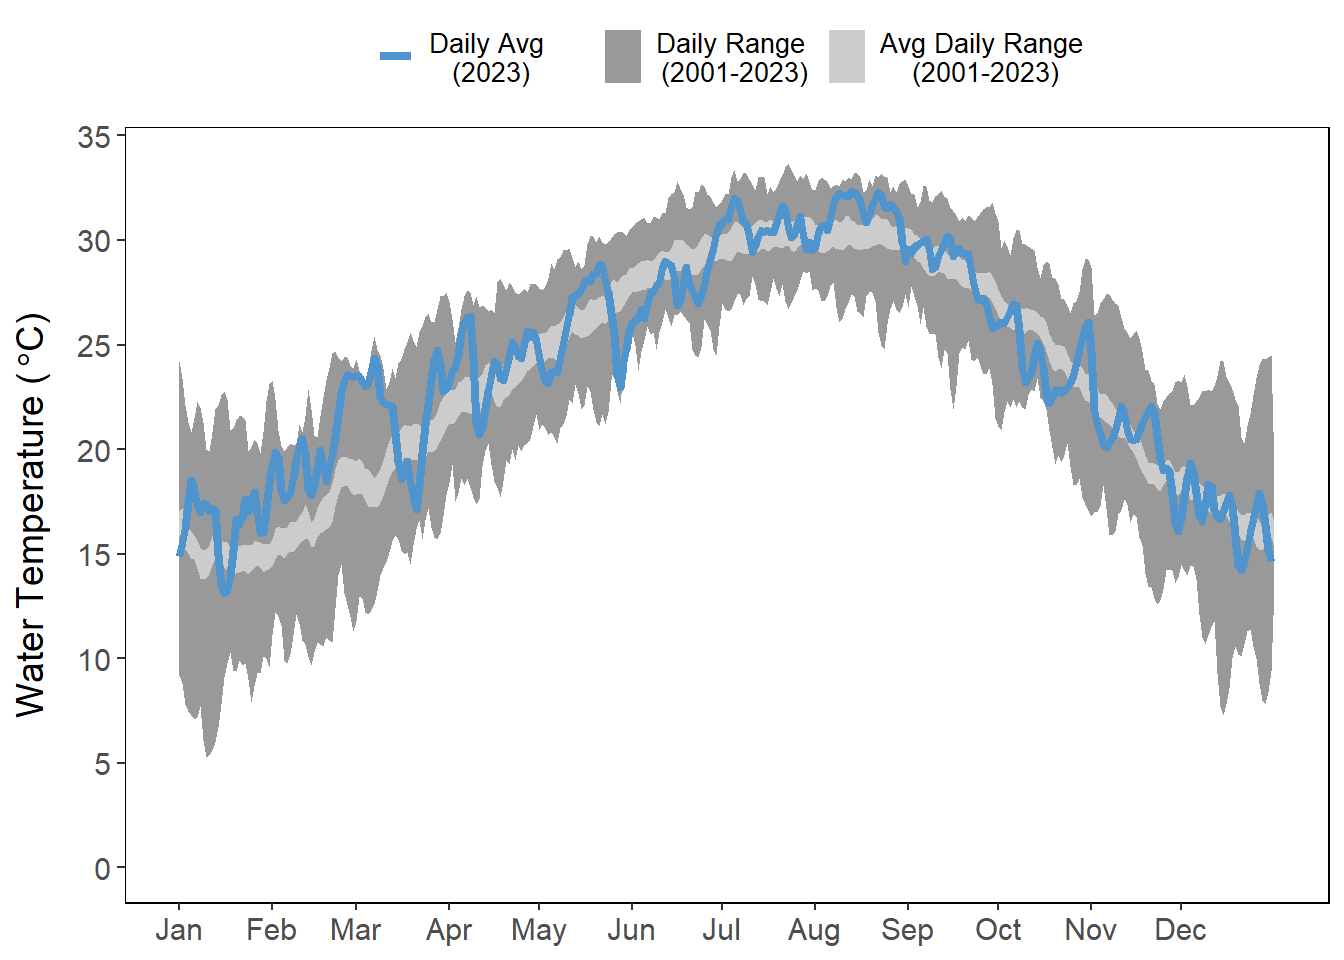
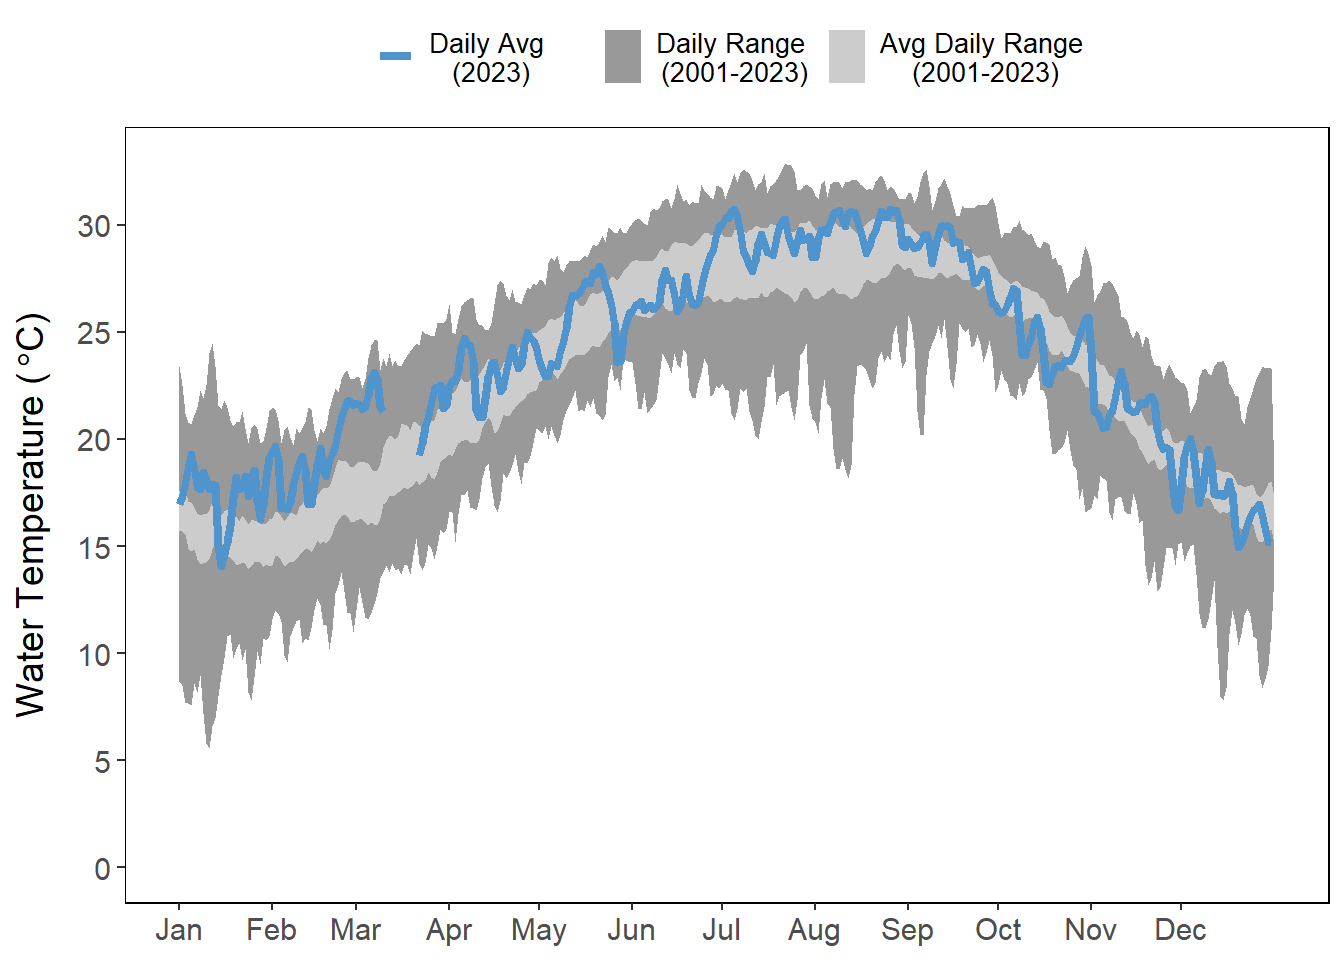
Water temperatures have generally been on the higher end of the range throughout the year (Figure 4.4). Temperatures have been most variable and lower at stations most influenced by freshwater runoff (Pine Island and Pellicer Creek). Daily averages fell within historical ranges at the stations within June, but all stations experienced higher temperatures in July and August (Figure 4.4). The cooler weather in October also is evident in the water temperatures as clear drops in daily averages were observed at all four stations, though more pronounced at Pellicer Creek, the shallowest of the four stations (Figure 4.4 (d)).
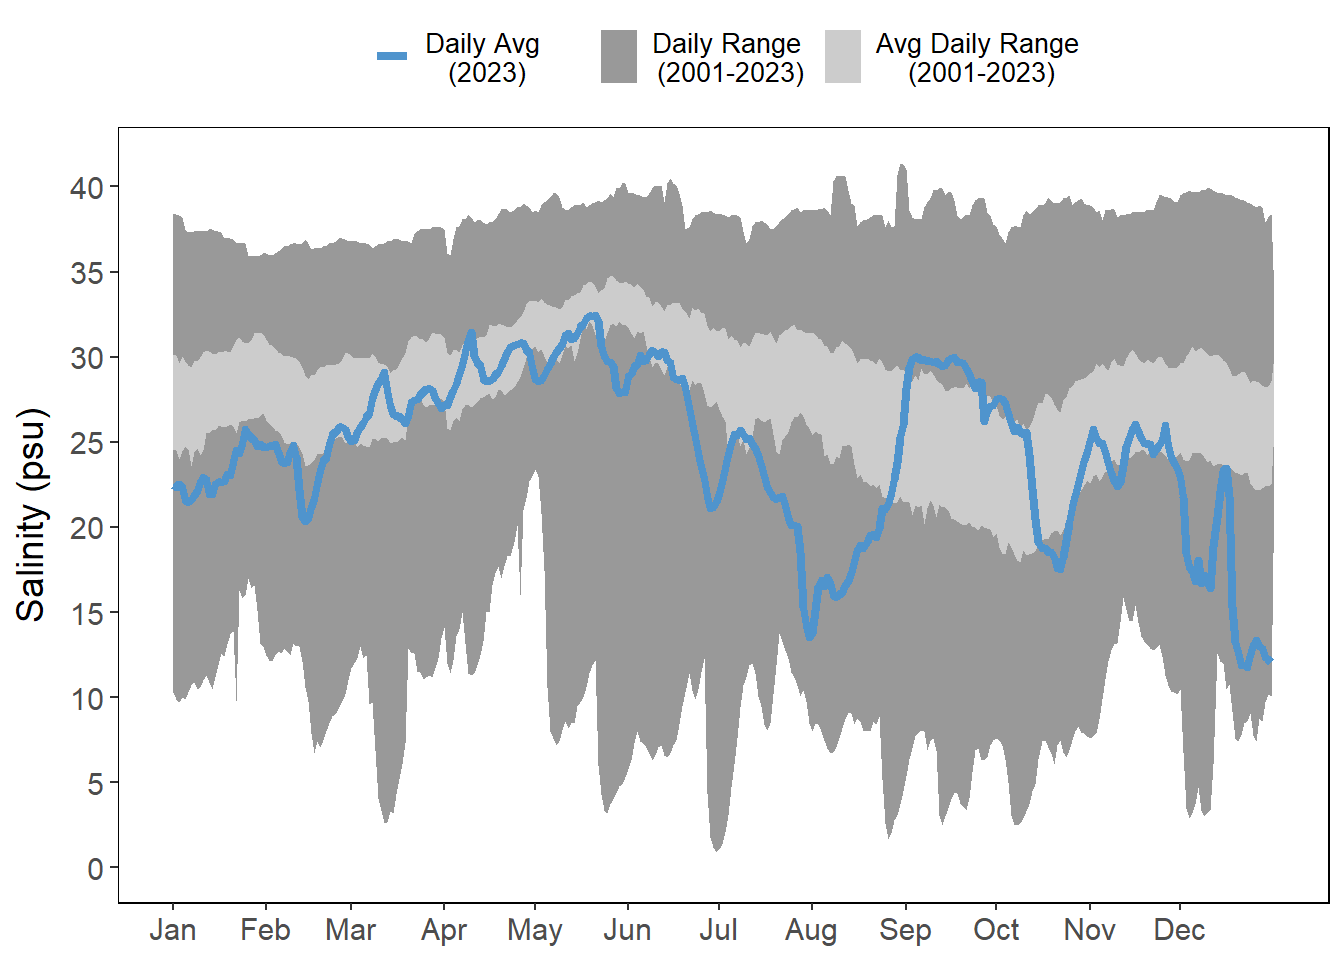
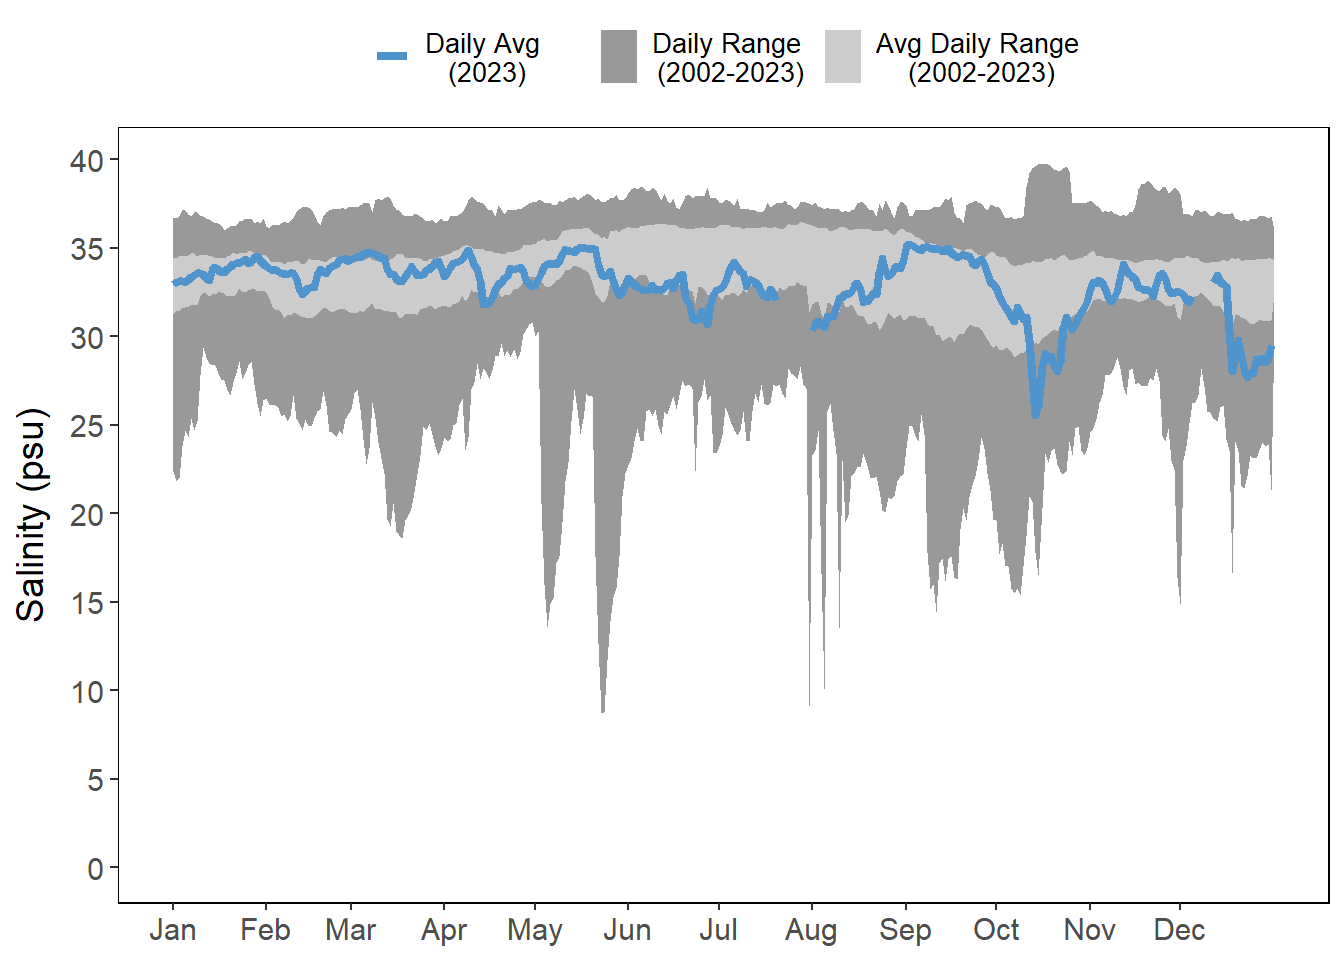
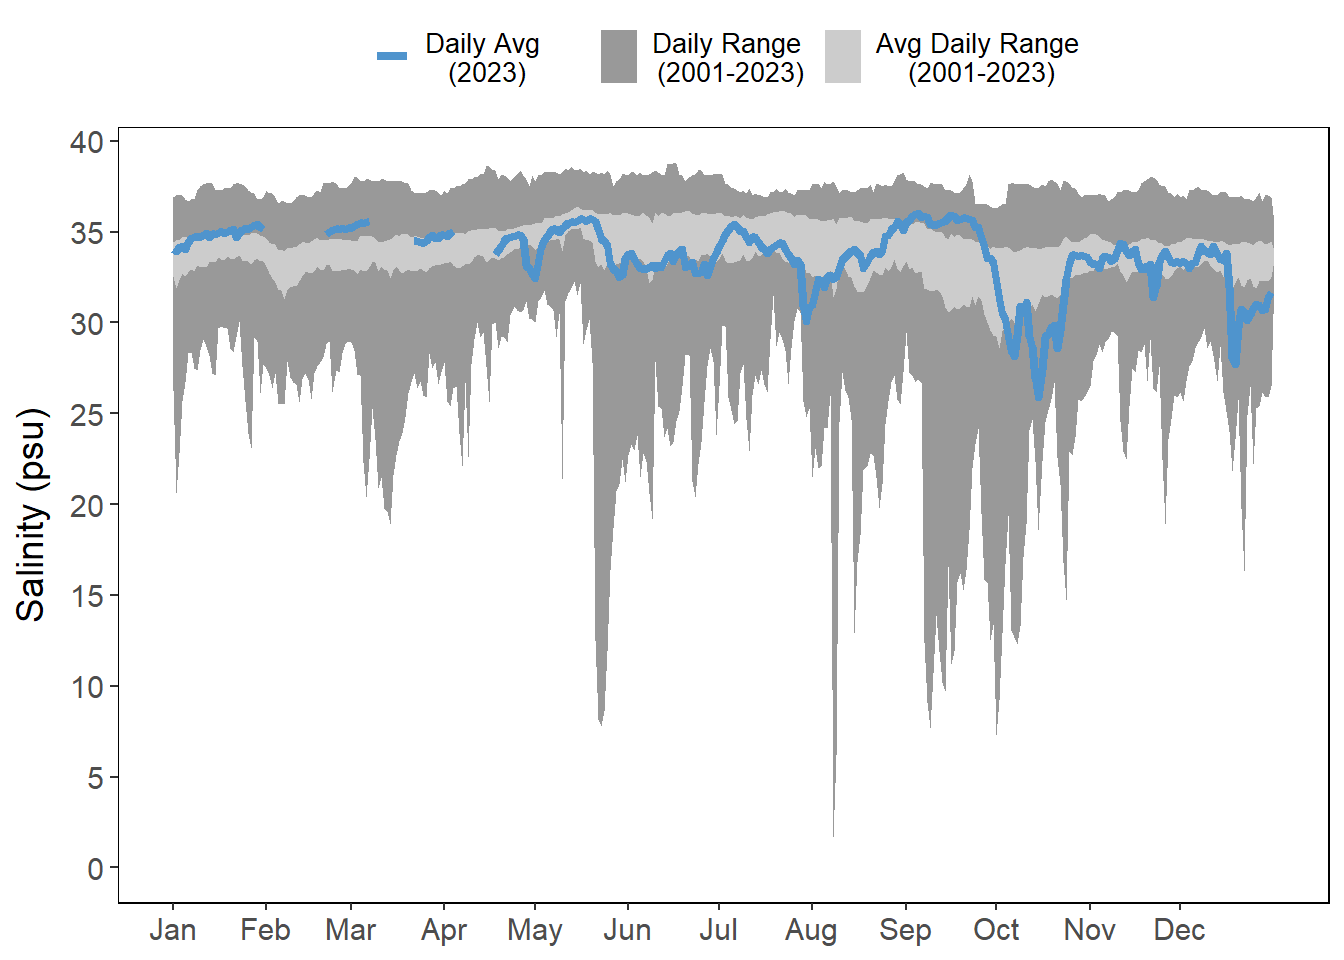
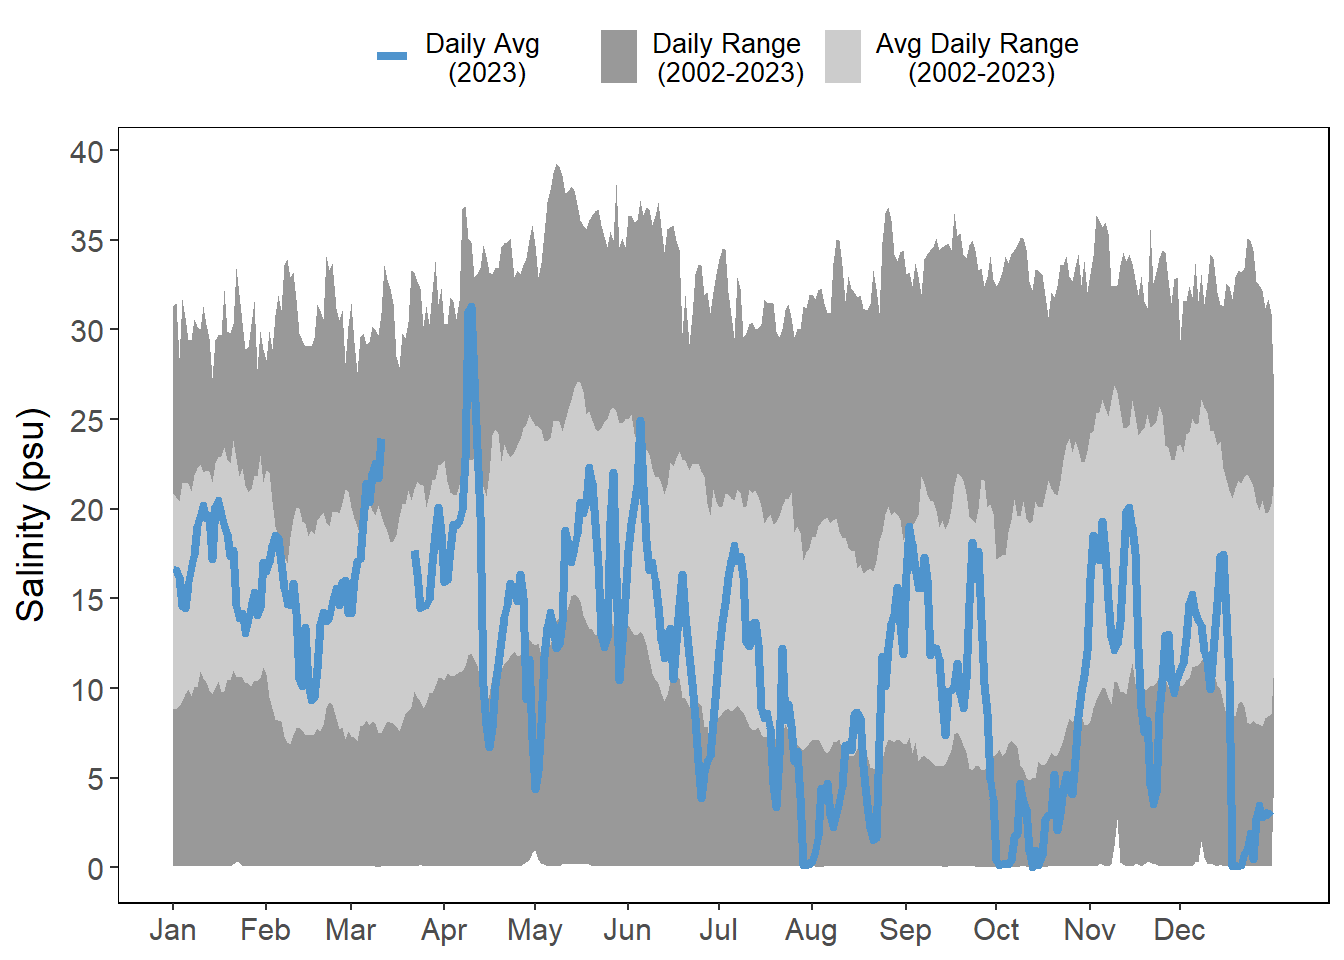
The heavy summer rains brought salinities at all stations much lower than their average daily ranges (Figure 4.5), particularly at the stations farthest from the inlets (Figure 4.5 (a); Figure 4.5 (d)). Nor’easters and fall “King Tides” did help to raise salinities often at most sites, particularly April in Pellicer Creek (Figure 4.5 (d)) and September-October at all sites.
4.2 Data
4.2.1 Rainfall
Data is presented as quarterly totals, then monthly, and then daily totals as “rain days” which are categorized into Wet (<10 mm), Very Wet (20-29 mm), and Extremely Wet (>30 mm) days.


4.2.2 Light Intensity
The plot below is interactive. Clicking on elements in the legend (months) will select or deselect months of interest. Additionally, the axis can be adjusted by selecting portions of the plot to isolate.
4.2.3 Temperature
Air and water temperatures are presented as daily averages (blue line) with historic ranges (daily range and average daily range) provided in shades of gray.


4.2.4 Salinity