| Start Time | End Time | Duration (hrs) |
|---|---|---|
| 2023-03-08 05:30:00 | 2023-03-09 11:30:00 | 30.25 |
| 2023-03-20 11:30:00 | 2023-03-21 15:45:00 | 28.50 |
| 2023-03-29 07:30:00 | 2023-03-30 19:45:00 | 36.50 |
| 2023-04-09 07:45:00 | 2023-04-11 03:15:00 | 43.75 |
| 2023-04-23 01:45:00 | 2023-04-24 17:15:00 | 39.75 |
| 2023-05-23 21:45:00 | 2023-05-26 16:00:00 | 66.50 |
| 2023-05-31 07:15:00 | 2023-06-04 01:45:00 | 90.75 |
| 2023-06-04 06:45:00 | 2023-06-06 00:15:00 | 41.75 |
| 2023-08-23 09:15:00 | 2023-08-25 01:15:00 | 40.25 |
| 2023-09-02 10:00:00 | 2023-09-03 23:45:00 | 38.00 |
| 2023-09-18 10:15:00 | 2023-09-19 18:30:00 | 32.50 |
| 2023-09-28 10:30:00 | 2023-09-30 08:15:00 | 46.00 |
| 2023-09-30 10:45:00 | 2023-10-02 06:45:00 | 44.25 |
| 2023-10-02 07:15:00 | 2023-10-04 03:30:00 | 44.50 |
| 2023-10-04 06:30:00 | 2023-10-06 02:45:00 | 44.50 |
| 2023-11-01 11:00:00 | 2023-11-03 03:00:00 | 40.25 |
| 2023-12-13 18:15:00 | 2023-12-15 08:30:00 | 38.50 |
| 2023-12-19 14:00:00 | 2023-12-20 15:30:00 | 25.75 |
6 Environmental Drivers
This section includes drivers of environmental patterns such as significant weather events (e.g., tropical cyclones, Nor’easters, large rainfall events), anomalies, and other local events with impact.
6.1 Tropical Cyclones
There were no tropical cyclones that had direct impacts in the GTM estuary during this reporting year.
6.2 Nor’easters
Typically, a Nor’easter is a storm along the East Coast of the United States with predominating winds from the northeast. These storms can last anywhere from a single day (24 hours) to several days or weeks. Callahan, Leathers, and Callahan (2022) found that these events can produce surges just as severe as tropical cyclone events, and occur much more frequently. These events are often in the news associated with blizzards in the New England area of the US; however, their impacts to northeast Florida are not insignificant. Often these storms bring higher water levels, heavy prevailing winds, precipitation, and reduced tidal exchange.
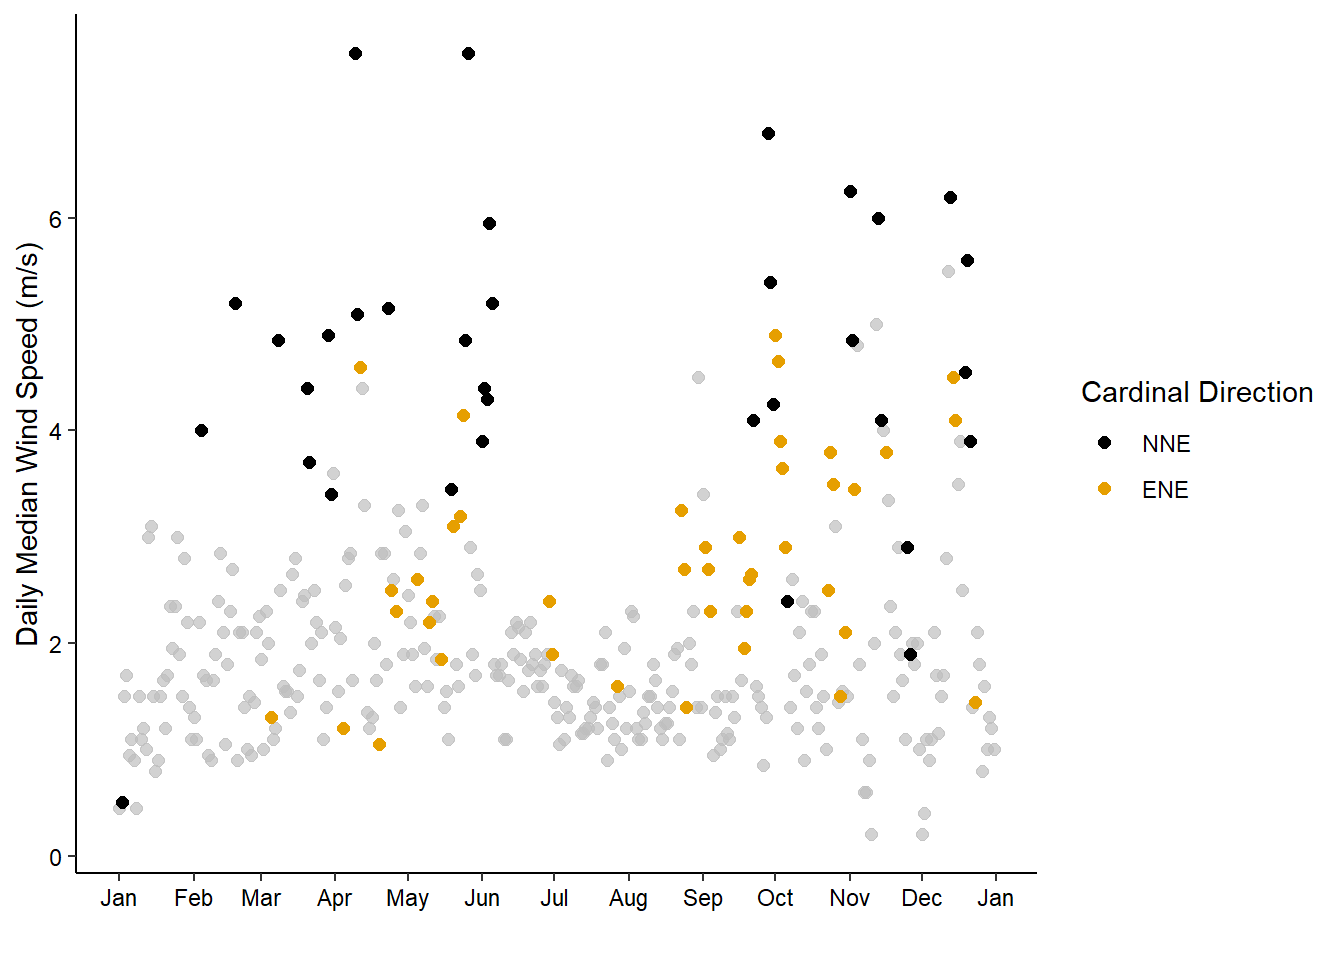
Using duration of wind directions between 0-100 degrees for greater than 24-hrs, several “Nor’easter” events were identified using data from the Pellicer Creek weather station (Table 6.1). Occasionally, localized wind directions result in values outside of this 0-100 degree window, which in turn affects the duration calculations, but it appears that there were at least 11-14 possible Nor’easter events identified in this way for 2023. The longest event occurred in the second half of the year from September 28th - October 6th, approximately nine days. This table does not identify strength of the winds during these events, just the time frames in which winds were originating and prevailing in the 0-100 degree directions. When examining daily median wind speeds over the year, the highest values are most often associated with winds in the north-northeast (NNE) and east-northeast (ENE) directions (Figure 6.1).
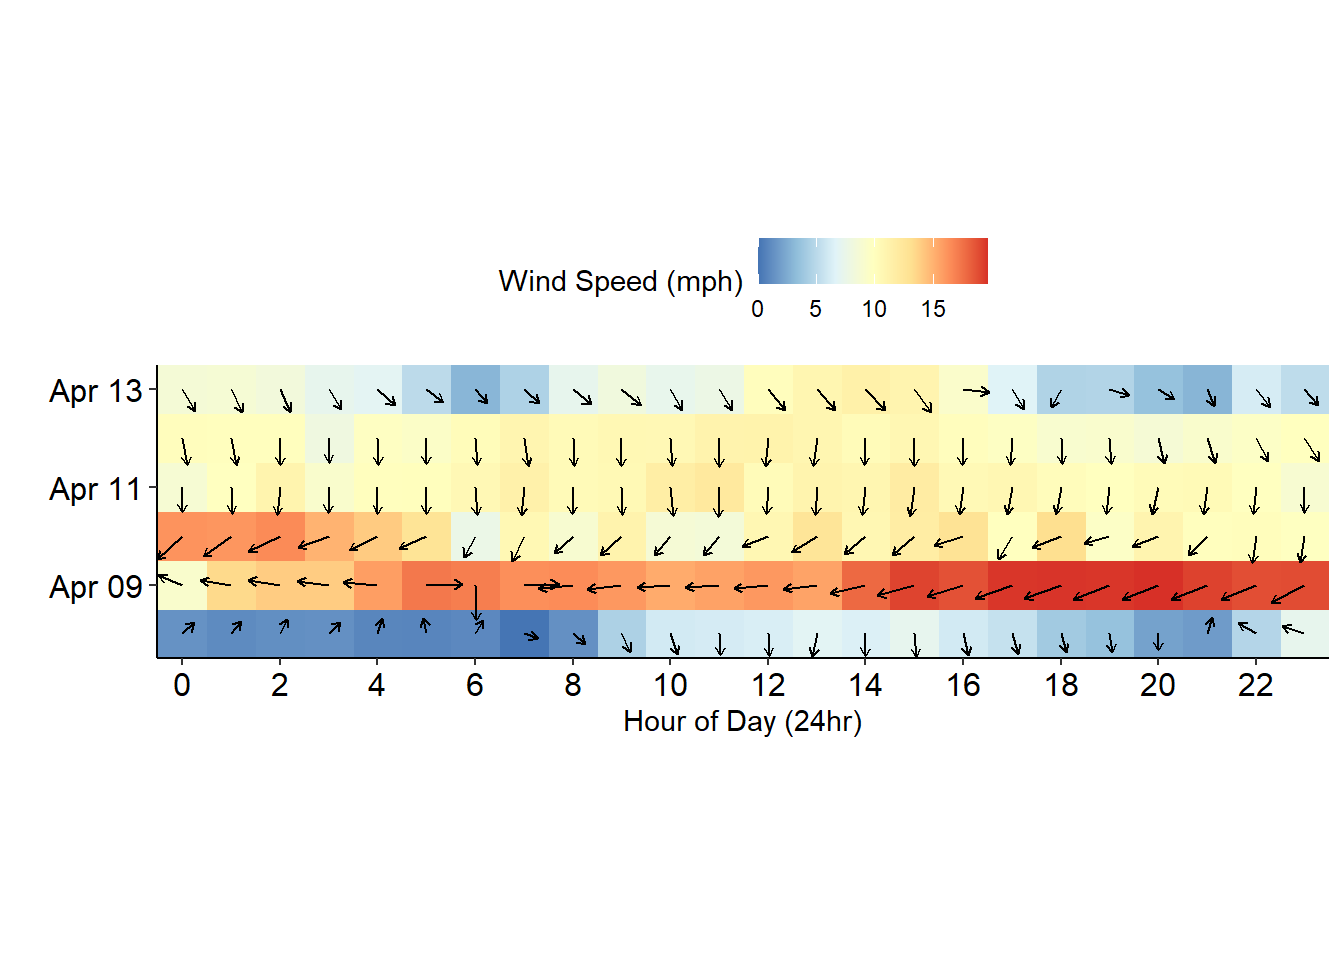
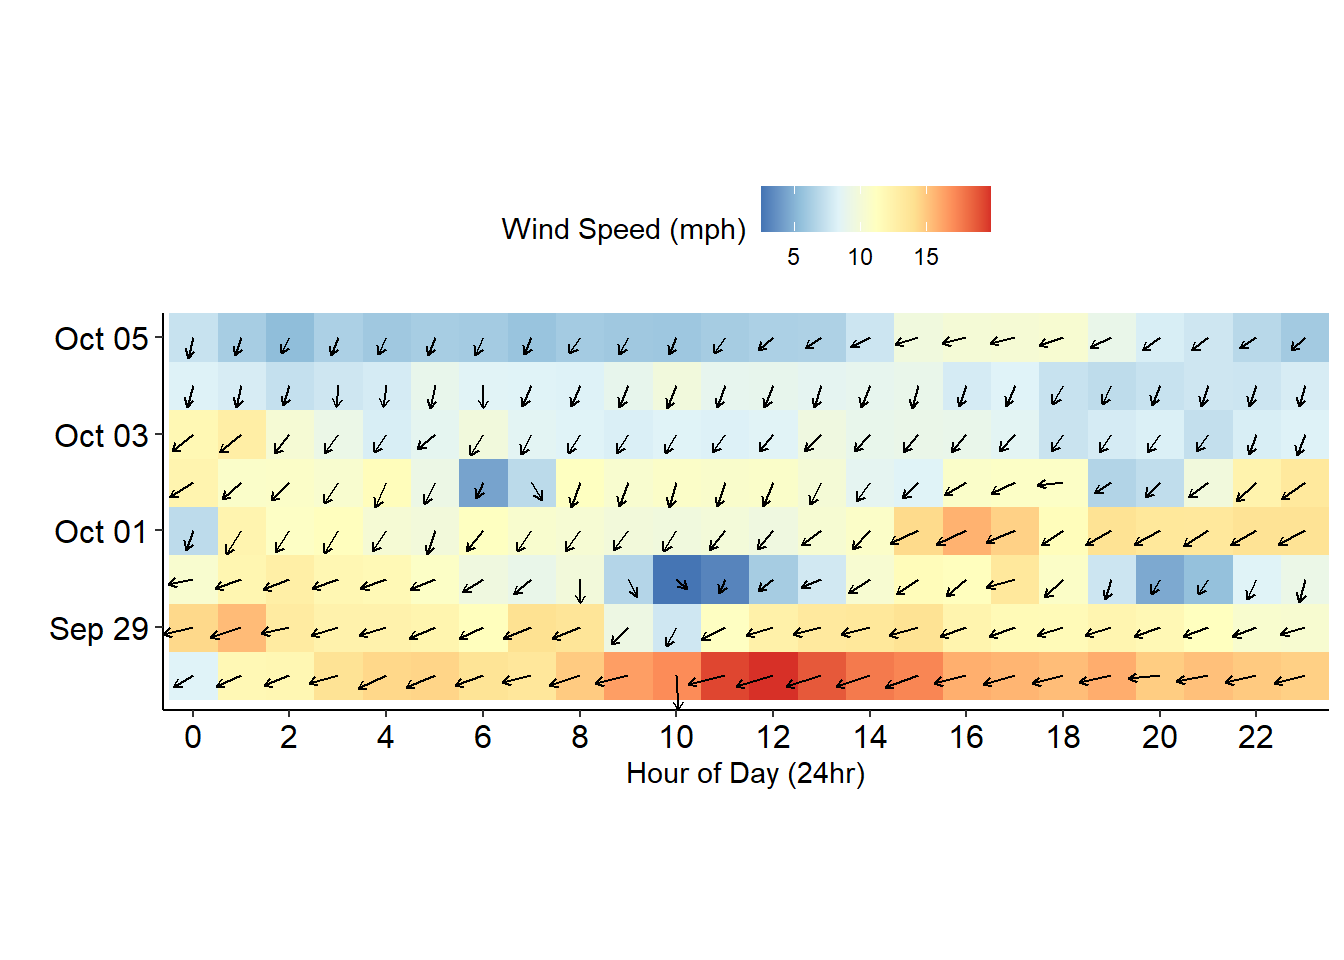
The April Nor’easter had strong winds from the N and NE directions for four days (Figure 6.2). Strong winds from all of the Nor’easters initially raised salinity at all stations (Figure 4.5), and the effect was especially pronounced at Pellicer Creek (Figure 4.5 (d)). After the winds died down, the effects of the heavy rainfall were evident in the drops in salinity following the storm events. Compared to the Nor’easter in April, the longest one that occurred between September 27 - October 6, 2023 did not have as high of winds for quite as long, but they were from the NNE and ENE directions for a much longer period of time (Figure 6.3).

Many of these events correspond to months with rainfall totals exceeding the annual monthly average (Figure 4.1 (b)), particularly months within the “drier” times of the year, such as April, November, and December. The heaviest rain (7.6-50 mm/hr) for April, June, and December were all associated with Nor’easter events (Figure 4.1 (c)).

6.3 King Tides
“King Tides” are the highest predicted tides of the year and in northeast Florida, these typically occur during the fall months. For the city of St. Augustine, these events often bring nuisance flooding in coastal and low-lying areas. For the estuary, this typically also means reduced tidal exchange, a lack of low tide events, and more and prolonged flooding in the intertidal wetlands. The city reports these events on their website.
Predicted king tide events for 2023 were:
September 26-30th
October 1st-3rd
October 27th-31st
November 25-28th
December 13-15th
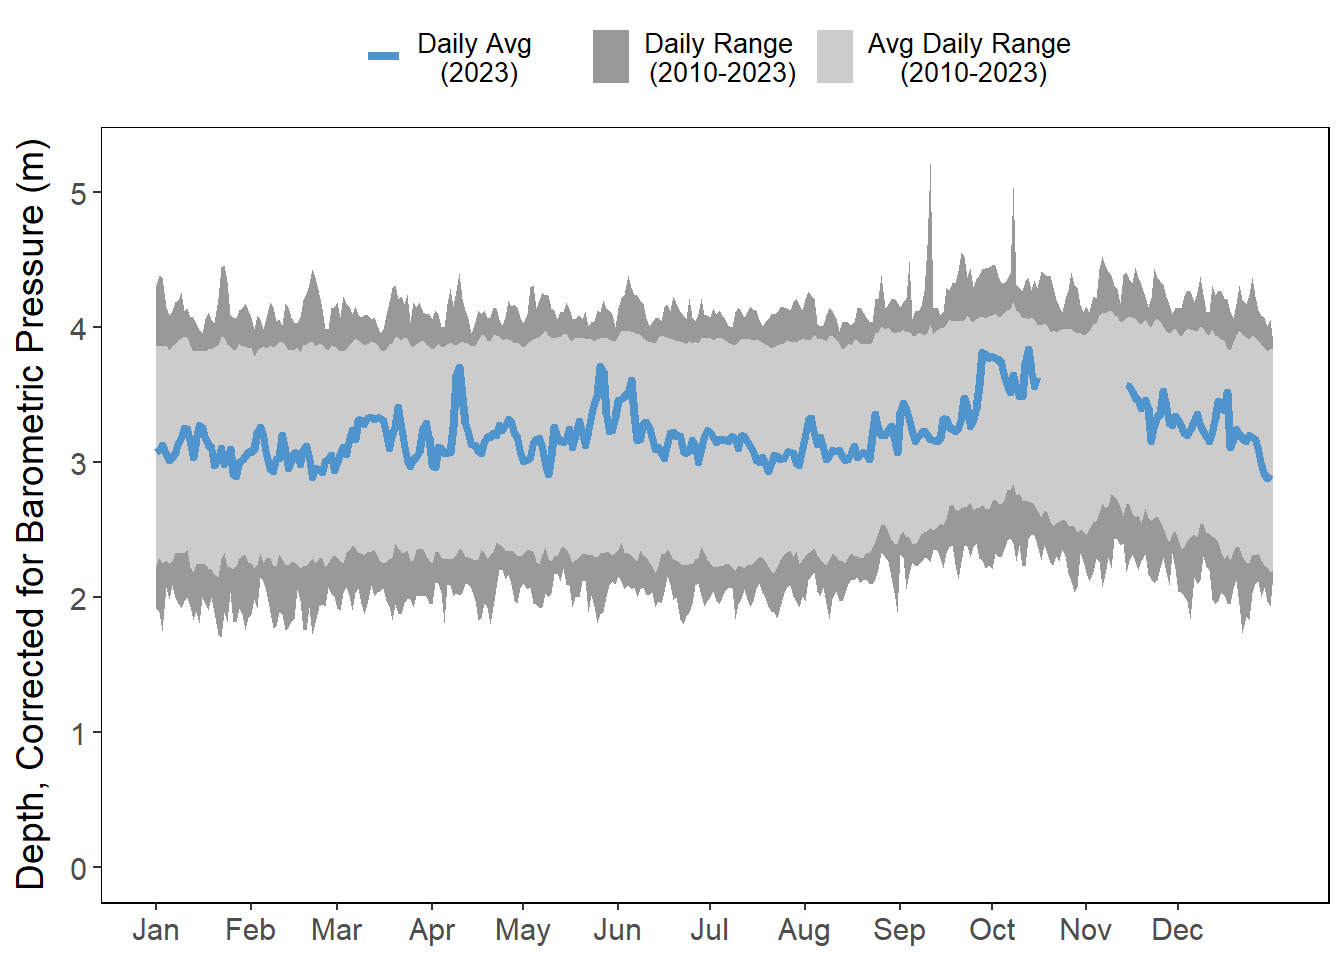
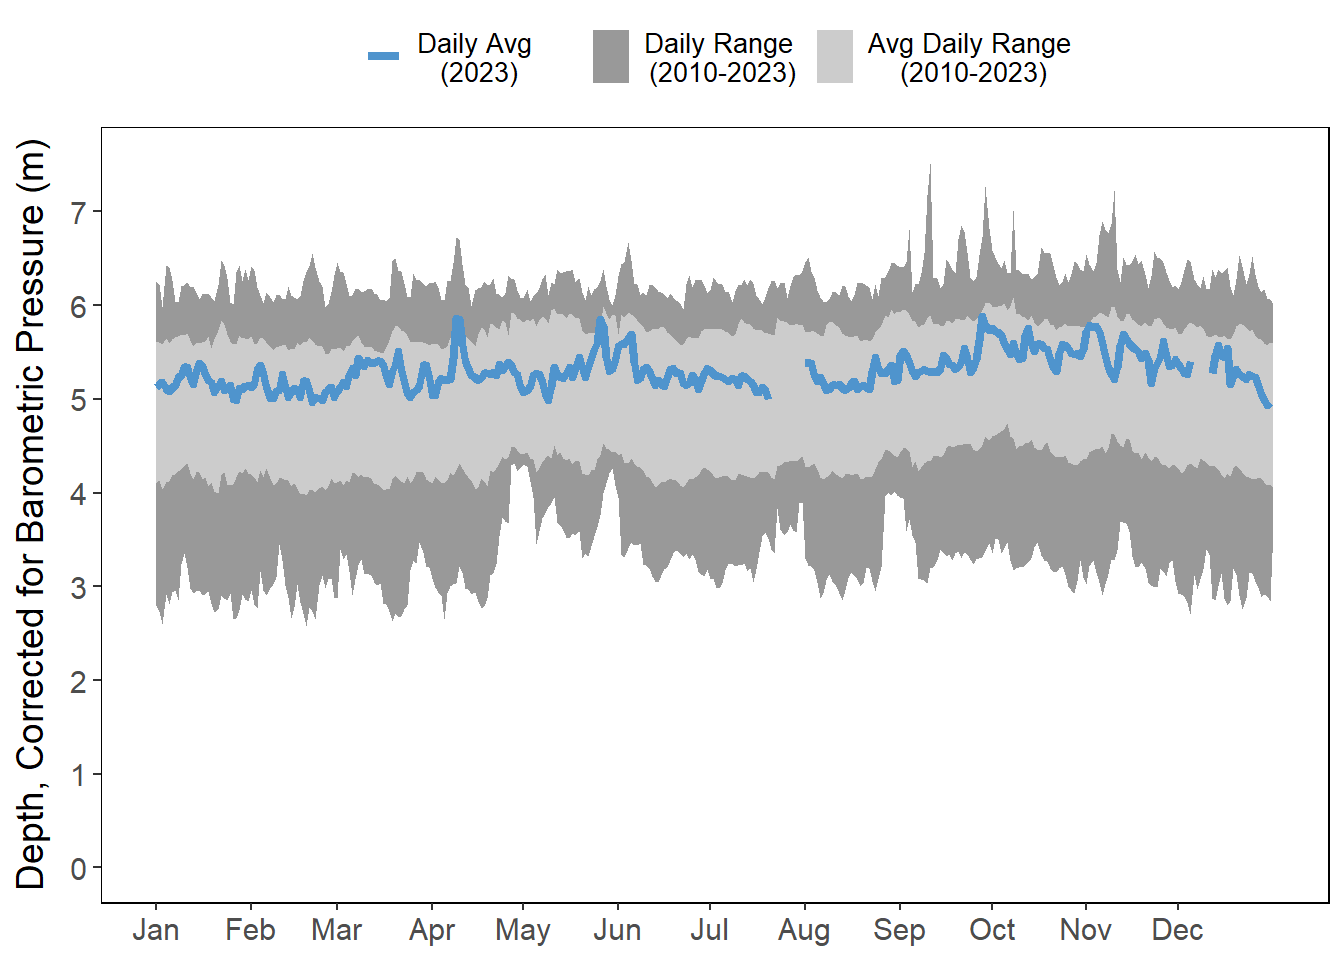
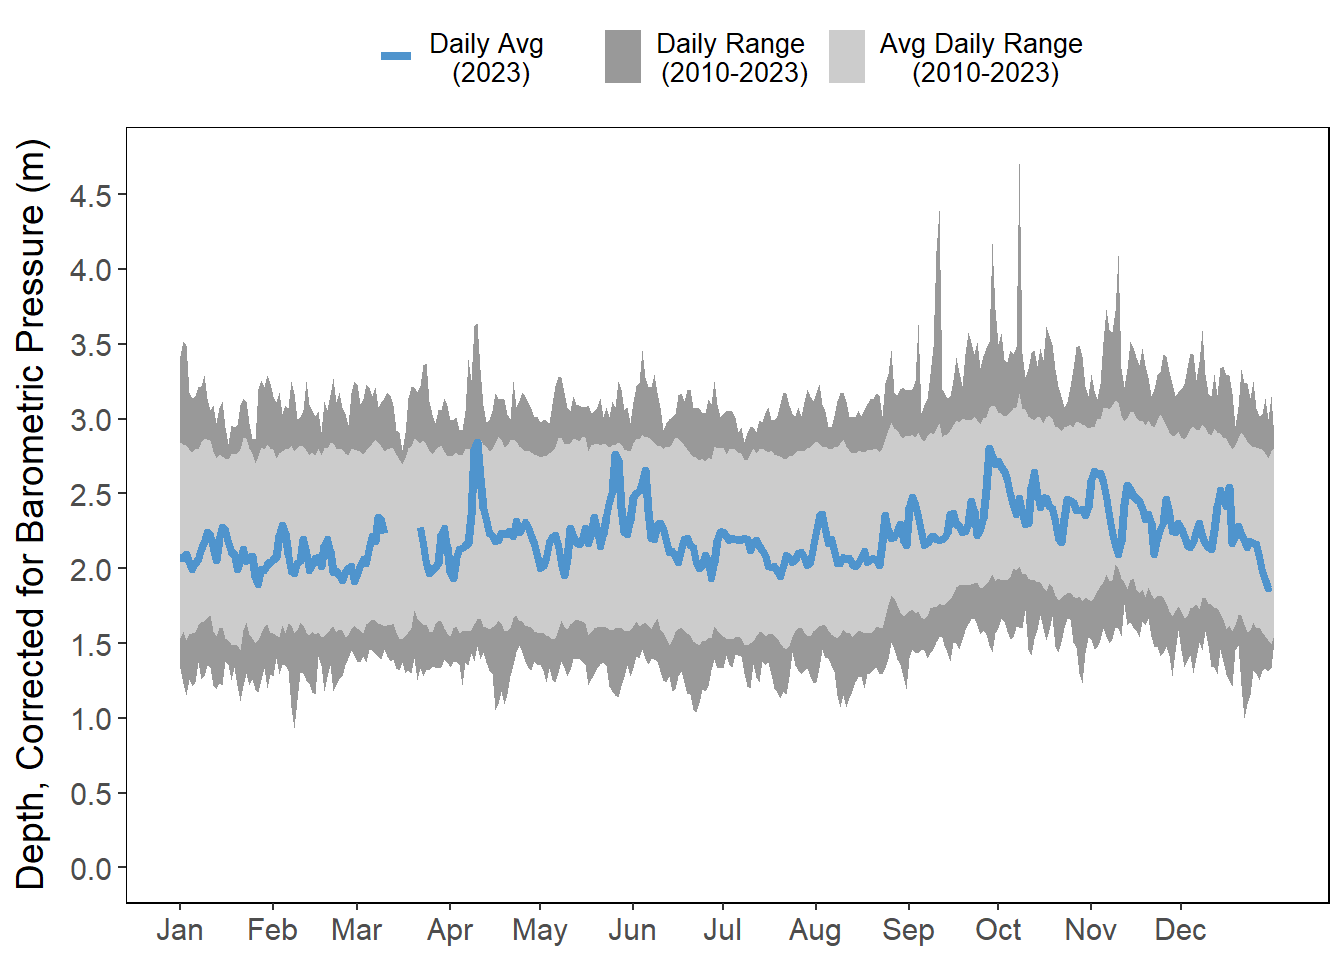
The effect of the King Tides on daily average water depths at all the stations is observable in the steady climb of the water beginning in mid-September (Figure 6.4); however, the individual “events” are not quite as clear outside of the Pellicer Creek station (Figure 6.4 (d)) where clear increases in water levels are closely aligned with these periods. Unfortunately, September King Tide, which was coupled with a Nor’easter, was not captured at this station due to equipment maintenance issues.
6.3.1 Water Depth
Note that the water level data at Pellicer Creek only includes data from 2021-2023, which is due to this station switching from reporting depth to reporting level (NAVD88) in 2021 (Figure 6.4 (d)).

6.4 Temperature anomalies
Extreme temperatures, both high and low, have drastic impacts on environmental function. For black mangroves (Avicennia germinans), temperatures under -4°C have been found to reduce mangrove cover (Cavanaugh et al. 2013). Extreme high temperatures are often health risks as they result in many heat-related illnesses.
Overall, examining monthly temperature anomalies this year, the first part of the year (January - April) and August were higher than “normal” (Figure 6.5). With February of this year almost setting a record on the time series (2018 had the hottest February). May, June, and October were “cooler” than normal.
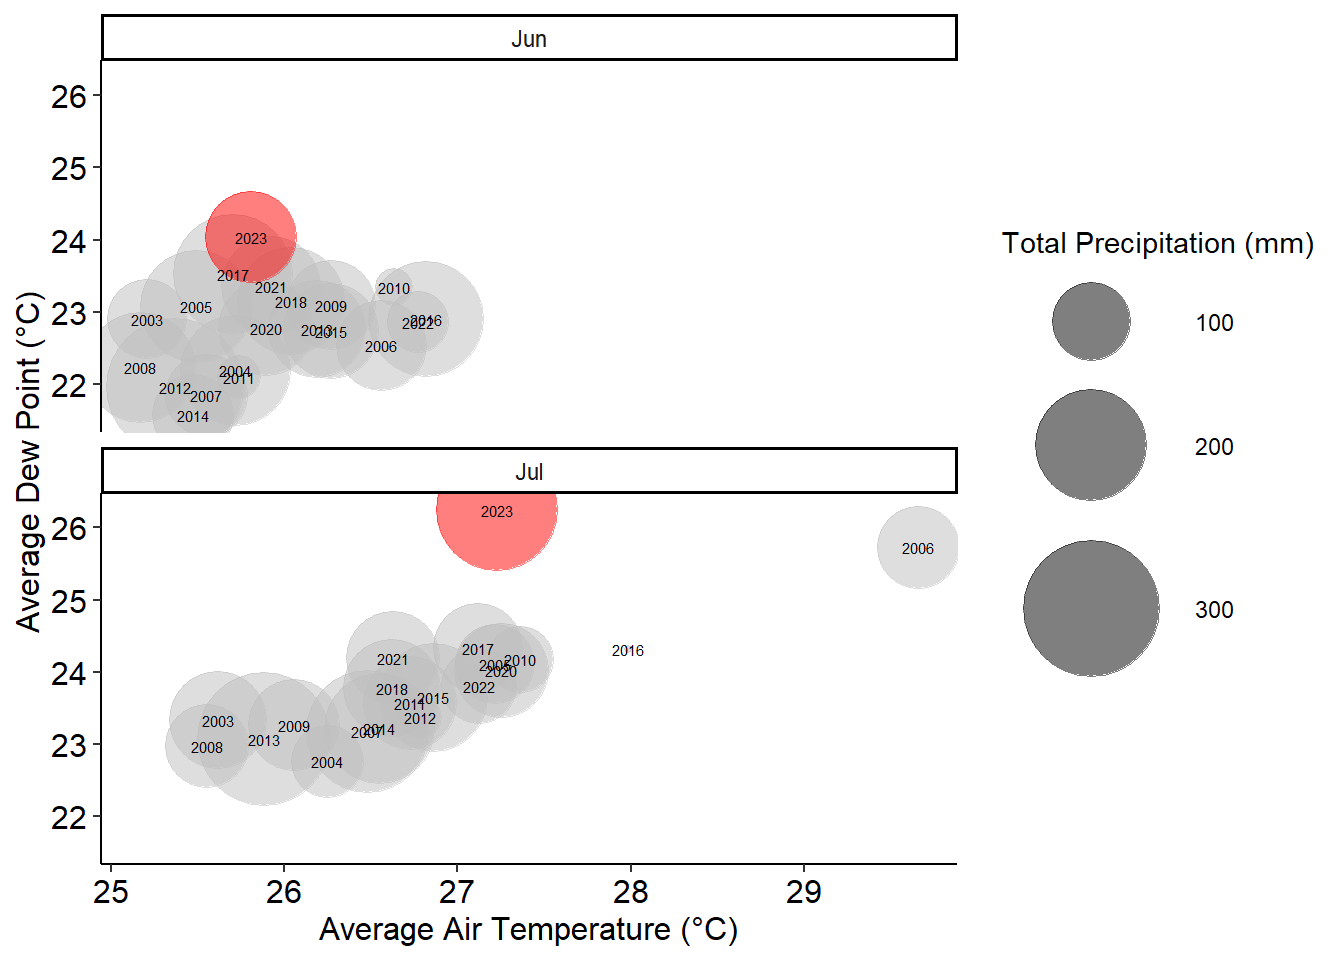
Due to news reports of extremely high temperatures in the summer months this year, a comparison was made of previous data for the months of June and July with average dew point (°C) and average air temperature (°C) with total monthly precipitation (mm) (Figure 6.6). The greater the dew point, the greater the moisture in the air. This year, 2023, is indicated in red. This year, 2023, has been one of the hotter and wetter summers on record (Figure 6.6).
In Florida, excessive heat warnings are issued with the heat index (what the temperature “feels like”, which takes relative humidity into consideration) exceeds 113 degrees. The Pellicer Creek station recorded several times when the hourly average heat index exceeded this threshold (Figure 6.7), particularly in August.
Heat waves are periods of abnormally hot weather that extend for more than two days. But what makes a heat wave?. For the purposes here, periods of time where temperatures were in excess of 90 degrees fahrenheit for greater than 2 hours were examined (Table 6.2) and most of these periods were observed daily from August 7 - August 15, 2023, the longest of which was approximately 9.25 hours on August 10, 2023.
No freezing events were recorded in this recording year.
| Date | Duration (hrs) |
|---|---|
| 2023-06-08 | 2.25 |
| 2023-06-13 | 6.75 |
| 2023-06-14 | 3.00 |
| 2023-06-27 | 6.75 |
| 2023-07-21 | 9.00 |
| 2023-07-22 | 4.25 |
| 2023-07-30 | 5.25 |
| 2023-08-07 | 4.00 |
| 2023-08-08 | 9.00 |
| 2023-08-09 | 5.50 |
| 2023-08-10 | 9.25 |
| 2023-08-11 | 6.25 |
| 2023-08-12 | 3.50 |
| 2023-08-14 | 2.75 |
| 2023-08-15 | 4.75 |
Callahan, John A, Daniel J Leathers, and Christina L Callahan. 2022. “Comparison of Extreme Coastal Flooding Events Between Tropical and Midlatitude Weather Systems in the Delaware and Chesapeake Bays for 19802019.” JOURNAL OF APPLIED METEOROLOGY AND CLIMATOLOGY 61.
Cavanaugh, Kyle C., James R. Kellner, Alexander J. Forde, Daniel S. Gruner, John D. Parker, Wilfrid Rodriguez, and Ilka C. Feller. 2013. “Poleward Expansion of Mangroves Is a Threshold Response to Decreased Frequency of Extreme Cold Events.” Proceedings of the National Academy of Sciences 111 (2): 723–27. https://doi.org/10.1073/pnas.1315800111.