5 Nutrient Indicators
The State Thresholds used in the chlorophyll a, total nitrogen, and total phosphorus calculations come from Florida State Surface Water Quality Standards within the Florida Administrative Code.
By visiting Florida Rules
5.1 Dissolved Oxygen
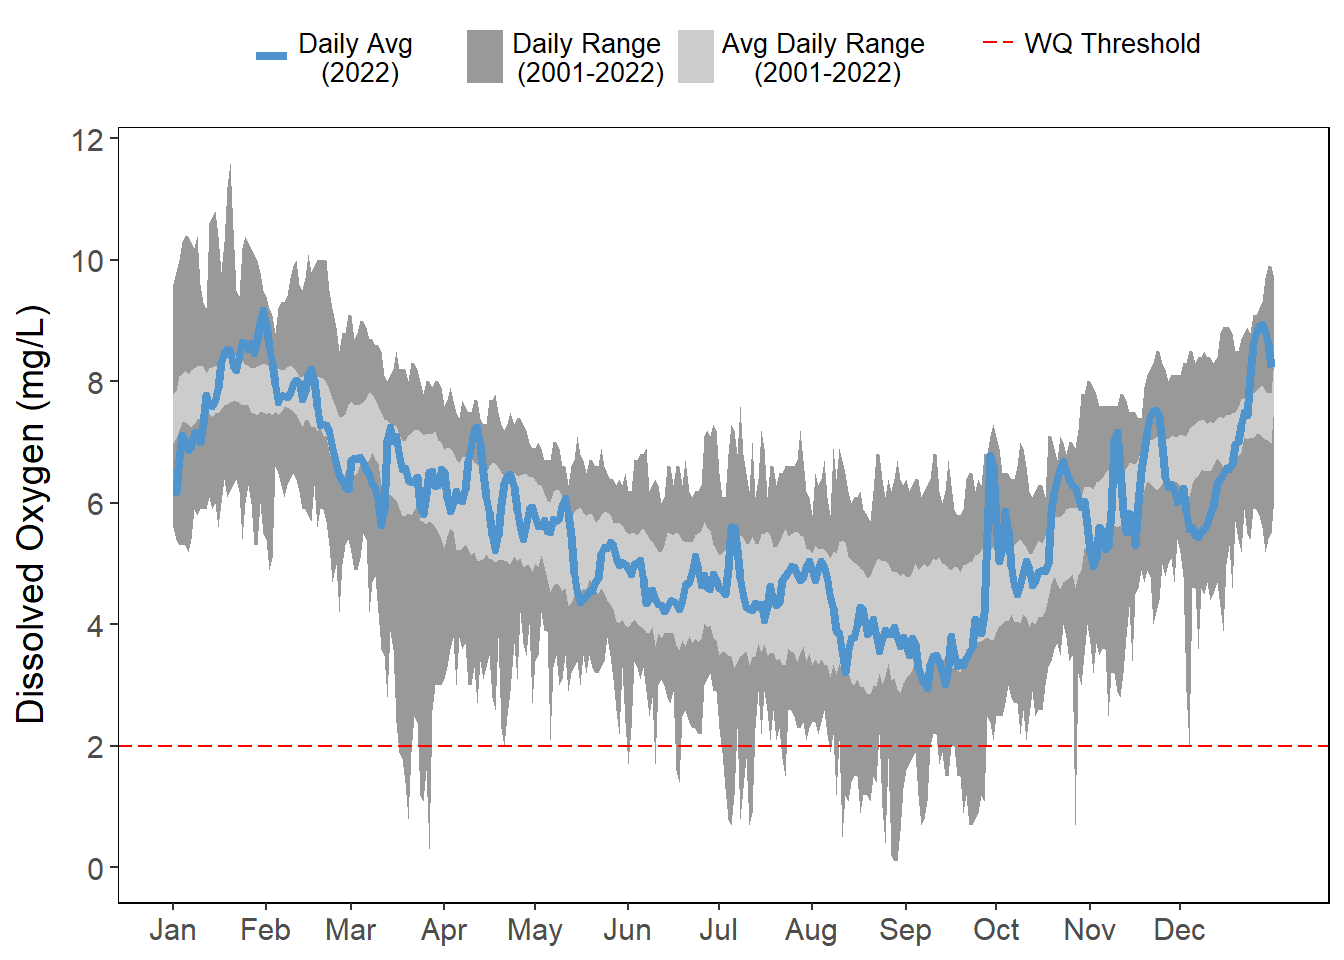
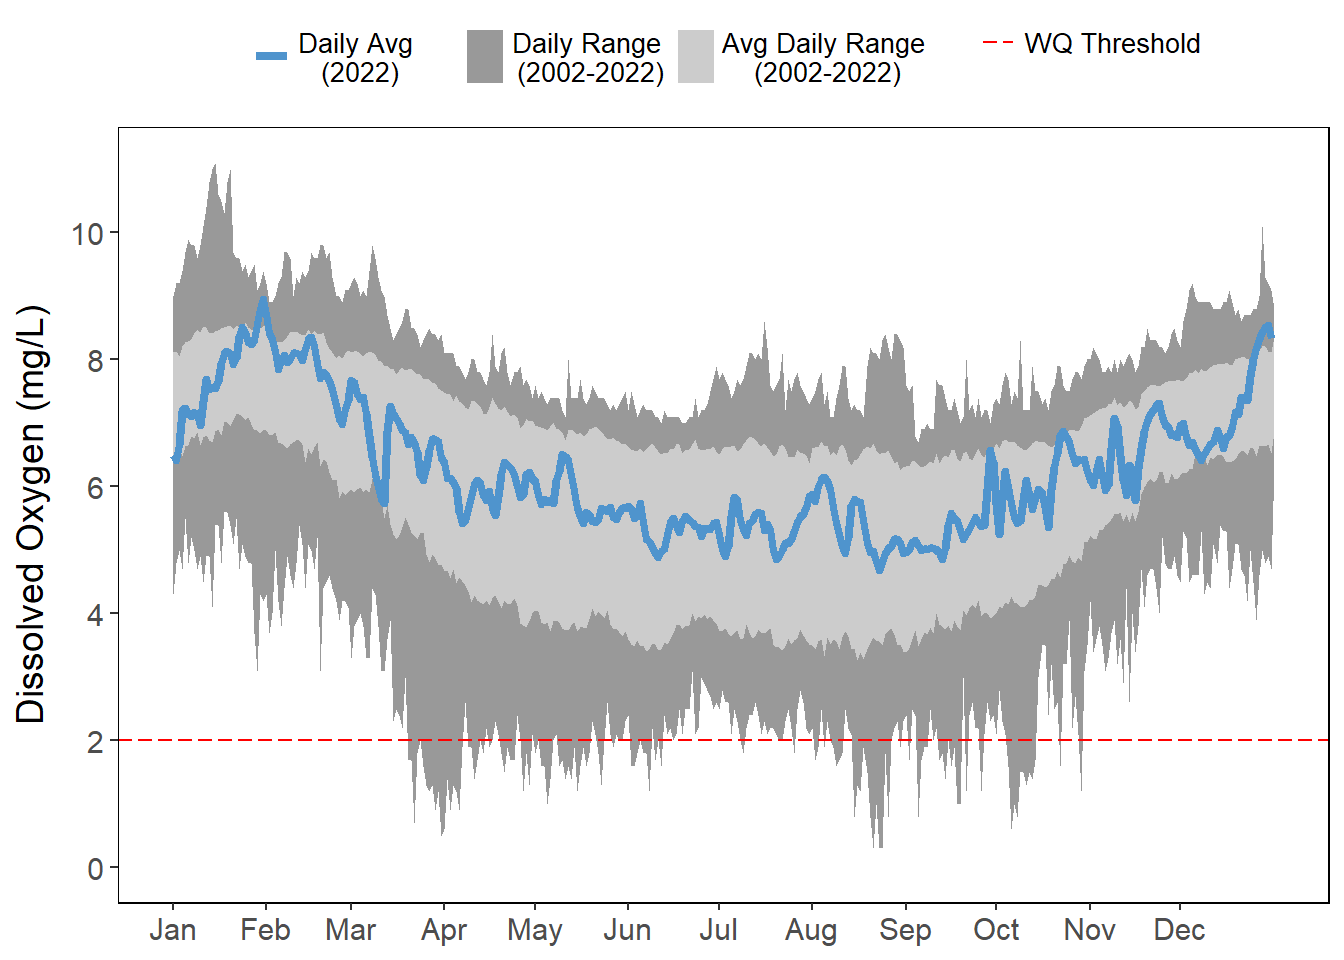
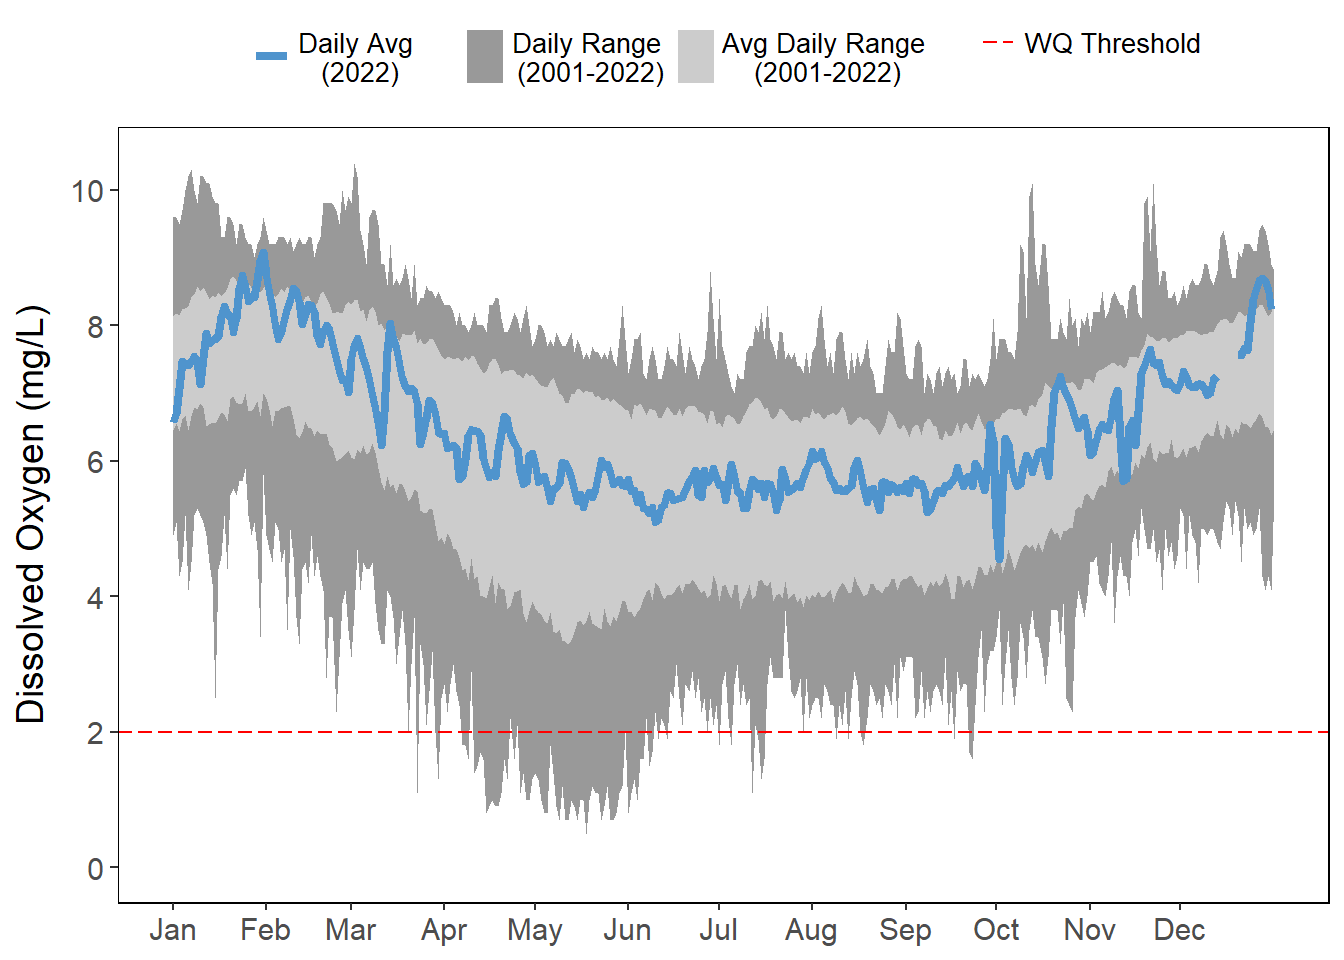
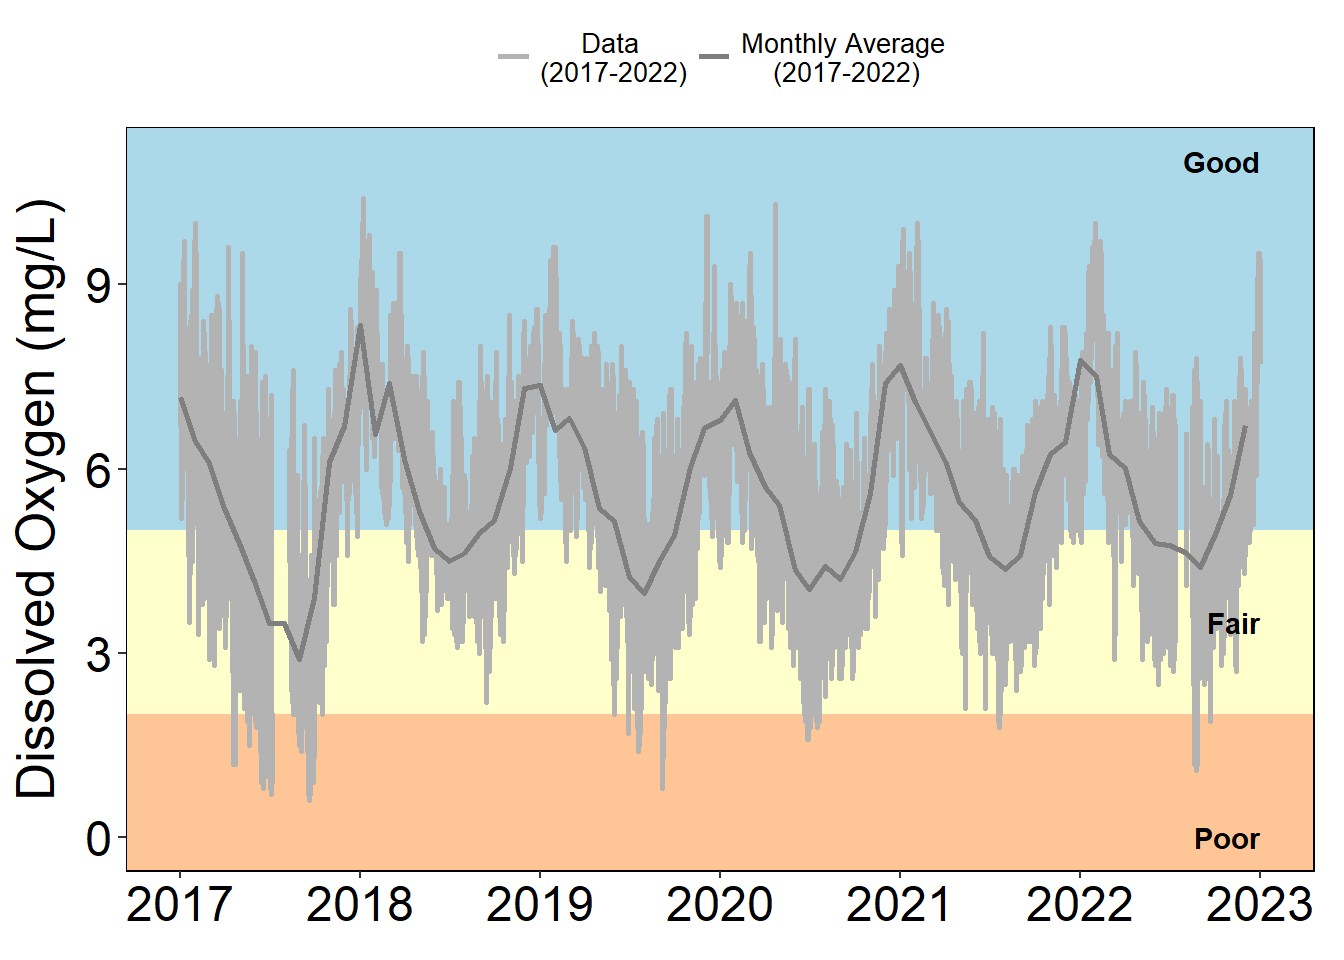
All stations experience seasonal patterns in dissolved oxygen with lower values in the warm, summer months (Figure 5.1). A distinctive jump in dissolved oxygen occurred at all sites during the storm period of Hurricane Ian (September 28 - October 1, 2022) as well as Hurricane Nicole (November 9-11, 2022) (See Chapter 7 and Chapter 8).
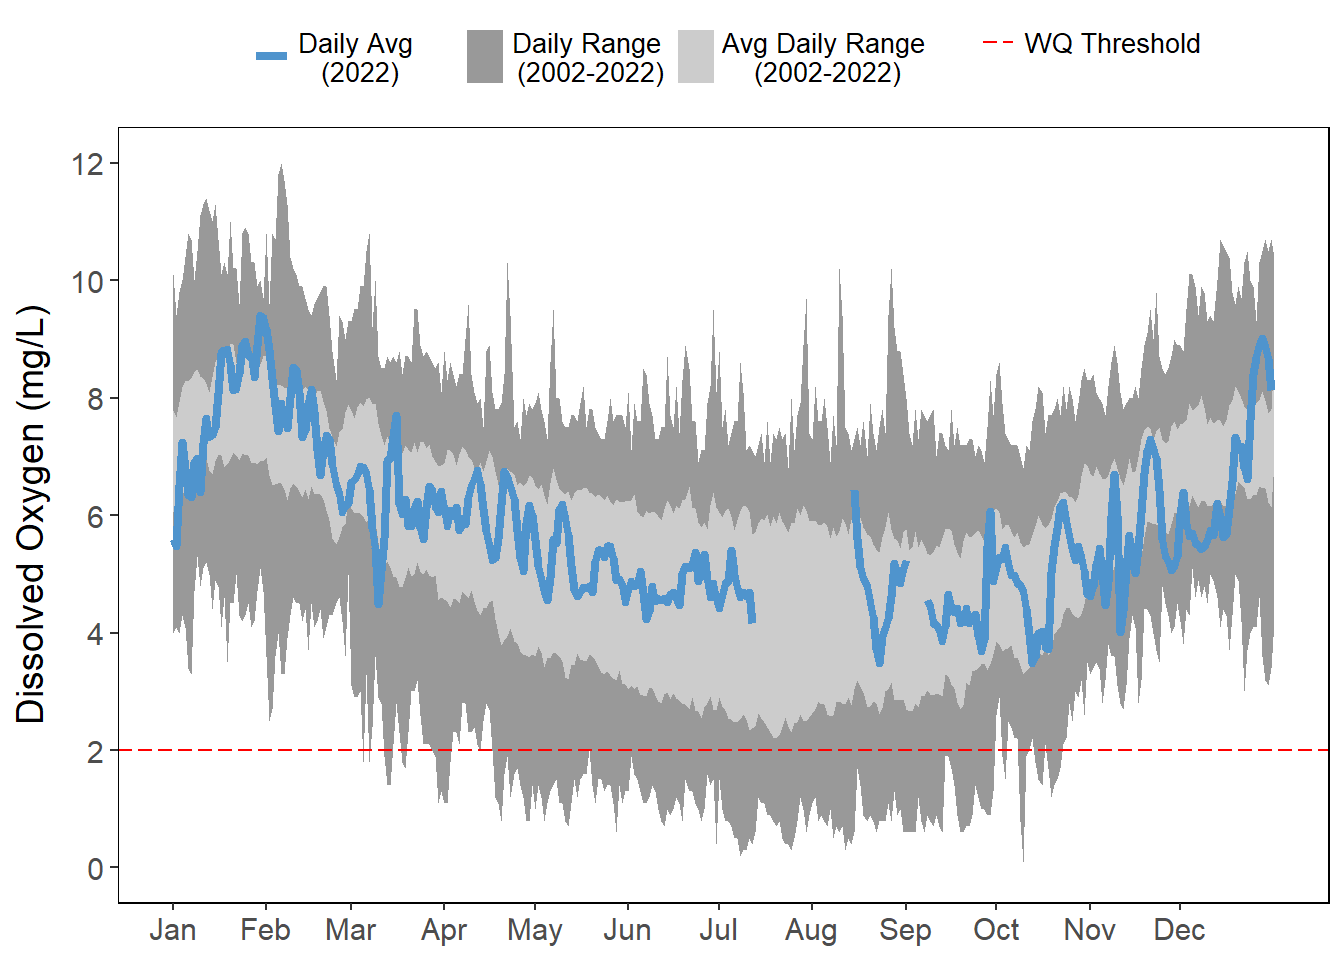
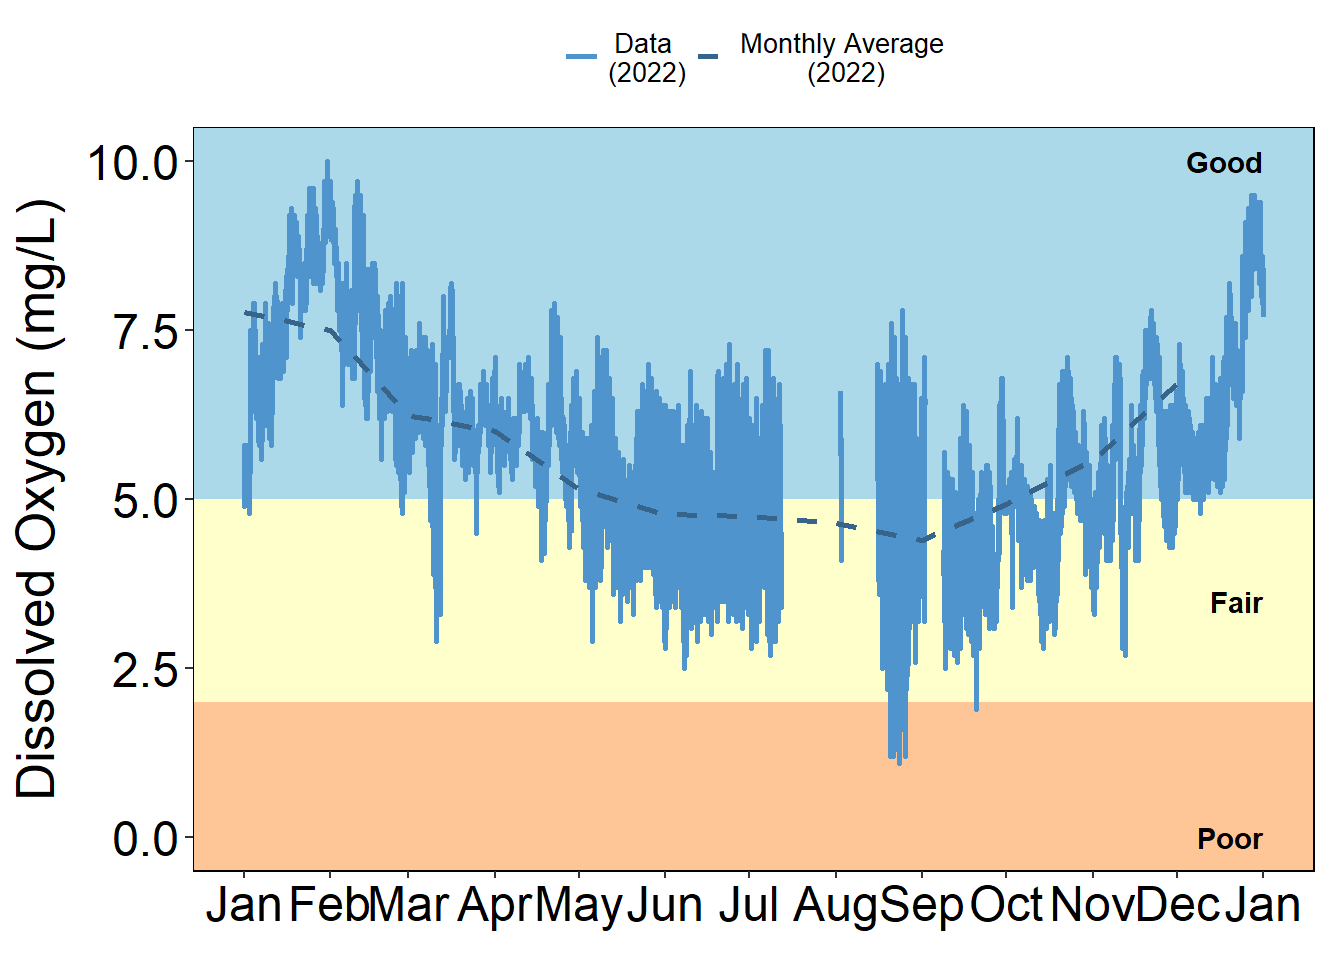
Pellicer Creek is located within a waterbody with known impairments for dissolved oxygen, chlorophyll a, and fecal coliform bacteria. As such, this station frequently experiences low dissolved oxygen values, particularly in the summer months; this year has been no exception (Figure 5.2). The dissolved oxygen in late August was as low as values observed during the time of Hurricane Irma in 2017 (Figure 5.2 (a)). Values began to rise in September, but it is likely that the storm surge associated with Hurricane Ian in late September helped to bring in and further oxygenate this system (Figure 5.2 (b)).
5.2 Chlorophyll a
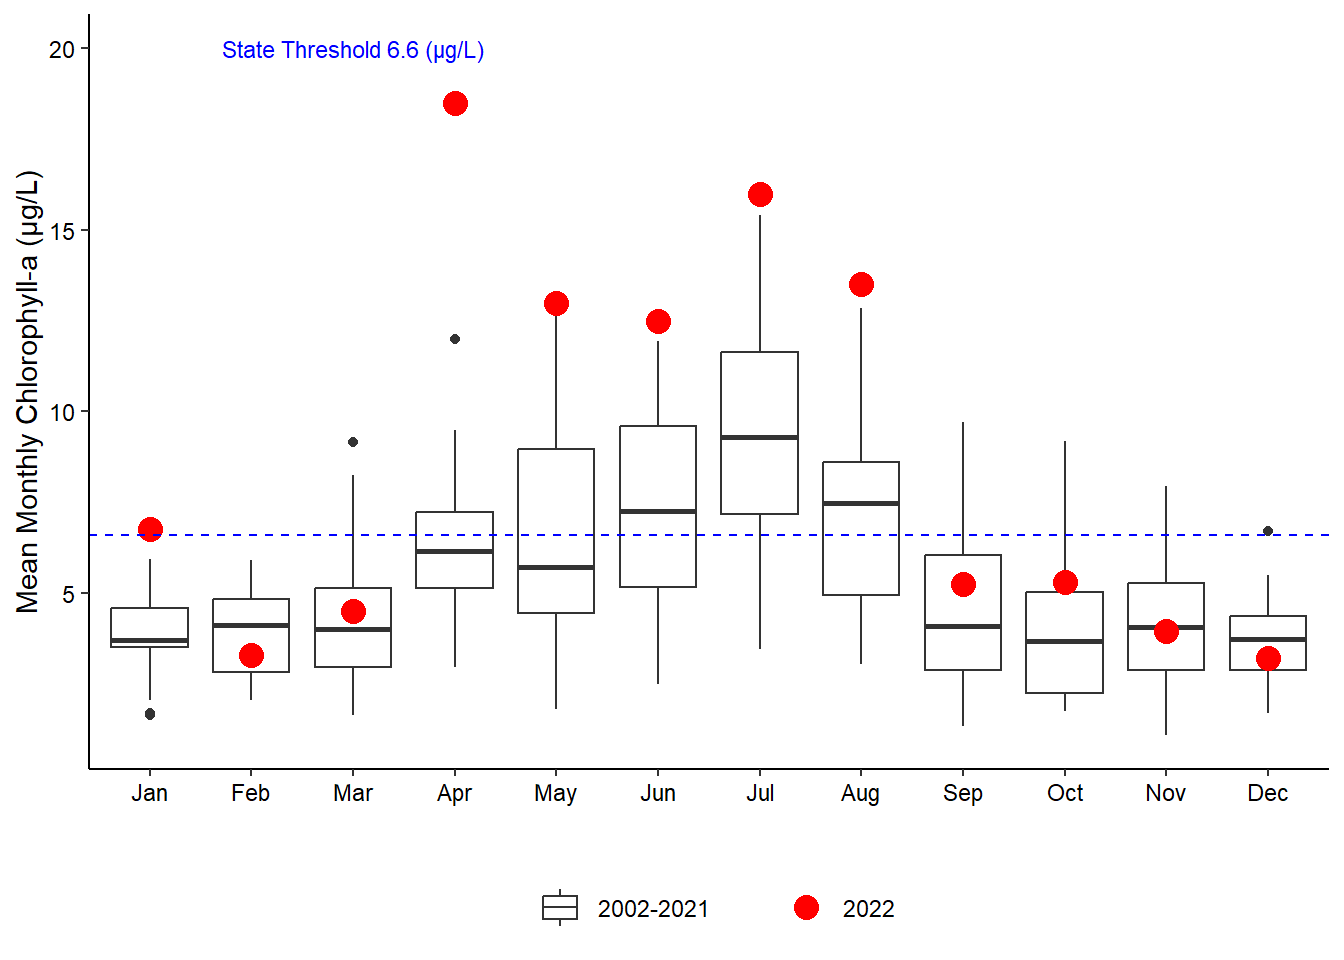
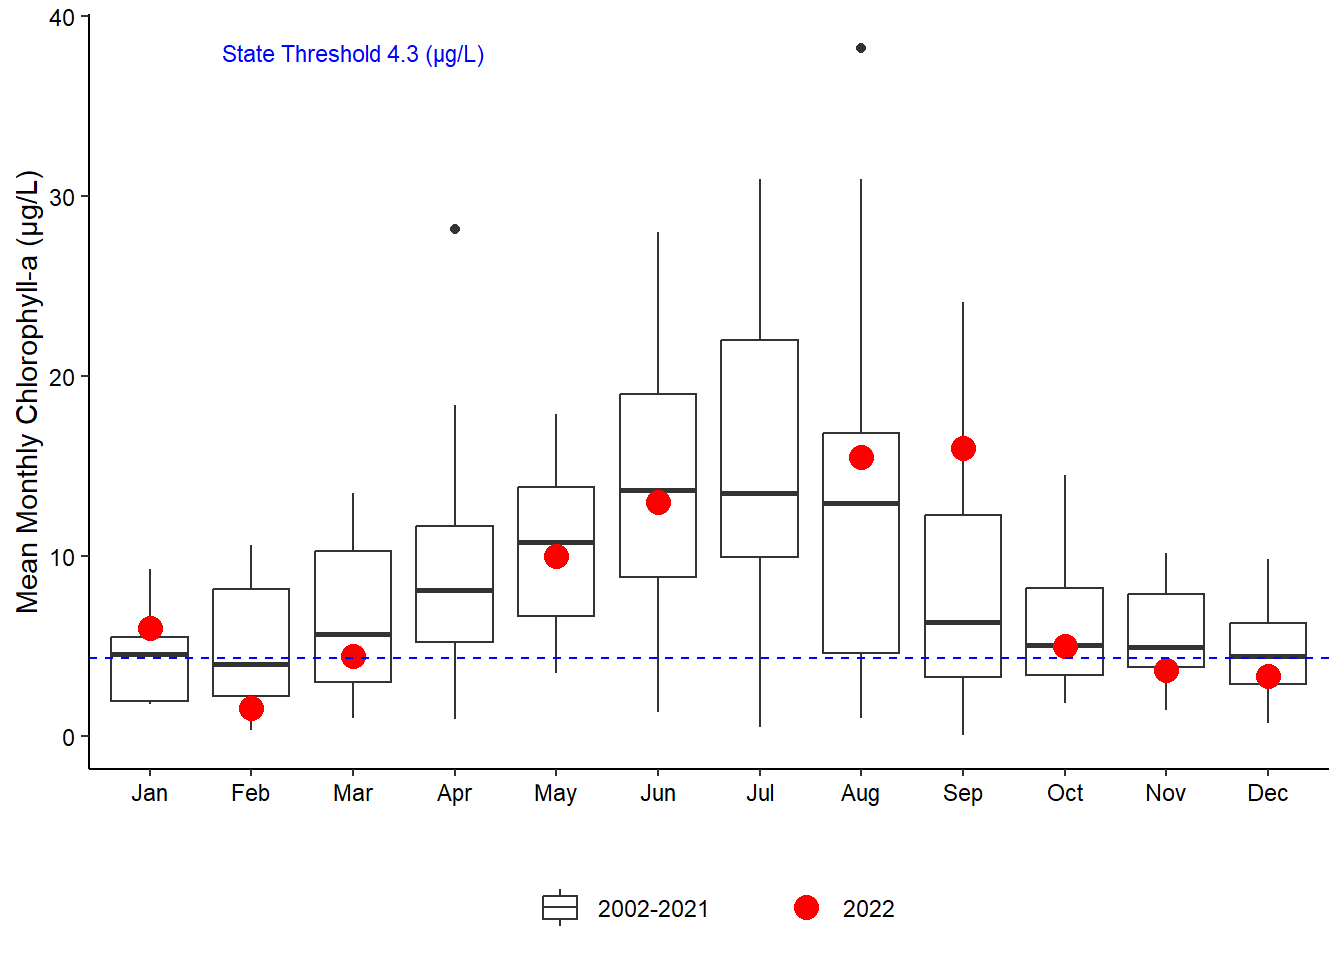
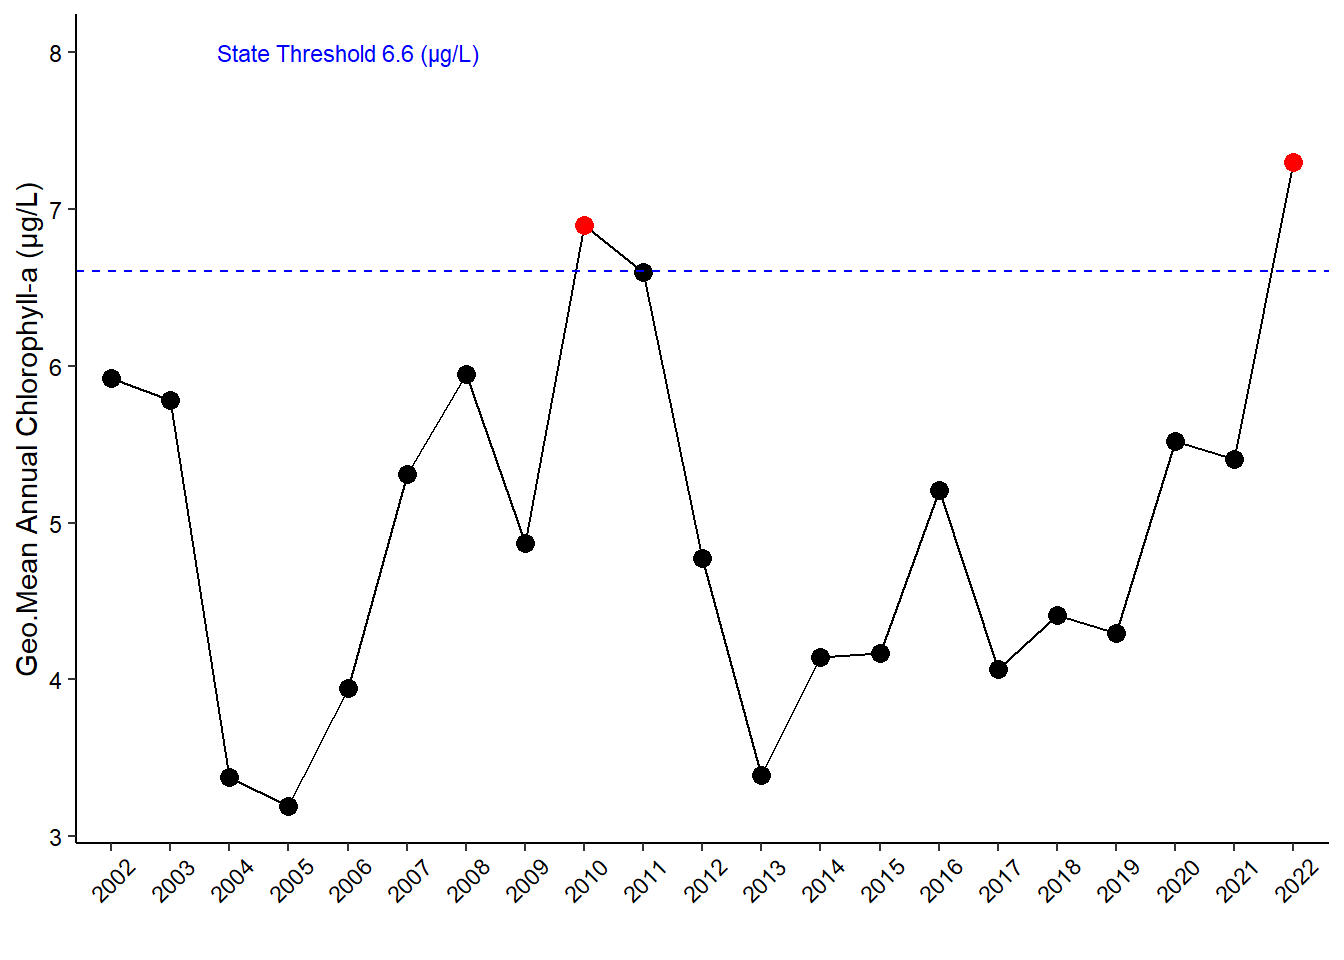
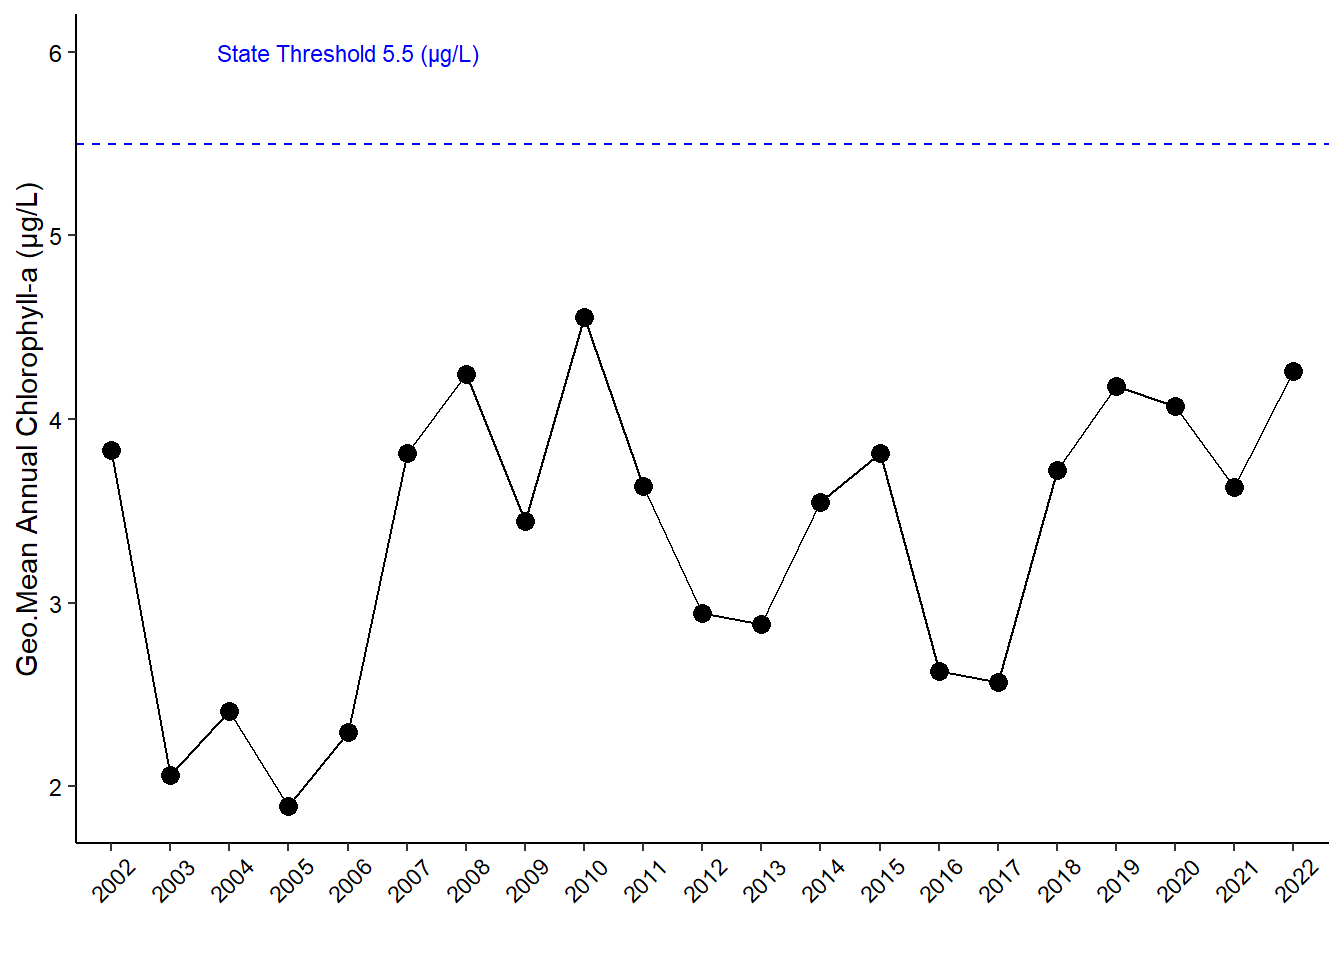
Elevated chlorophyll a levels were observed at the three intracoastal waterway sites over several months this year (Figure 5.3). The levels were especially high at Pine Island from April through August with each month seeing the highest value this year compared to all the data from previous years; the highest observed chlorophyll in the entire time series was observed in April (18.5 \(\mu\)g/L) (Figure 5.3 (a)). These extremely high monthly values resulted in an annual geometric mean (AGM) chlorophyll value above the state threshold for the second time in the 19 year data set at Pine Island (Figure 5.4 (a)).
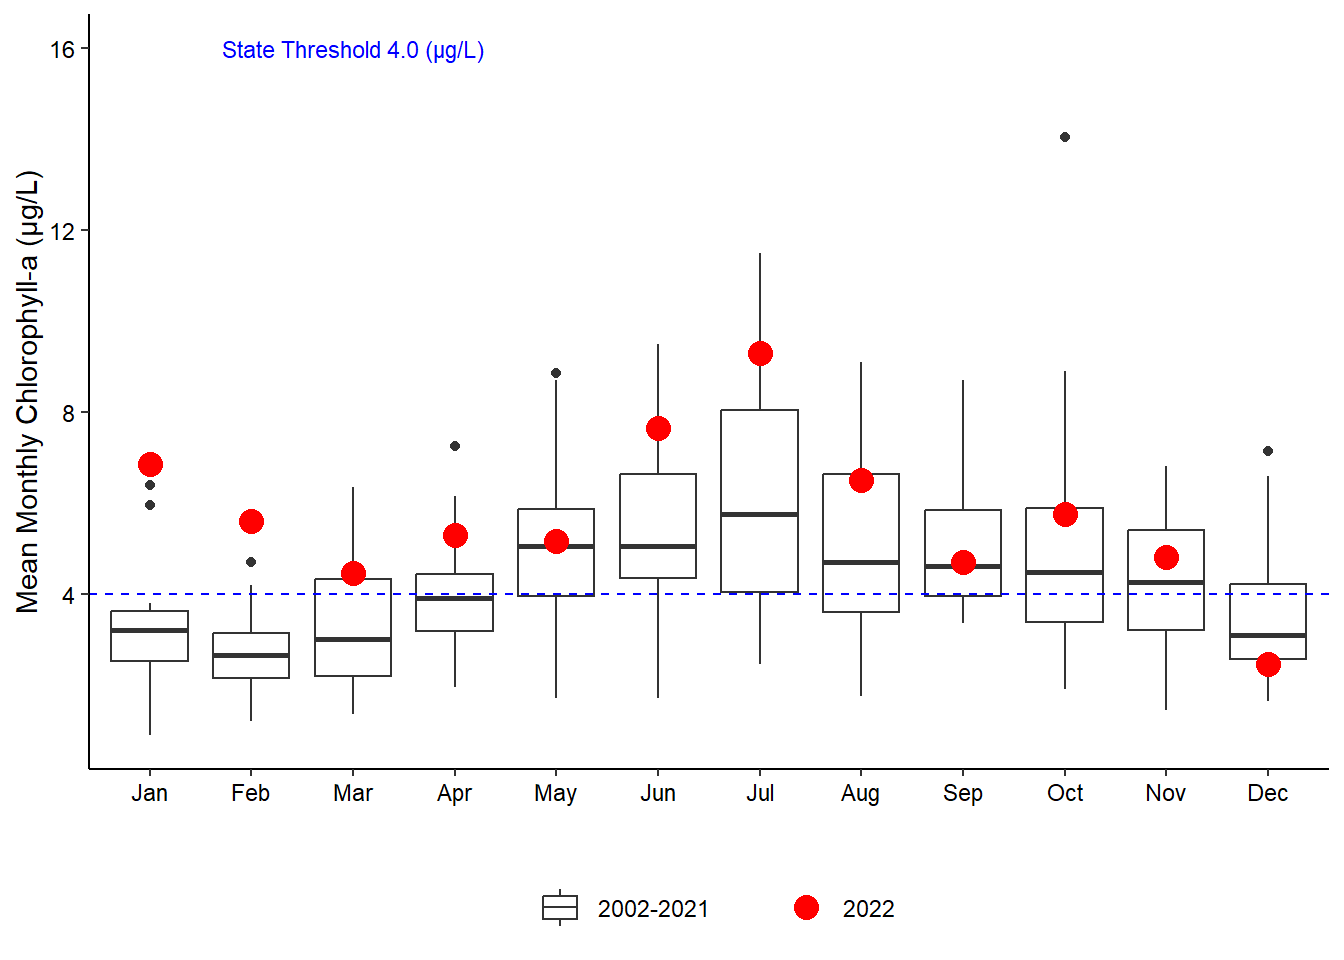
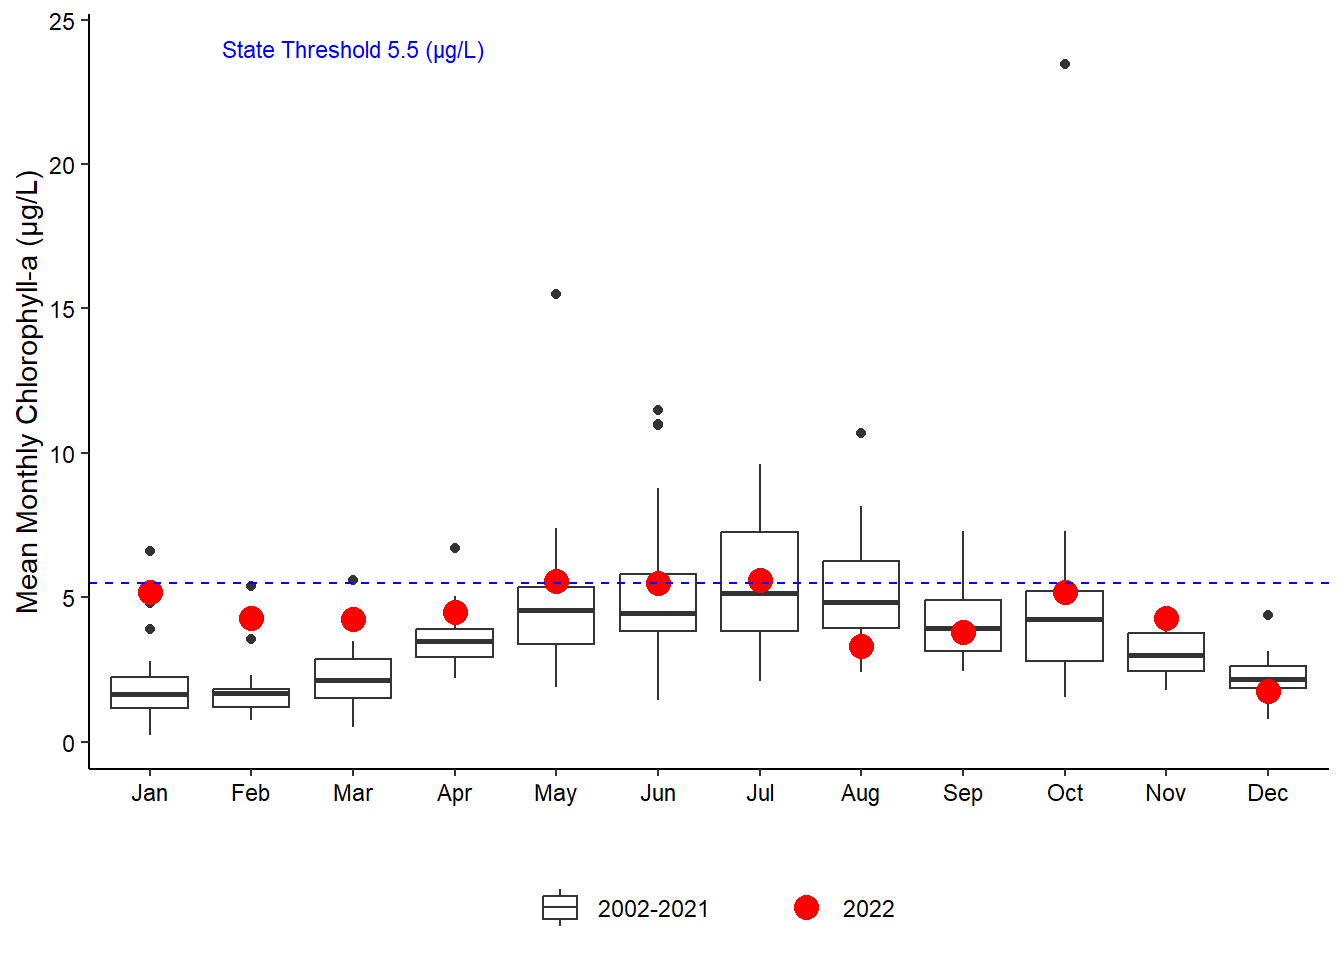
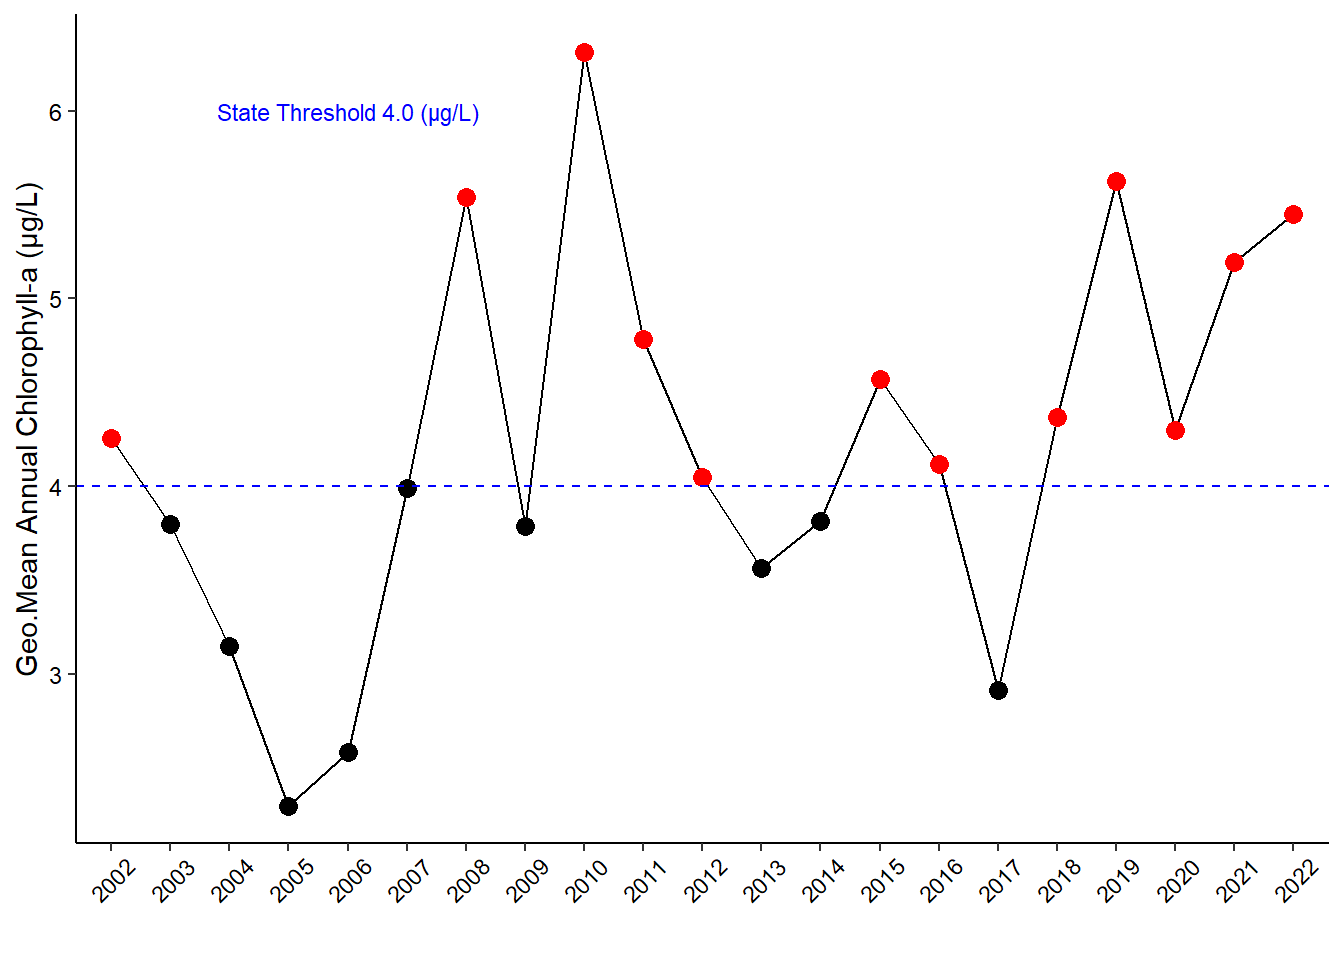
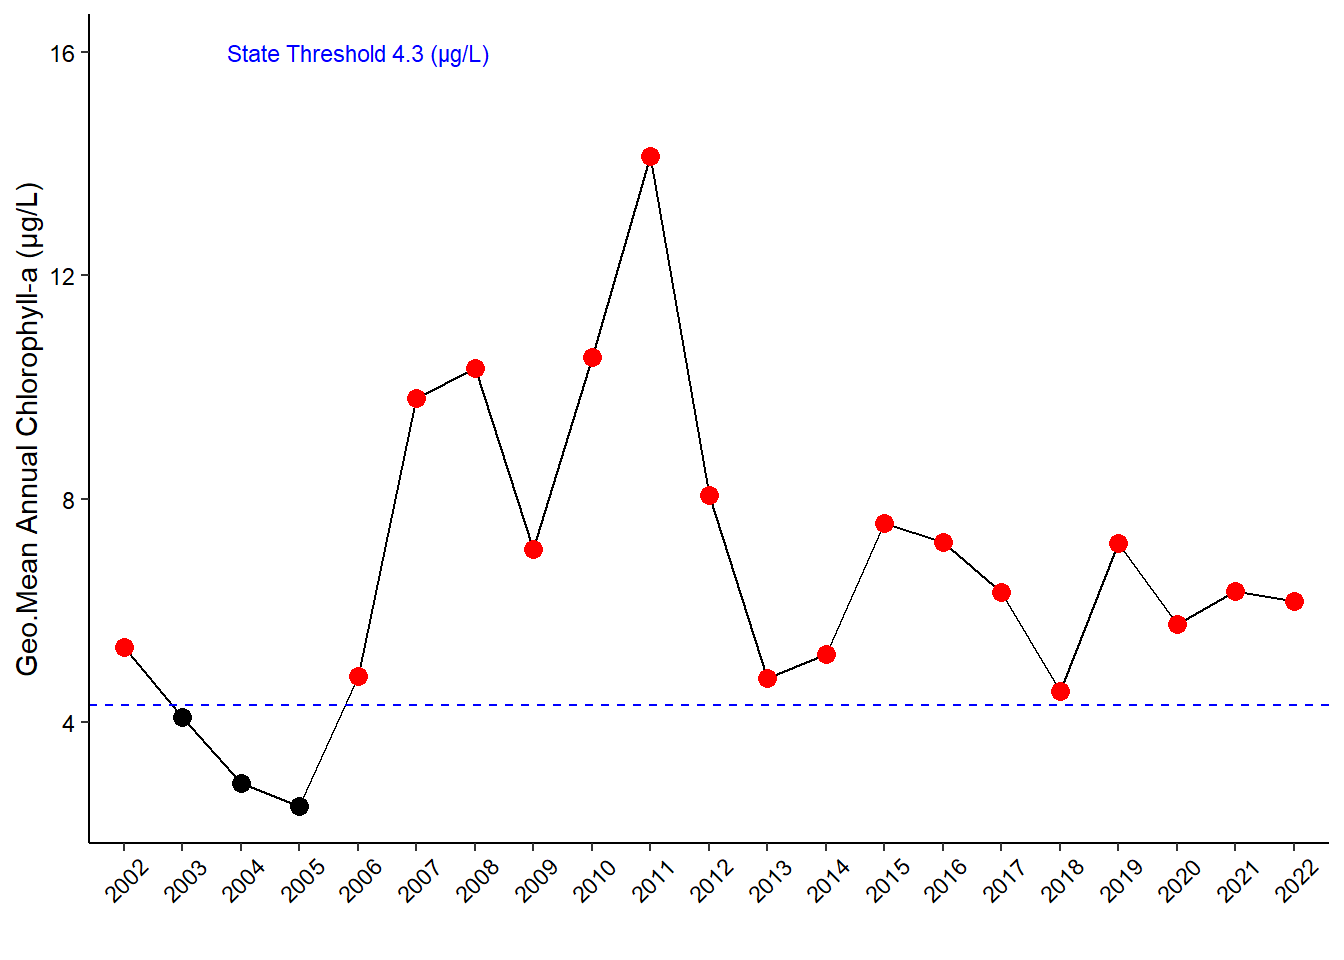
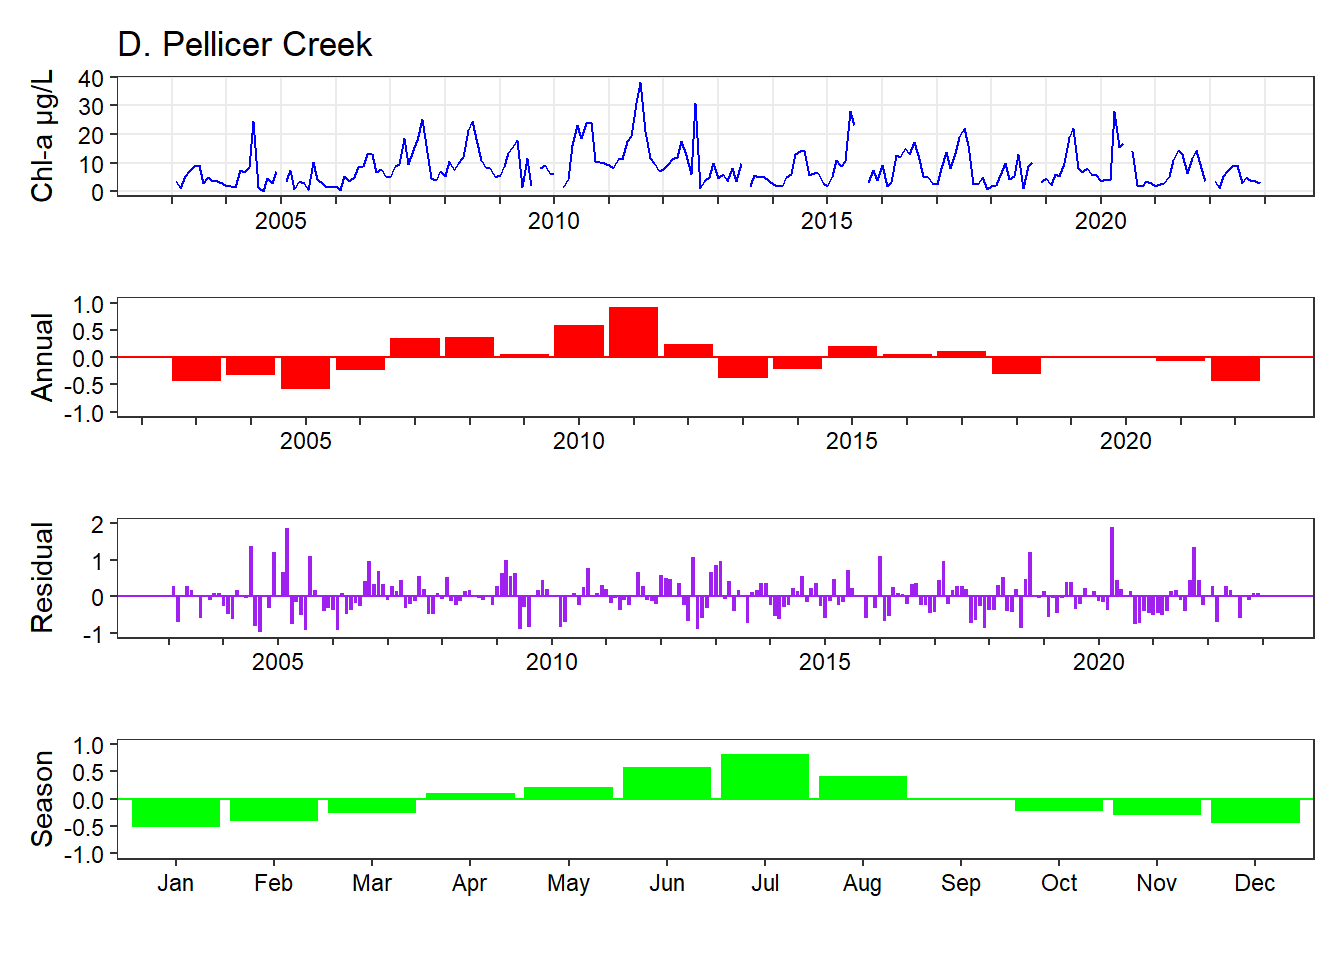
San Sebastian also had the highest chlorophyll observed in January and February of this year compared to the same months in all previous years (6.85 and 5.6 \(\mu\)g/L, respectively; Figure 5.3 (b)). High chlorophyll a at all stations in January was likely due to high temperatures in the early part of that month (Figure 4.3). San Sebastian and Pellicer Creek continued to see high chlorophyll at those sites (Figure 5.4 (b); Figure 5.4 (d)).
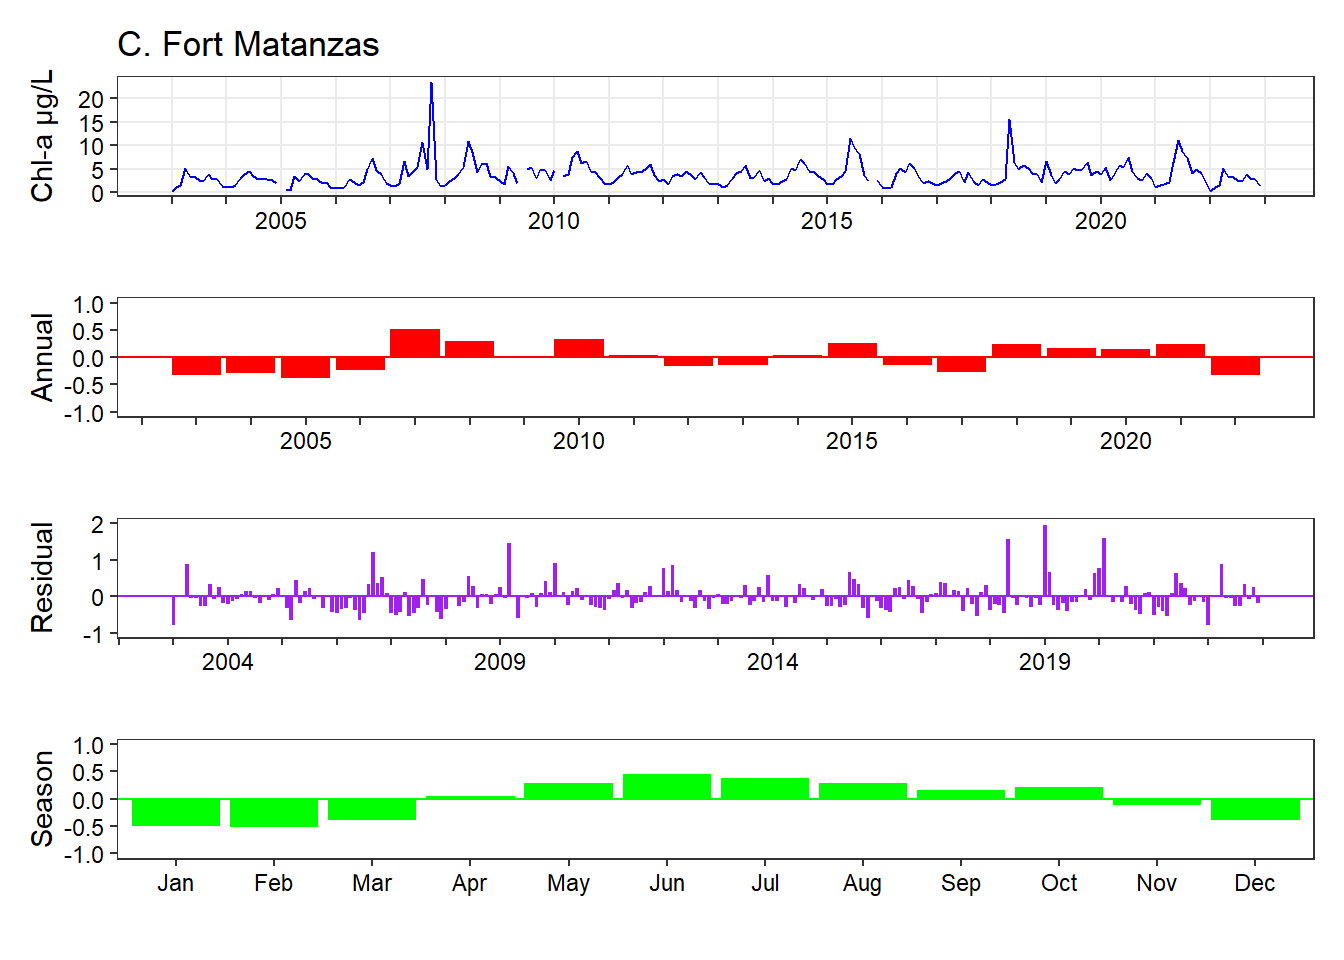
Although much higher seasonal chlorophyll was observed at Fort Matanzas in the first quarter, August was much lower than average (Figure 5.3 (c)). Fort Matanzas also did not have high annual mean chlorophyll (Figure 5.4 (c)). It continues to be a station with observed regularly with low chlorophyll a.
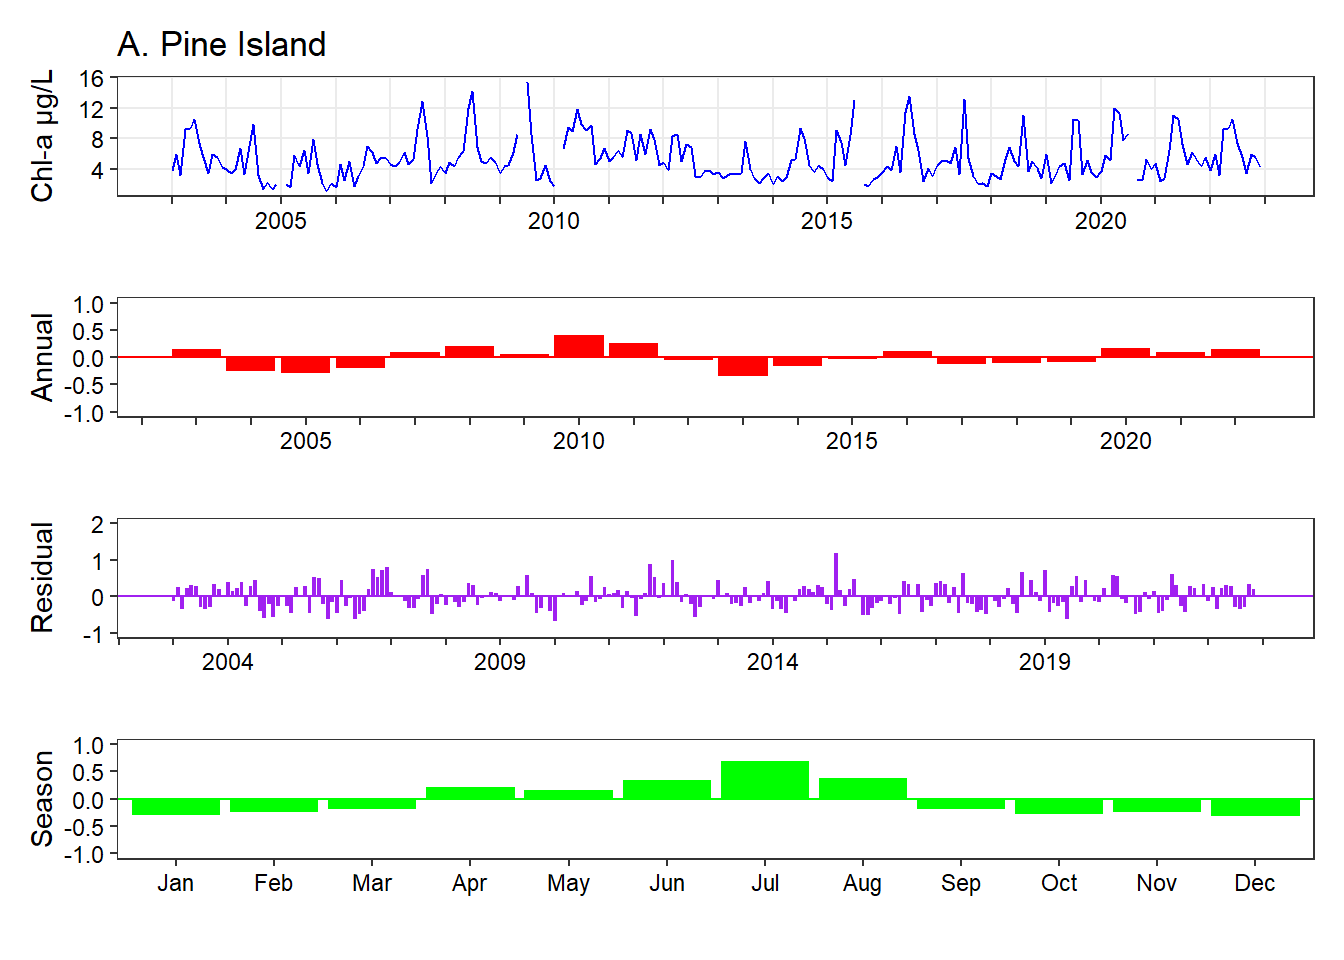
Using methods from Cloern and Jassby (2010), variability and patterns in the monthly chlorophyll a data were further extracted by decomposing the timeseries at each station using Equation 4 into an annual effect, mean seasonal pattern, and residual “events”.
\[ c_{ij}=Cy_im_j\epsilon_{ij} \] Where \(c_{ij}\) is chlorophyll concentration in year \(i\)(\(i=1,...,N\)) and month \(j\)(\(j=1,...12\)); C is the long-term mean of the series; \(y_i\) is the annual effect in the ith year; \(m_j\) is the seasonal (monthly) effect in the jth month; and \(\epsilon_{ij}\) is the residual.
- If \(y_i\) >1, indicates a year with above-average mean Chl-a.
- If \(m_j\) >1, indicates a mean monthly Chl-a greater than the annual mean.
- If \(\epsilon_{ij}\) >1, indicates an observation greater than the expected value for that month and year.
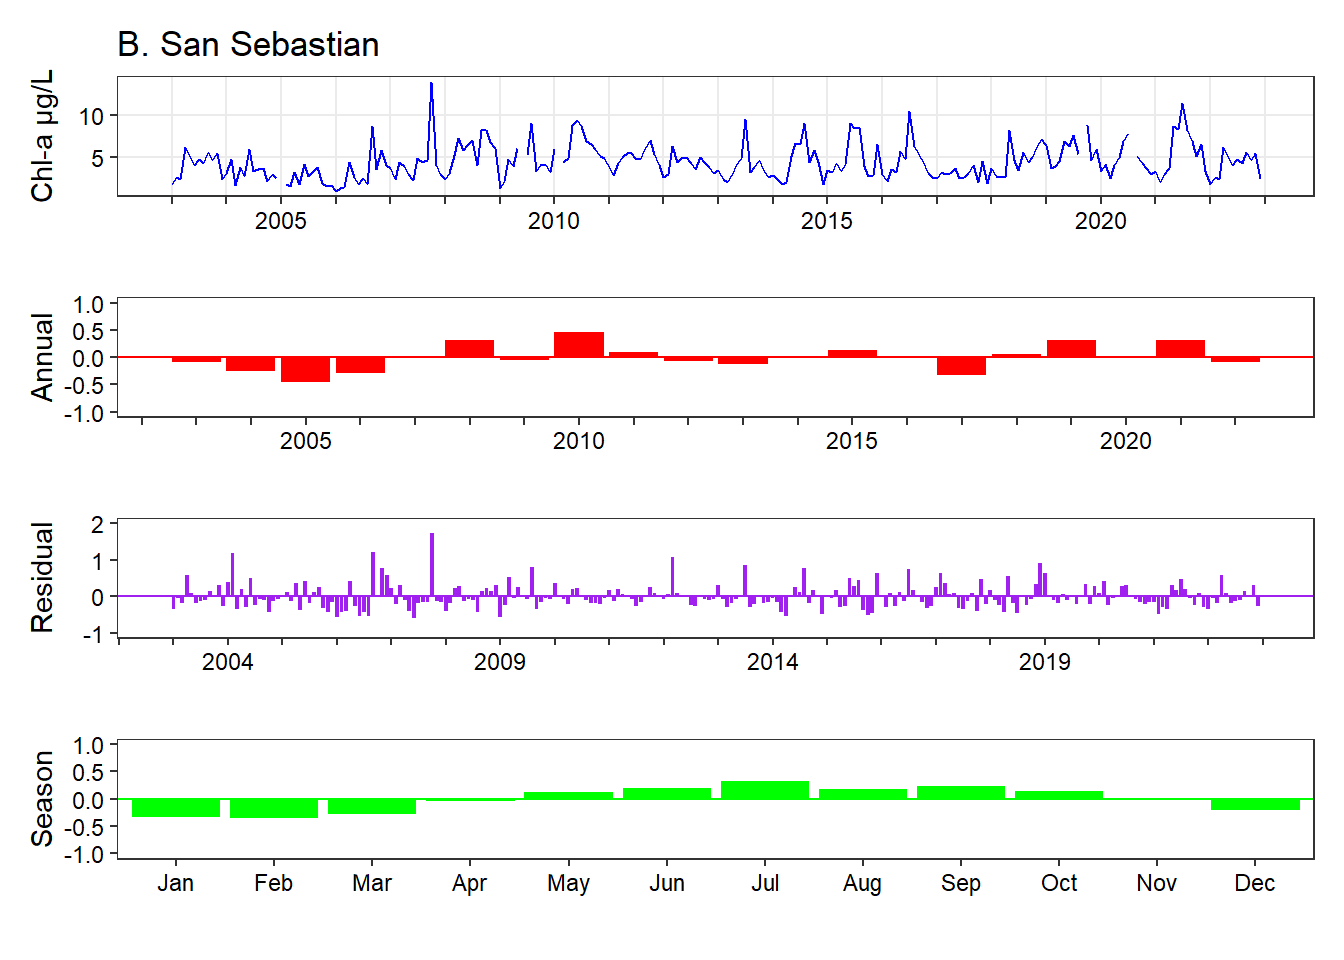
Based on these methods, Pine Island has observed higher annual chlorophyll a in the past three years. Additionally, the five months in 2022 in which the highest monthly values of chlorophyll a were recorded were identified in the residual “events” that were high, they were not the highest deviations in the timeseries; that value occurred in 2015 (Figure 5.5 (a)). All other stations observed lower annual variability in 2022 and each station shows a distinctive seasonal pattern with the highest values occurring from April through August, particularly at Pine Island and Pellicer Creek (Figure 5.5). San Sebastian and Fort Matanzas, likely due to their proximity to inlets, appear to have a more protracted season which further extends into October (Figure 5.5 (b); Figure 5.5 (c)).
5.3 Nitrogen
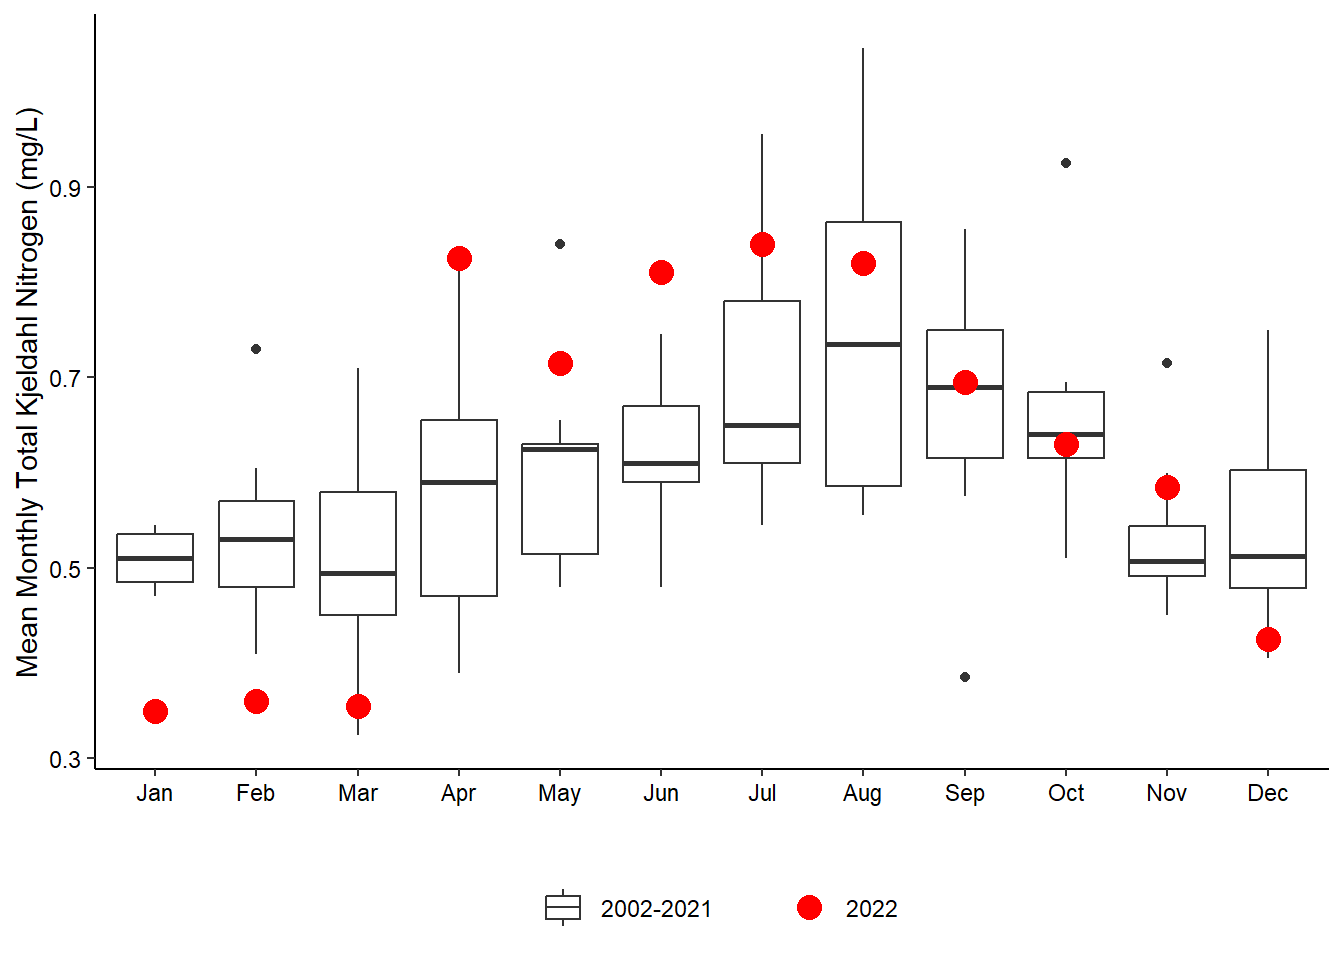
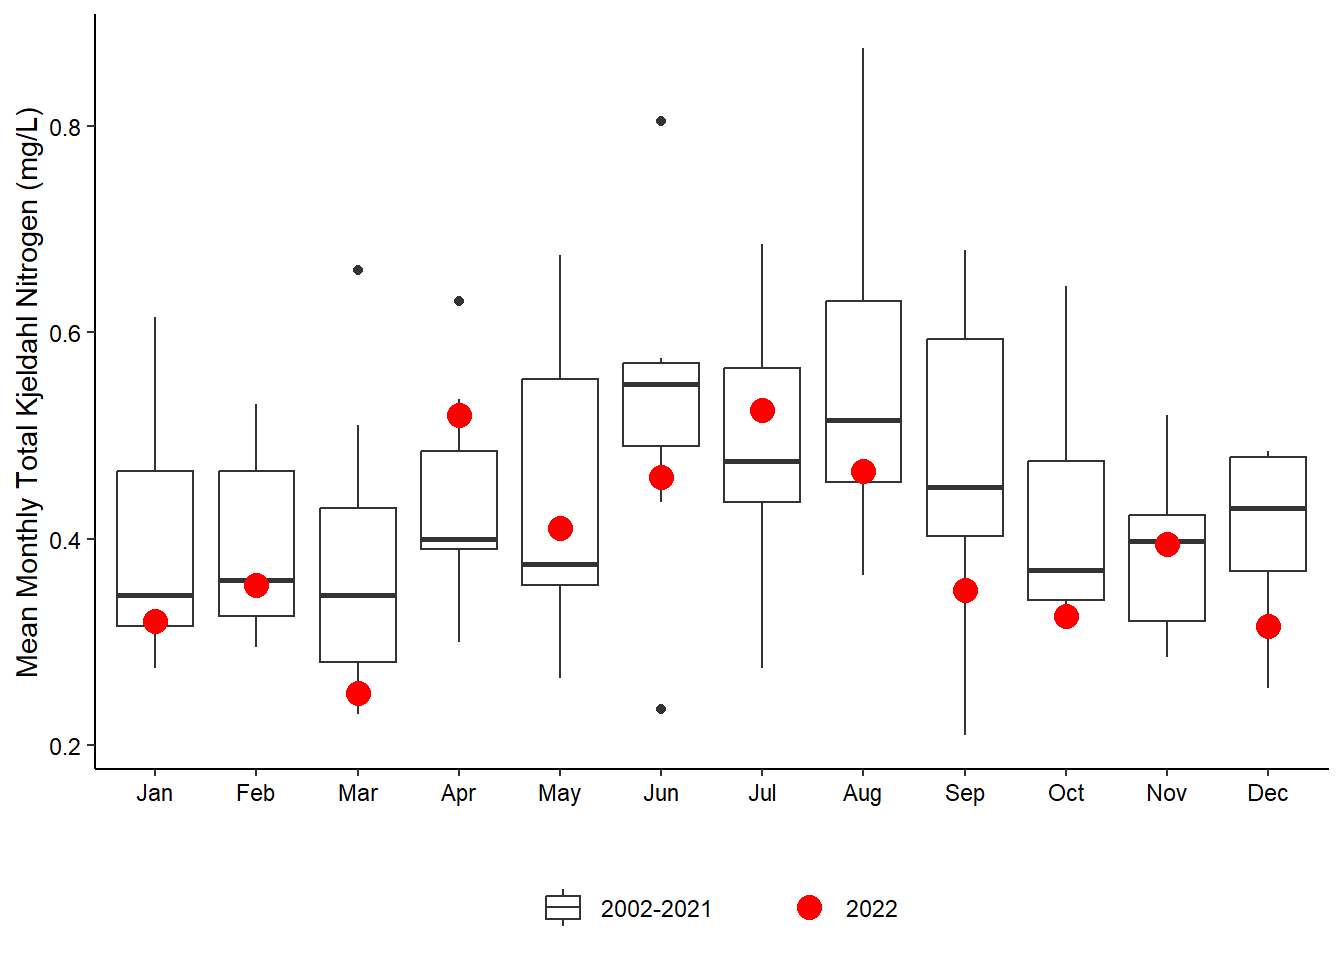
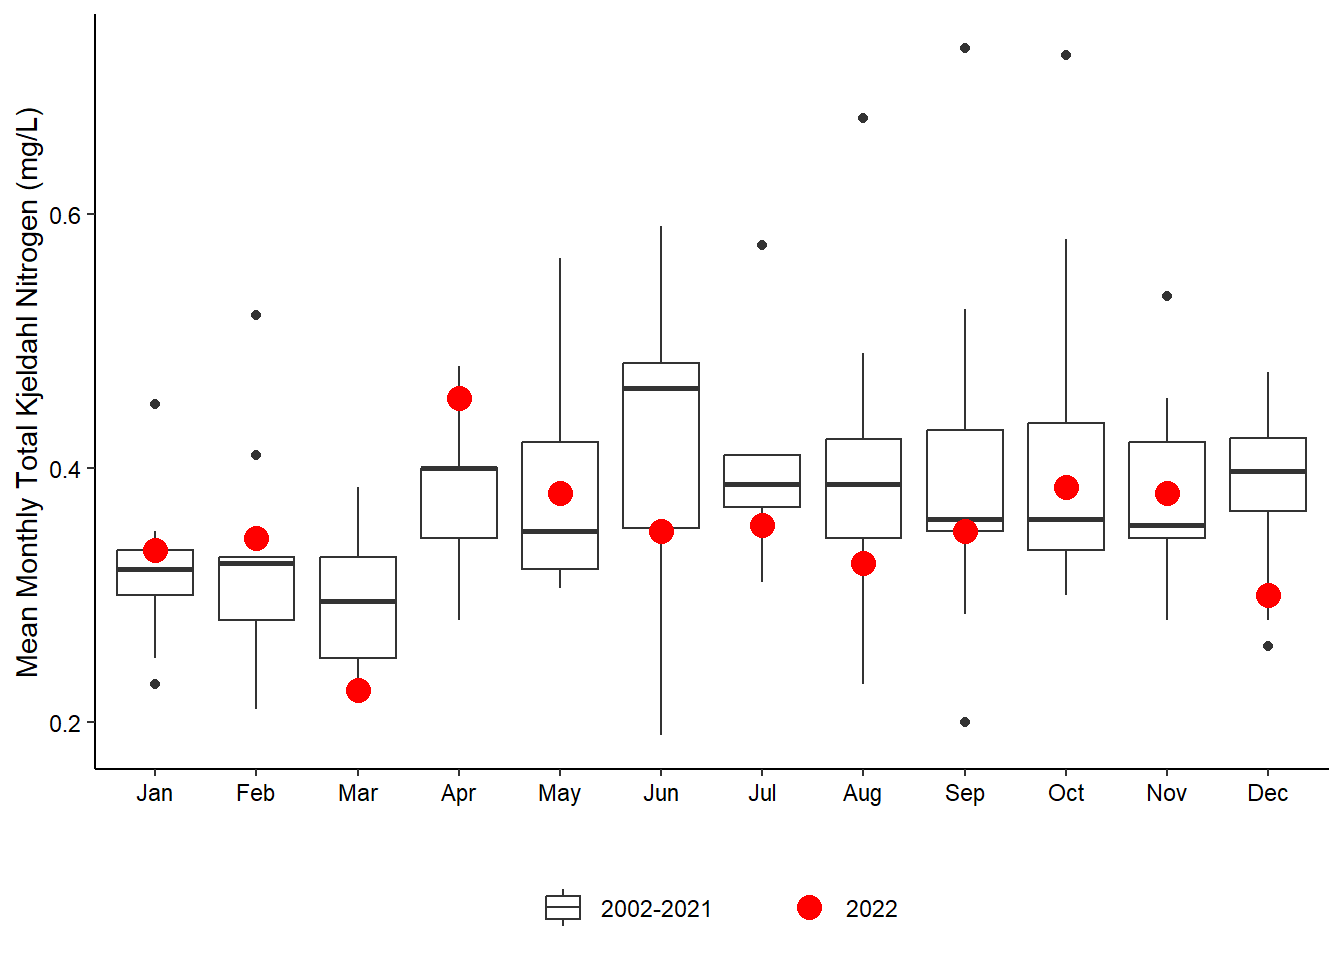
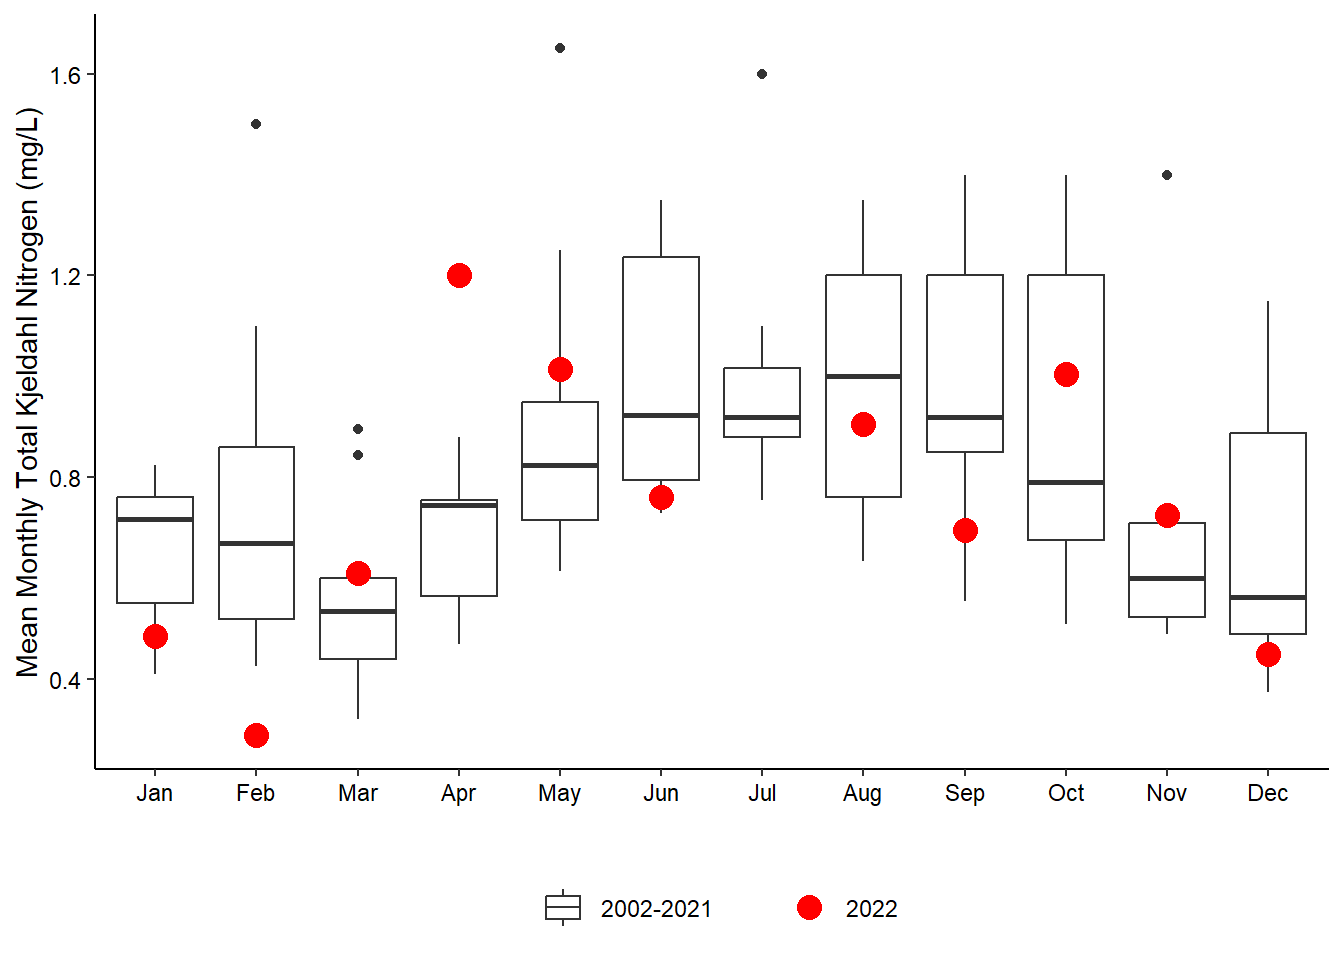
Interpretations of patterns in total nitrogen (TN) and dissolved inorganic nitrogen (DIN) are difficult this year since quite a bit of the values were not able to be calculated (see below). However, there is a pattern in total kjeldahl nitrogen (TKN) at all sites (Figure 5.8). At Pine Island, there are very low values between January-March and elevated levels from April-July (Figure 5.8 (a)). This distinctive shift between March and April may likely be in response to the large amounts of rainfall (Section 4.1) the system experienced in March (Figure 4.1 (b)). This response was seen at all the other sites, especially Pellicer Creek, which is also a more brackish site and sensitive to upland freshwater deposition (Figure 5.8 (b)).
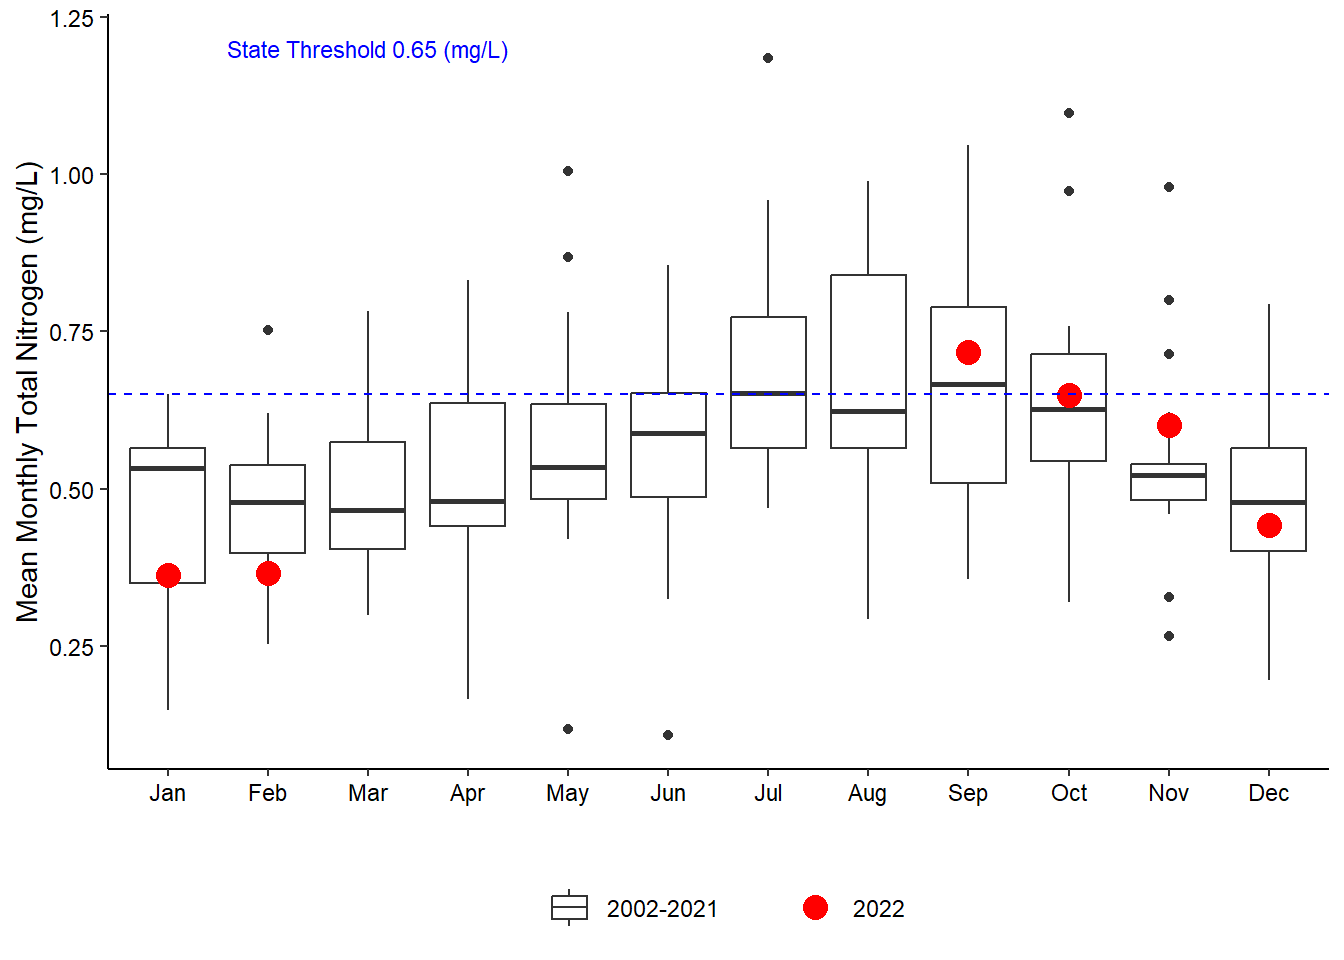
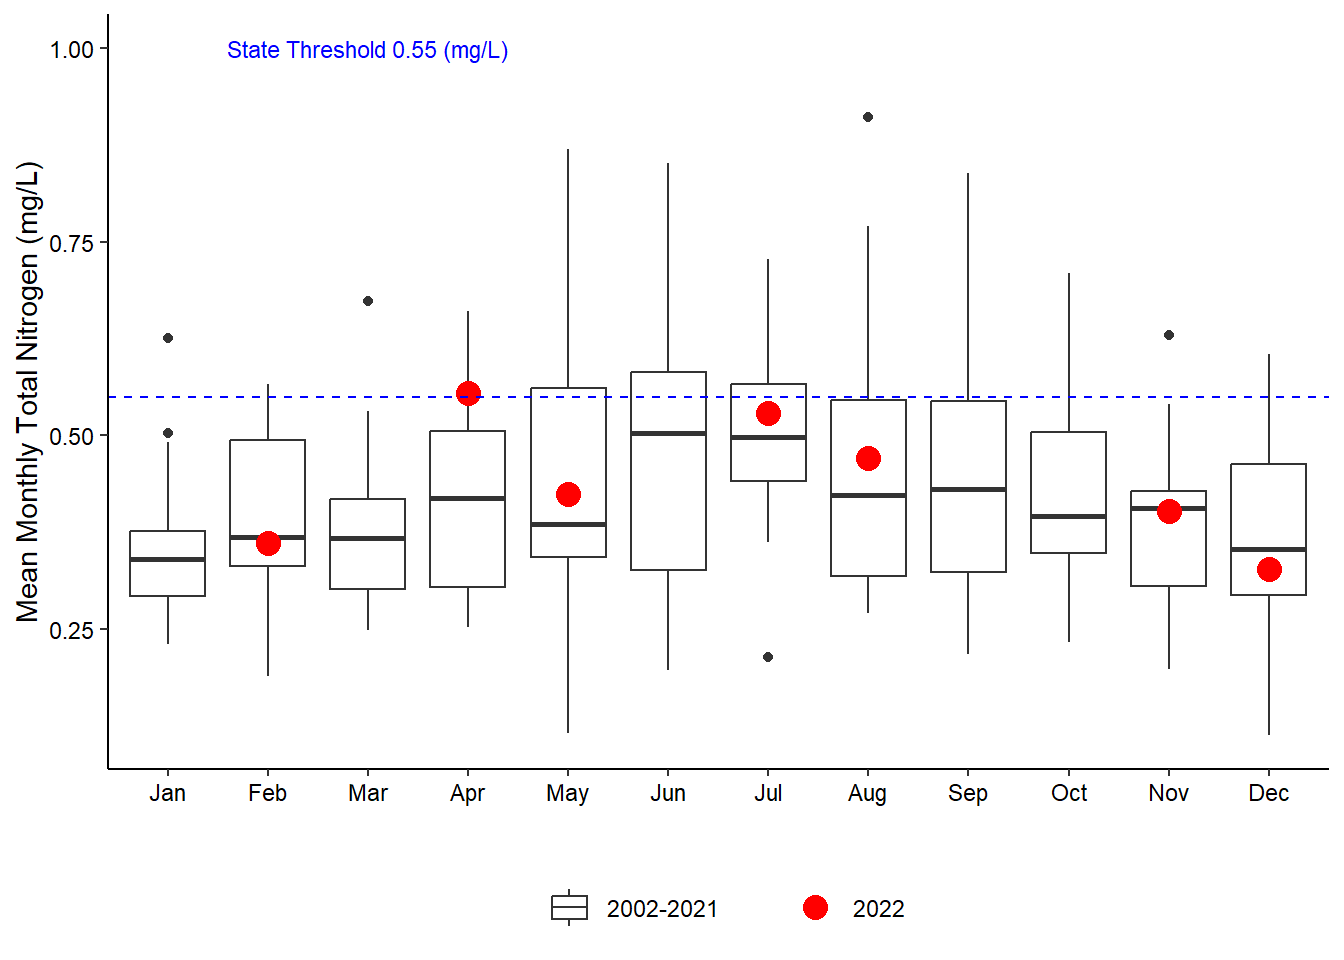
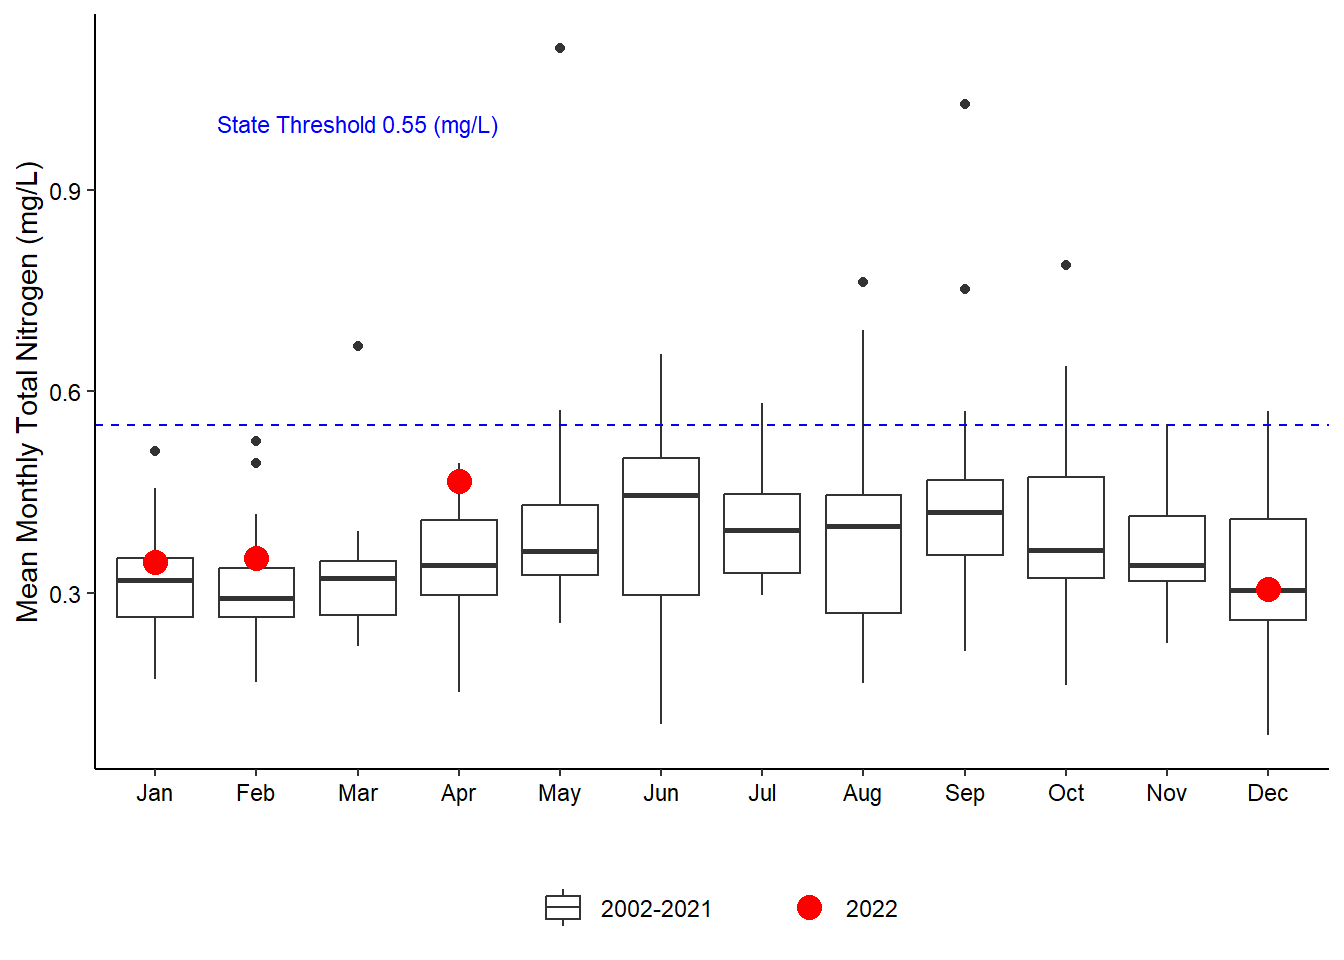
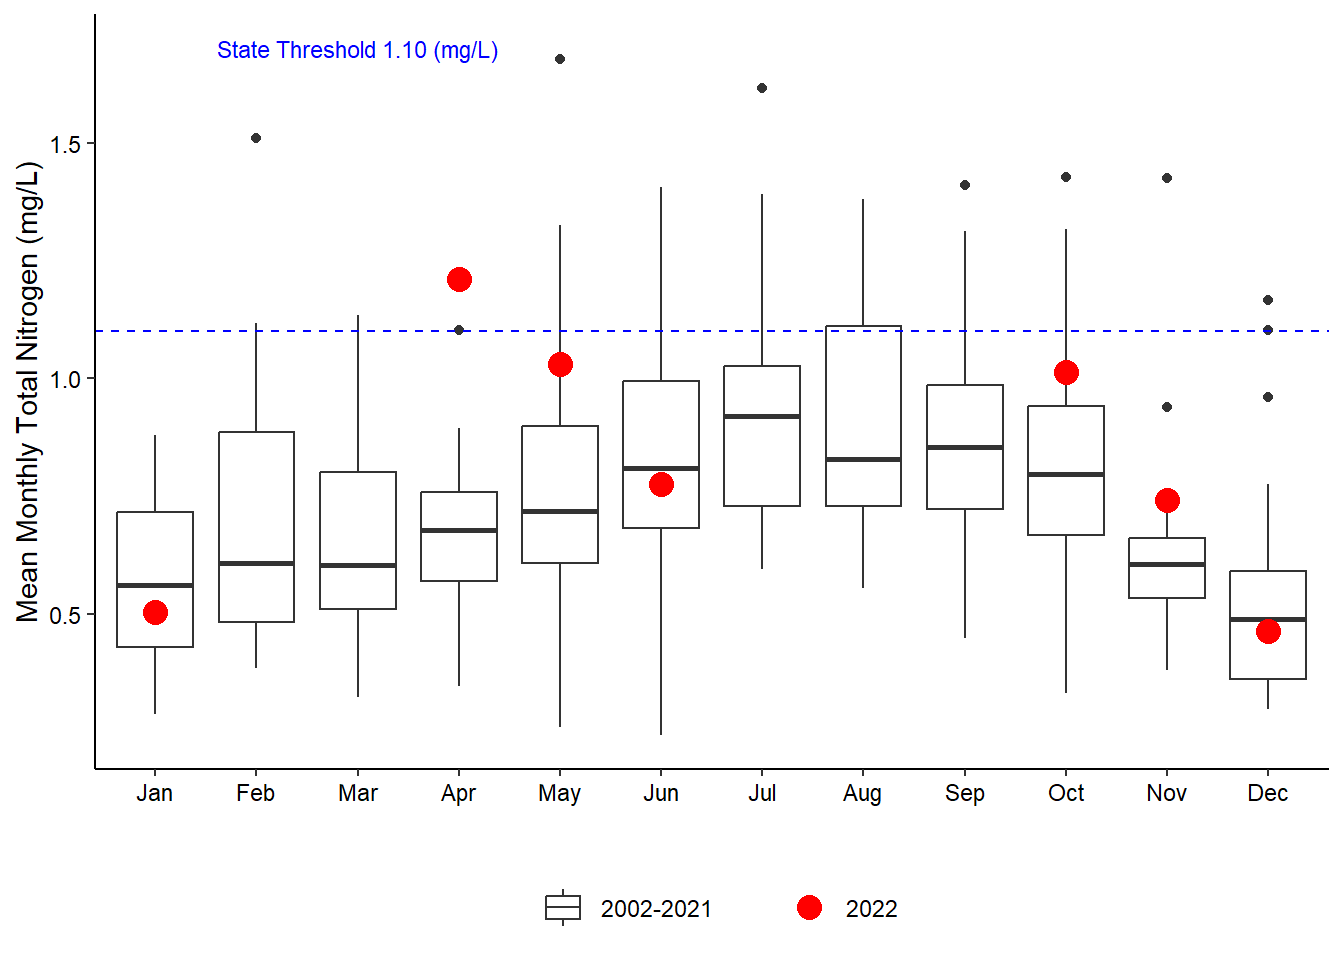
There was enough data in the last quarter of the year at Pine Island to show high TN values in September, which exceeded the threshold, though fell within normal ranges for that month (Figure 5.6 (a)). High TN in April at Pellicer Creek, coupled with the high chlorophyll a values in this same time, could be a consequence of the large rain the area experienced during March (Figure 4.1 (b); Figure 5.6 (d)).
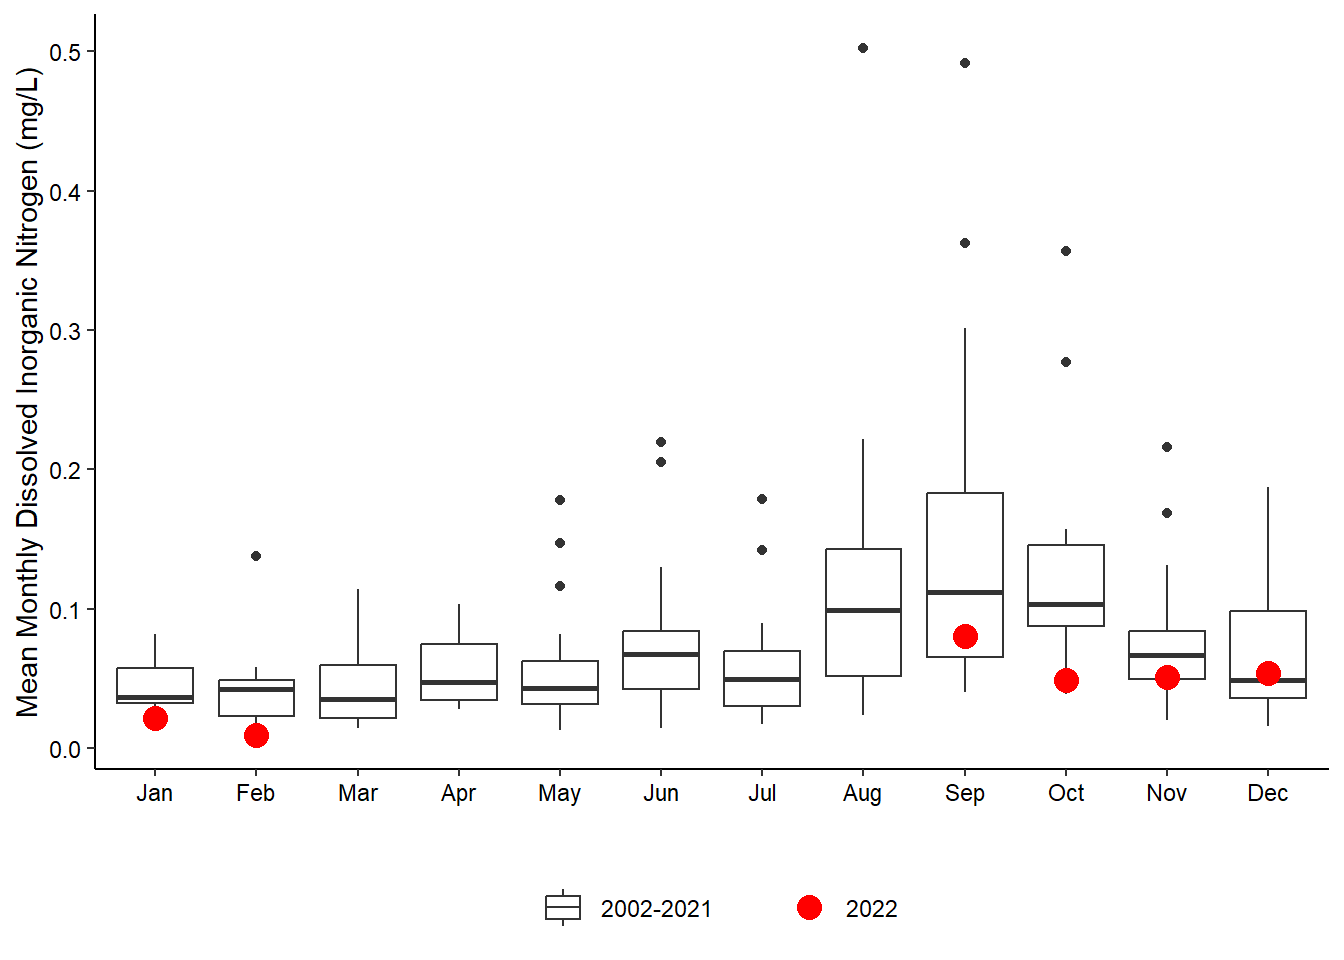
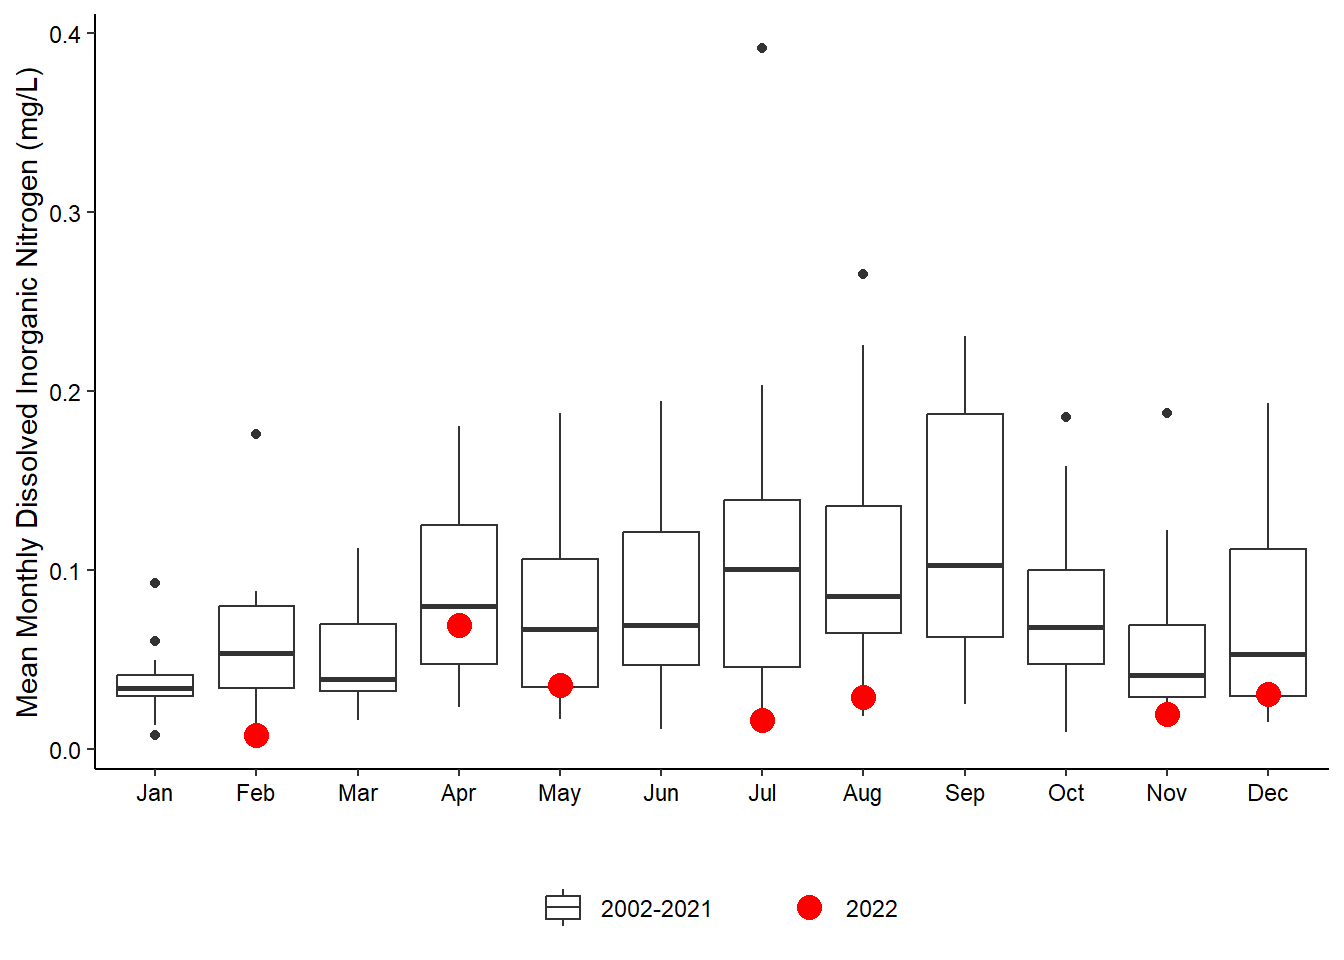
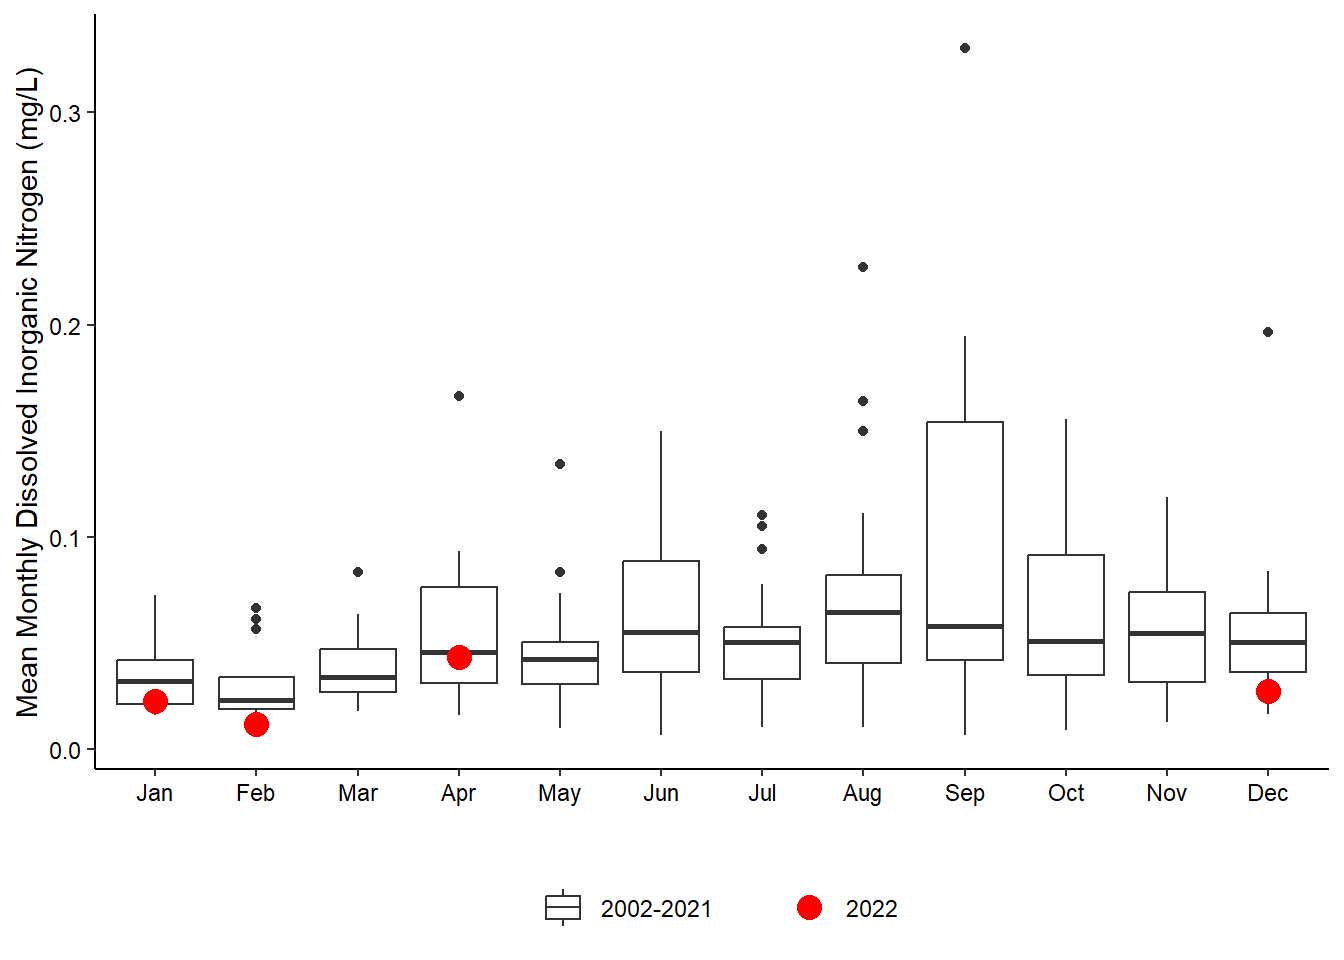
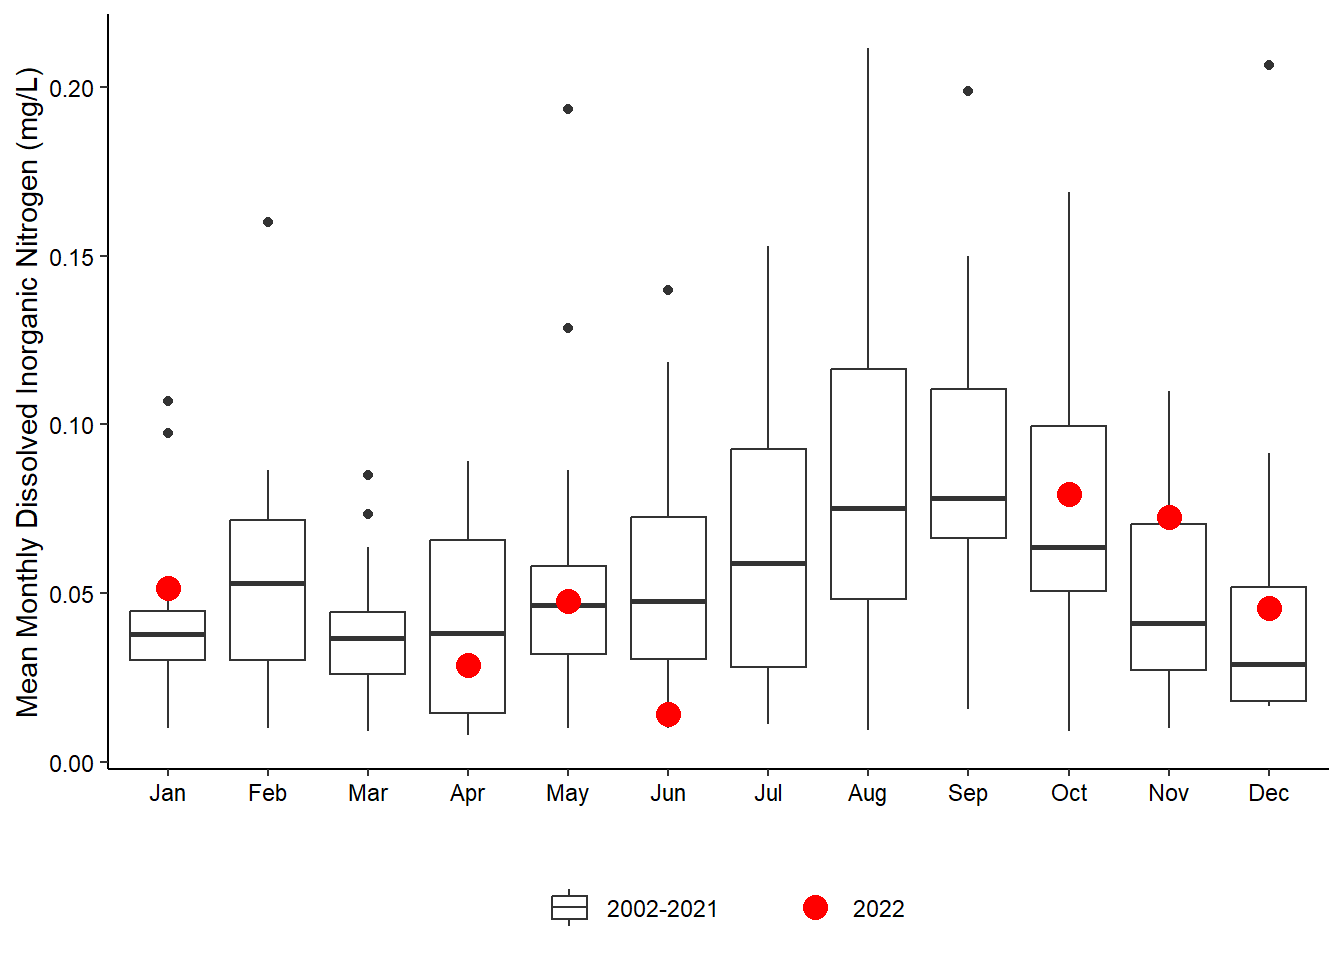
All DIN above detection limit were reported less than 0.1 (mg/L) at all sites for all months this year. The higher values appear to be in months following large rain events such as October at Pellicer Creek (Figure 5.7 (d)) and in April at San Sebastian (Figure 5.7 (b)) and Fort Matanzas (Figure 5.7 (c)).
5.3.1 Total Nitrogen
TN is a calculated value based on TKN and NO23.
This year, several of the NO23 values fell below the Florida Department of Environmental Protection Central Lab’s minimum detection limit and therefore TN was not able to be calculated and is missing for quite a few months at all the stations (Figure 5.6). This was especially true at Fort Matanzas which has the least amount of TN data (Figure 5.6 (c)).
5.3.2 Dissolved Inorganic Nitrogen
DIN is a calculated value based on NO23 and ammonia (NH4). Due to the low or undetectable levels of NO23, DIN is also missing quite a bit of information for this year (Figure 5.7).
5.3.3 Total Kjeldahl Nitrogen
TKN is the total concentration of organic nitrogen and ammonia. It is directly measured in our samples. Elevated levels of TKN were recorded in April at all sites (Figure 5.8). These elevated values continued through August at Pine Island (Figure 5.8 (a)). Pellicer Creek appears to have more variability in TKN month-to-month than the other stations (Figure 5.8 (d)).
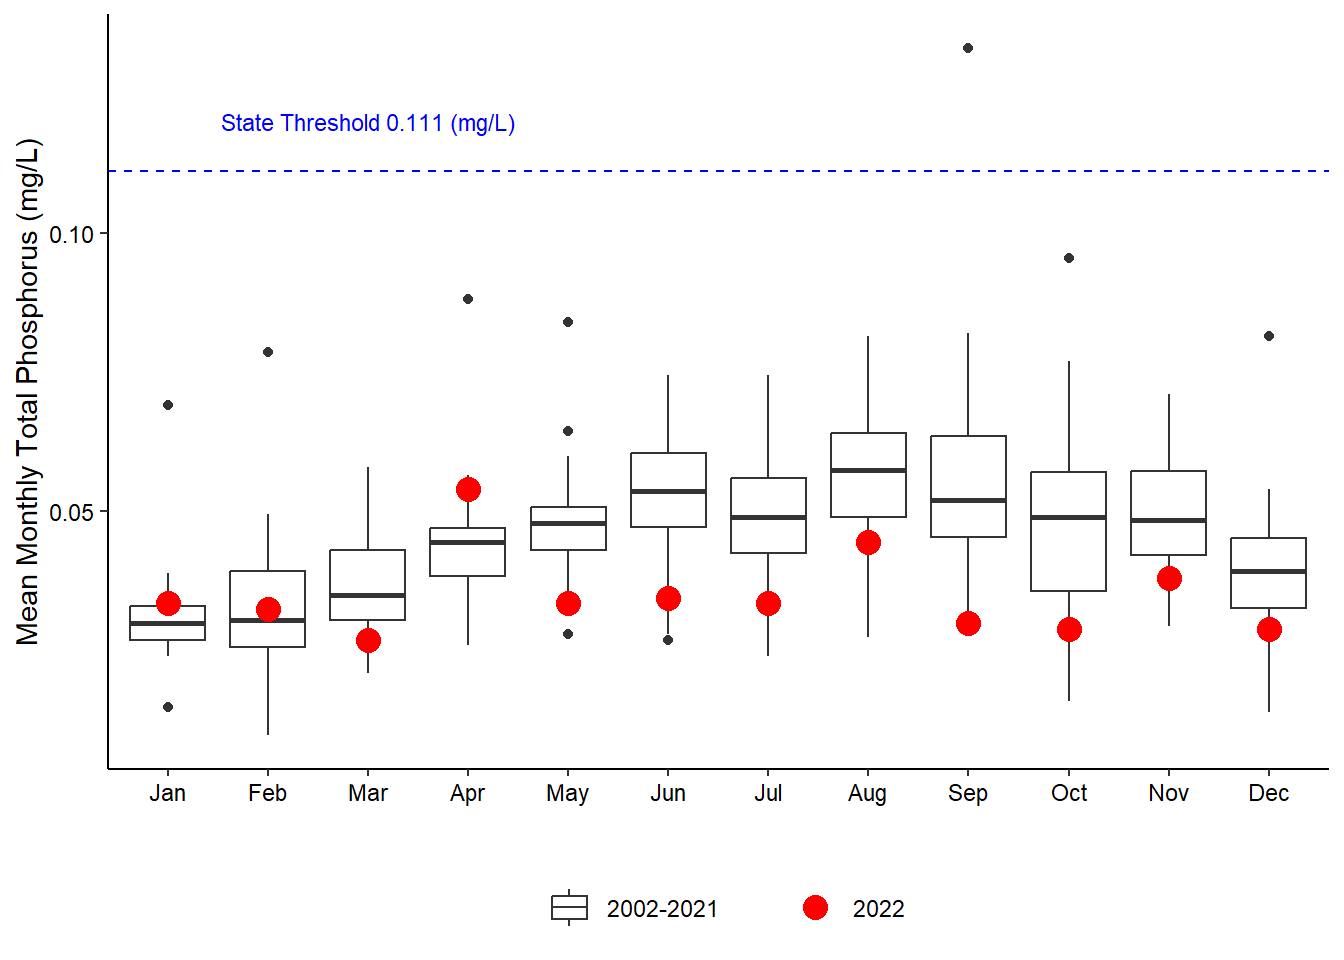
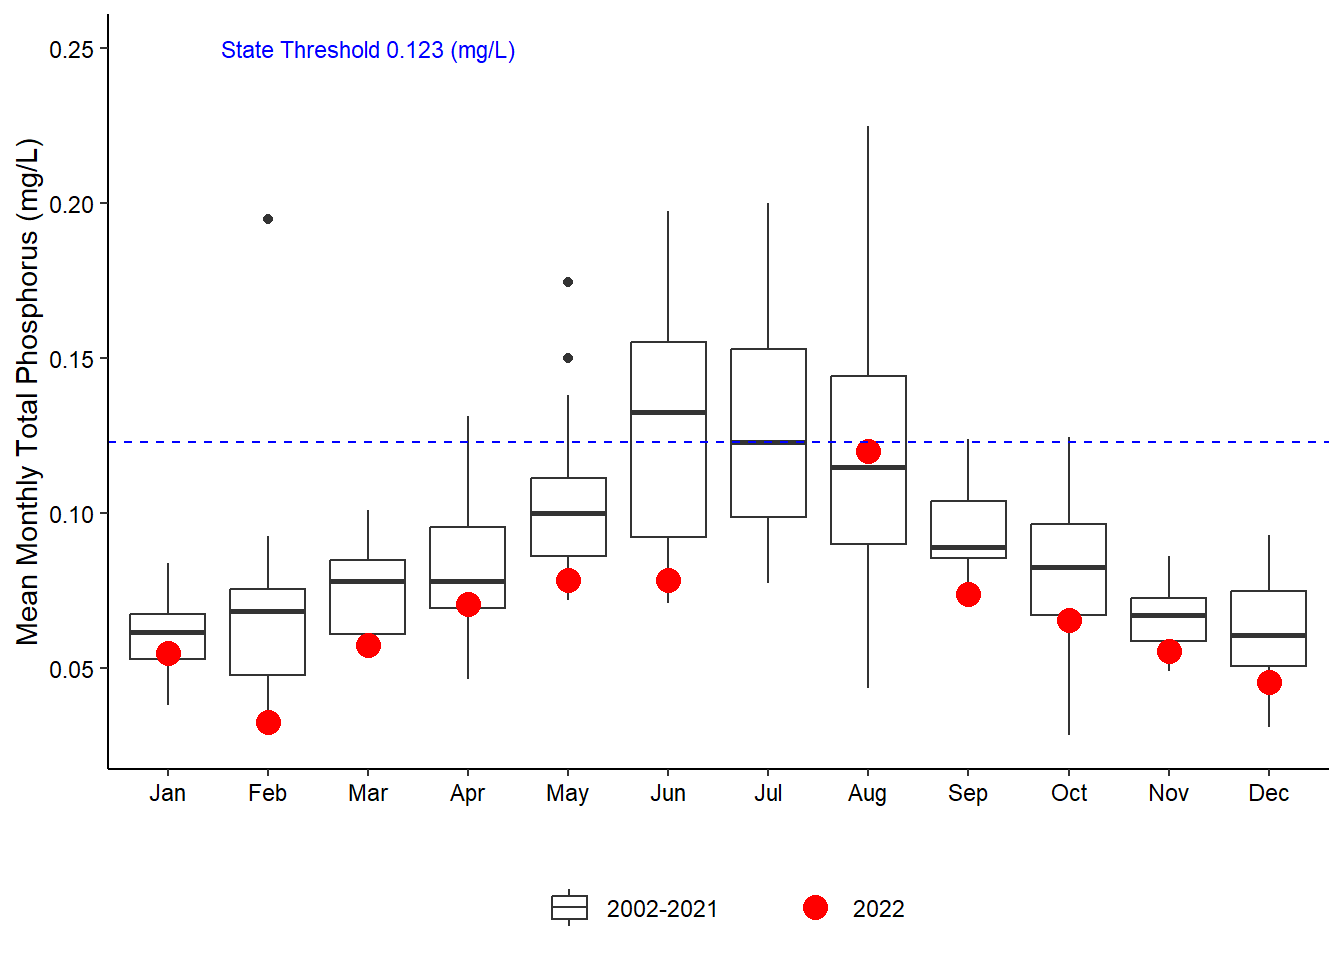
5.4 Phosphorus
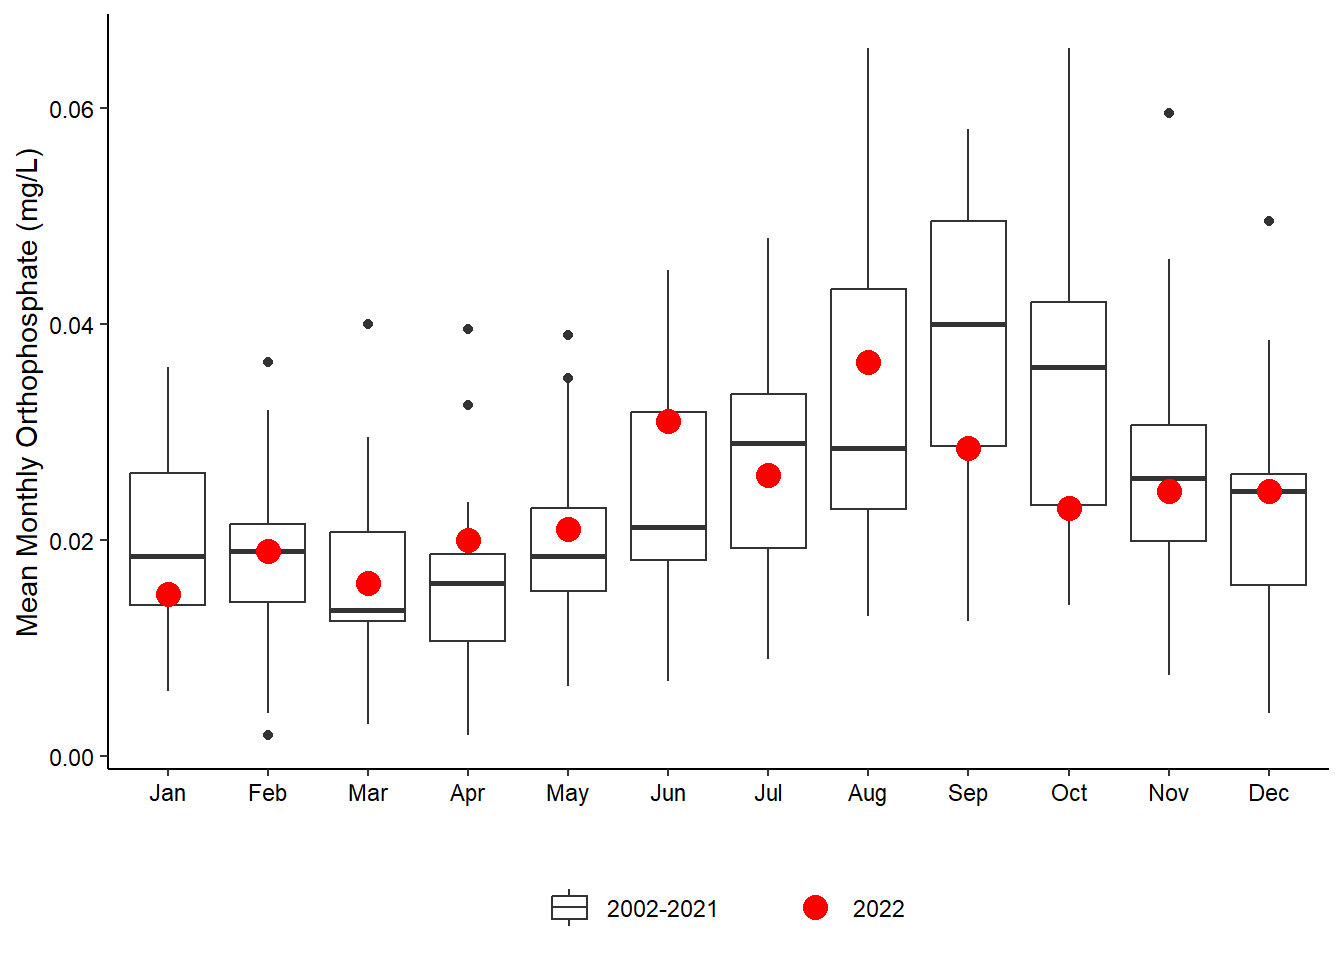
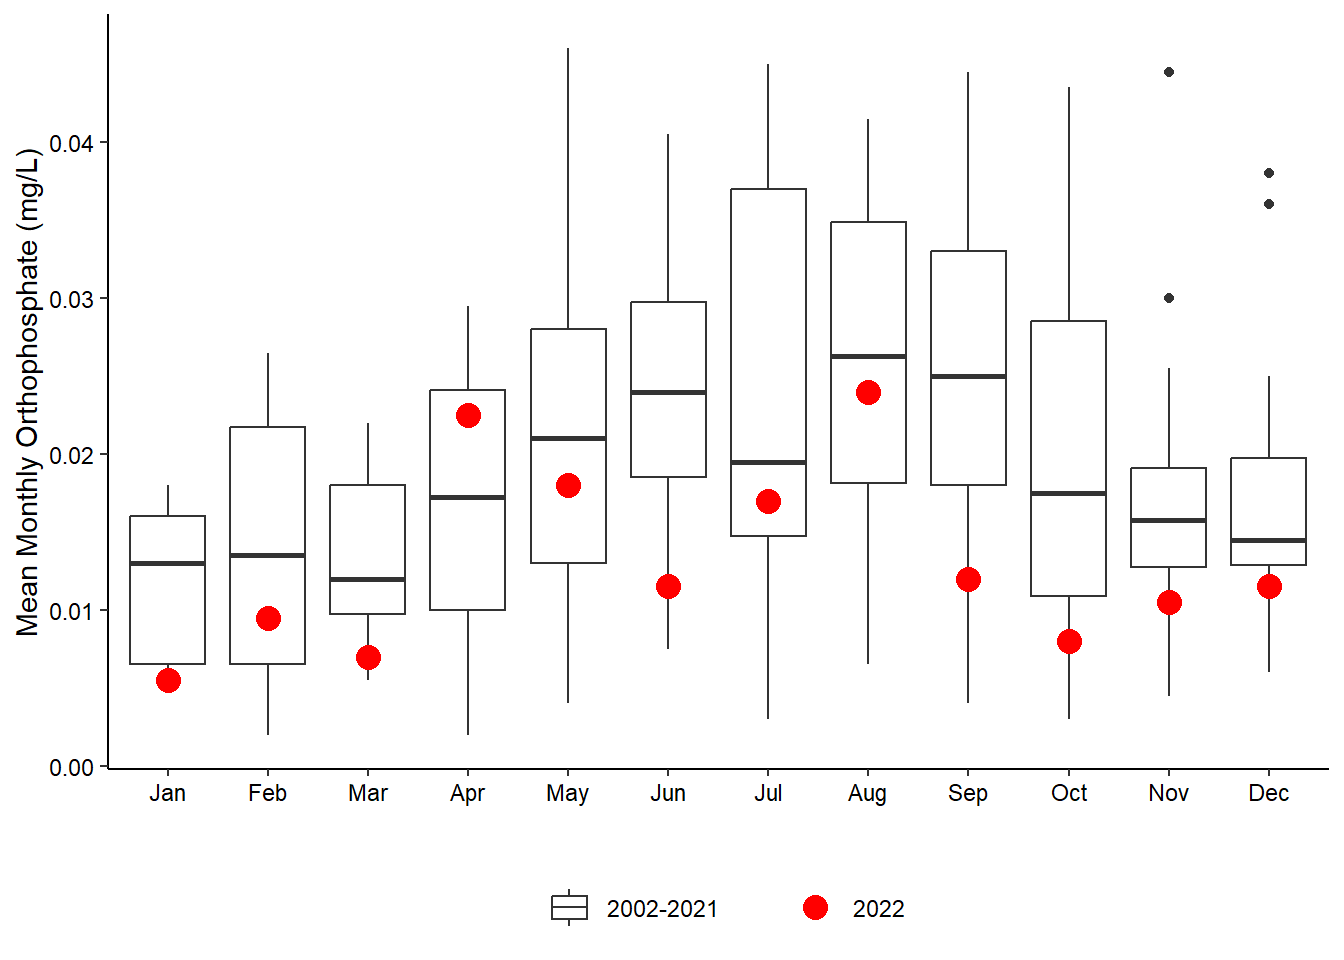
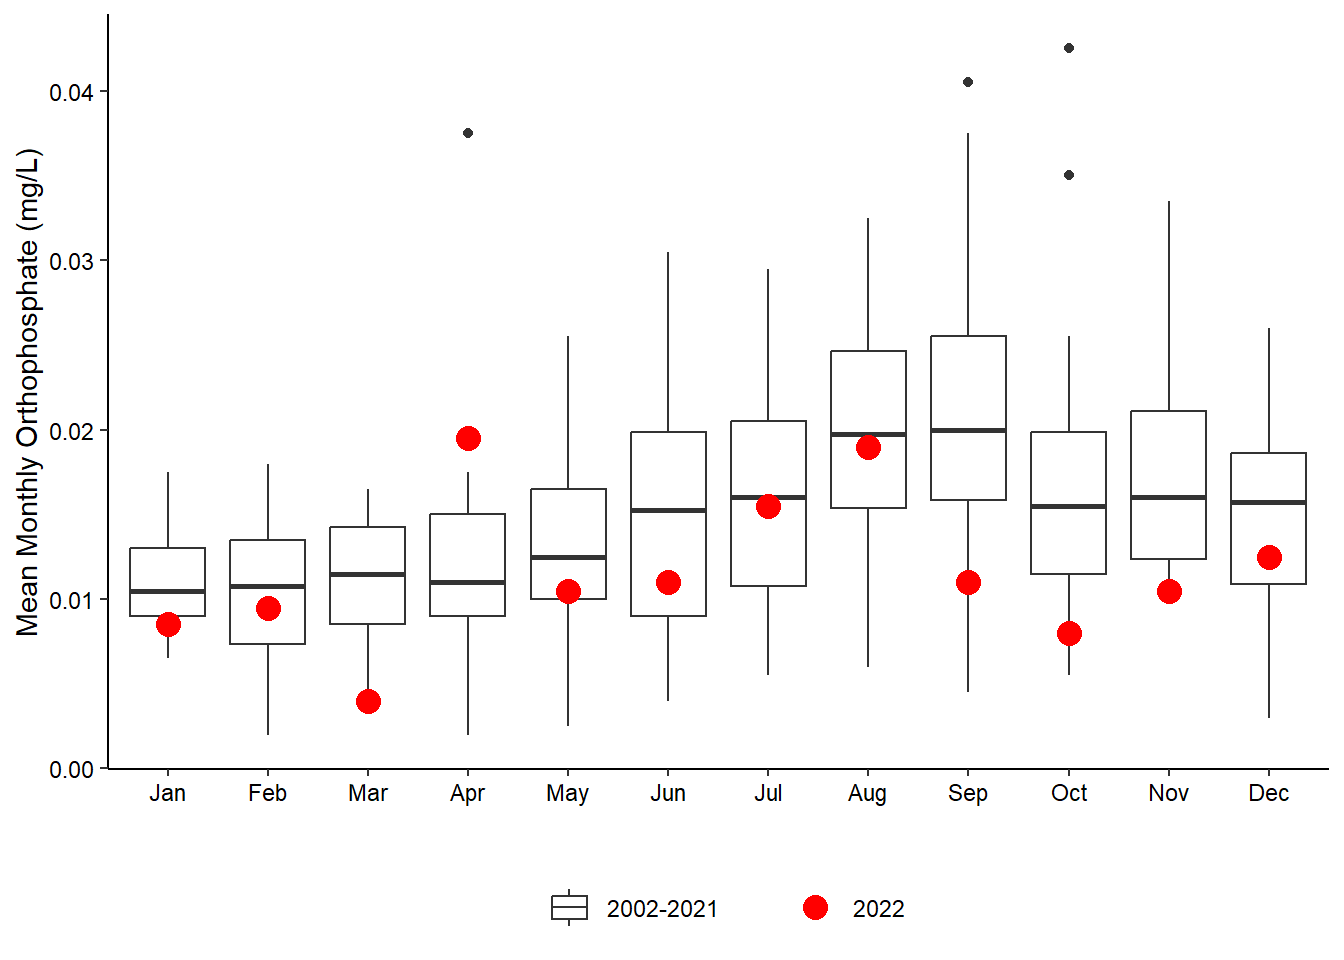
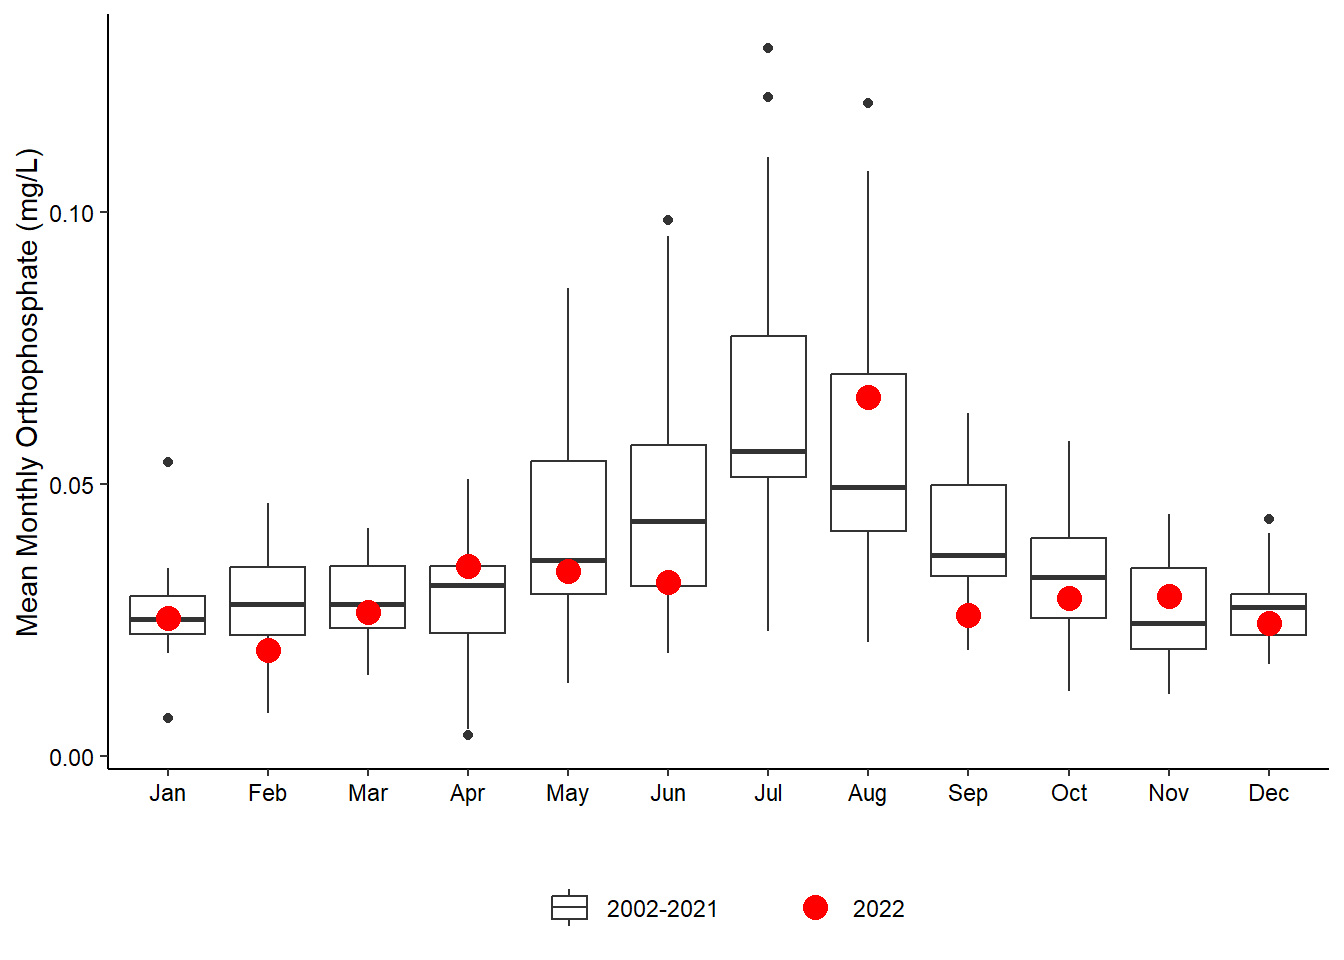
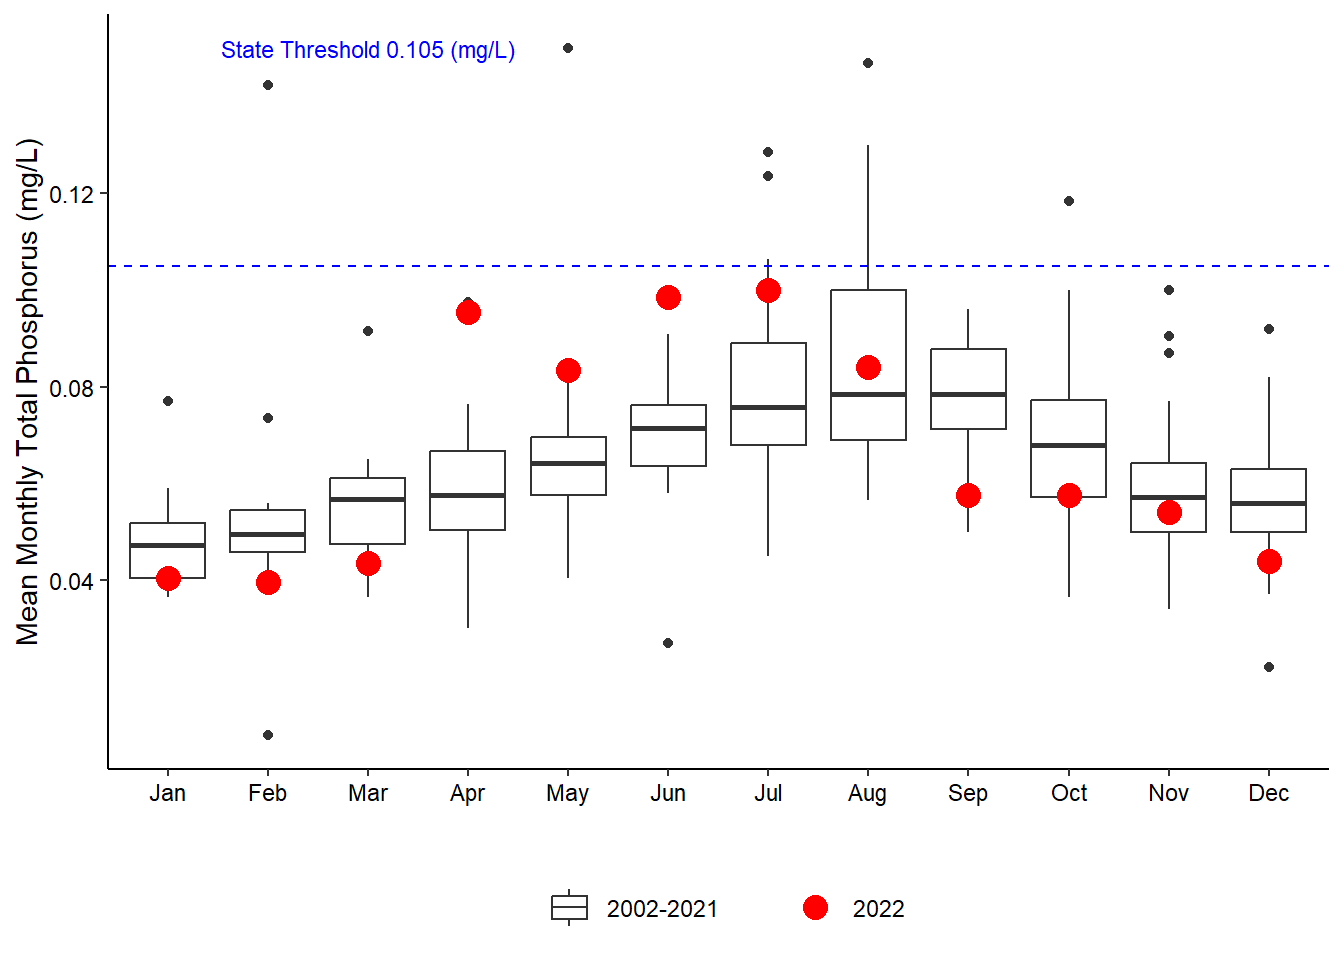
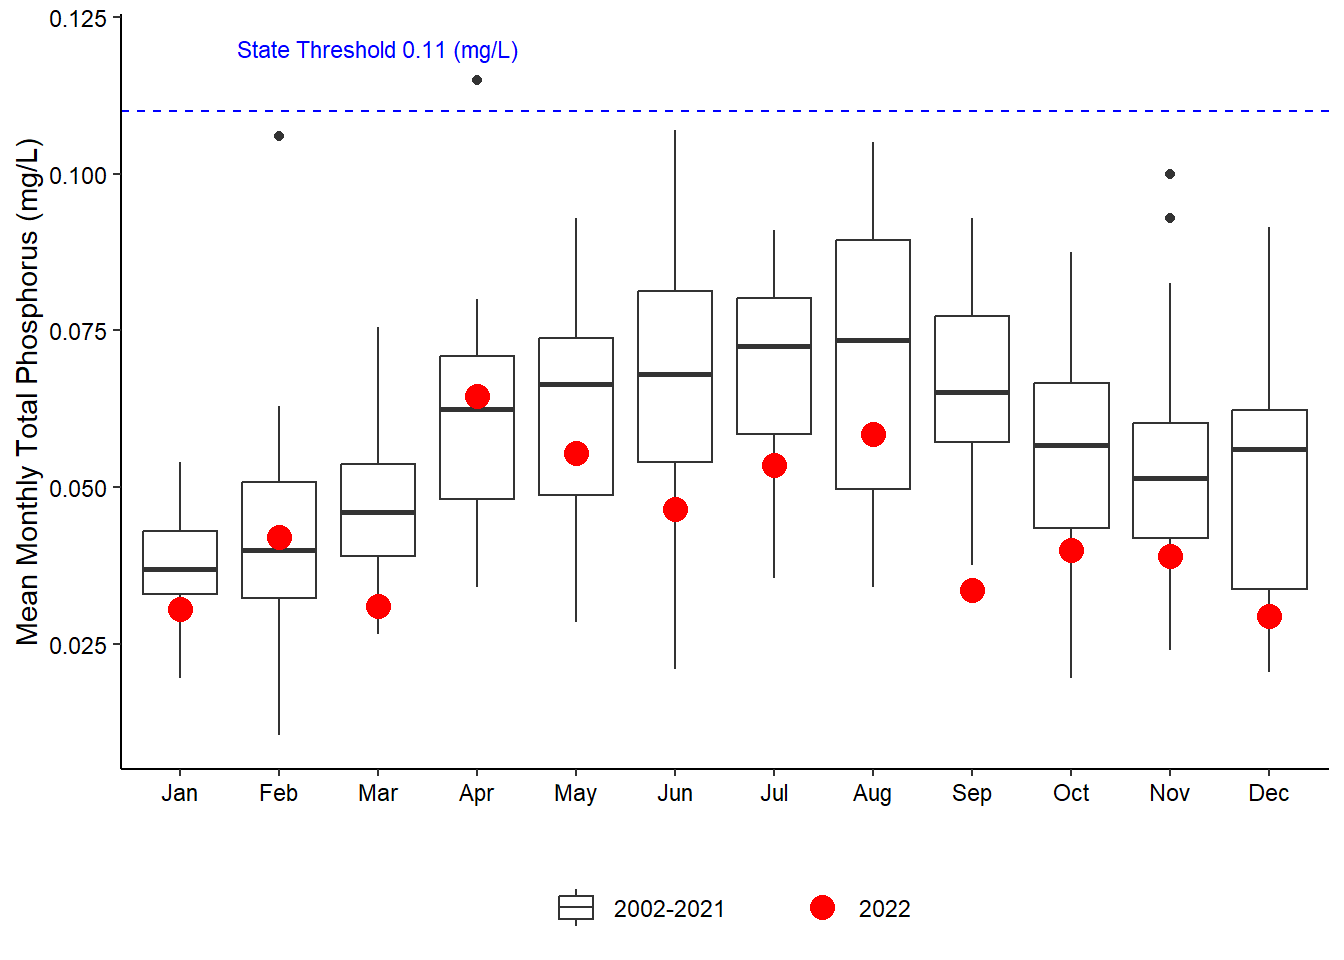
Total phosphorus continues to fall below the state threshold for every station (Figure 5.9). Though below the state threshold, Pine Island experienced elevated TP levels April-July (Figure 5.9 (a)). Total phosphorus levels were typically much lower than average at the remaining sites during that same time period. Pellicer Creek recorded an elevated TP level in August 2022, quite close to the state threshold value. Although higher than all the other values recorded in 2022, it remains in the average range for what is recorded for this month (Figure 5.9 (d)). In general, orthophosphate levels typically fell within the historical ranges at all sites and mirrored patterns observed in TP; however, elevated amounts were observed in April and August at all four stations (Figure 5.10).
5.4.1 Total Phosphorus
5.4.2 Orthophosphate