6 Other Indicators
6.1 Dissolved Organic Carbon
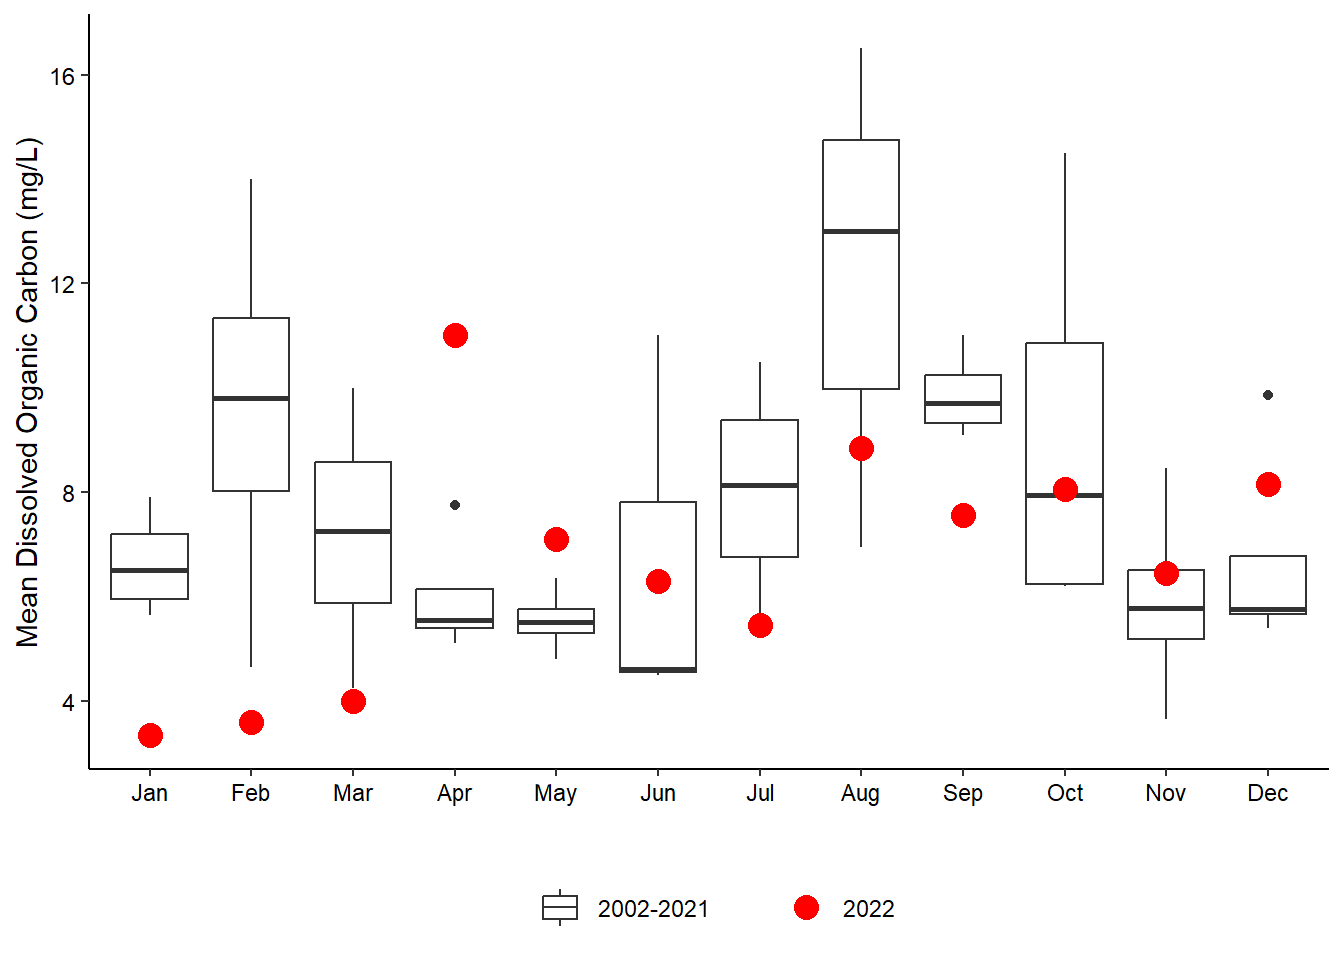
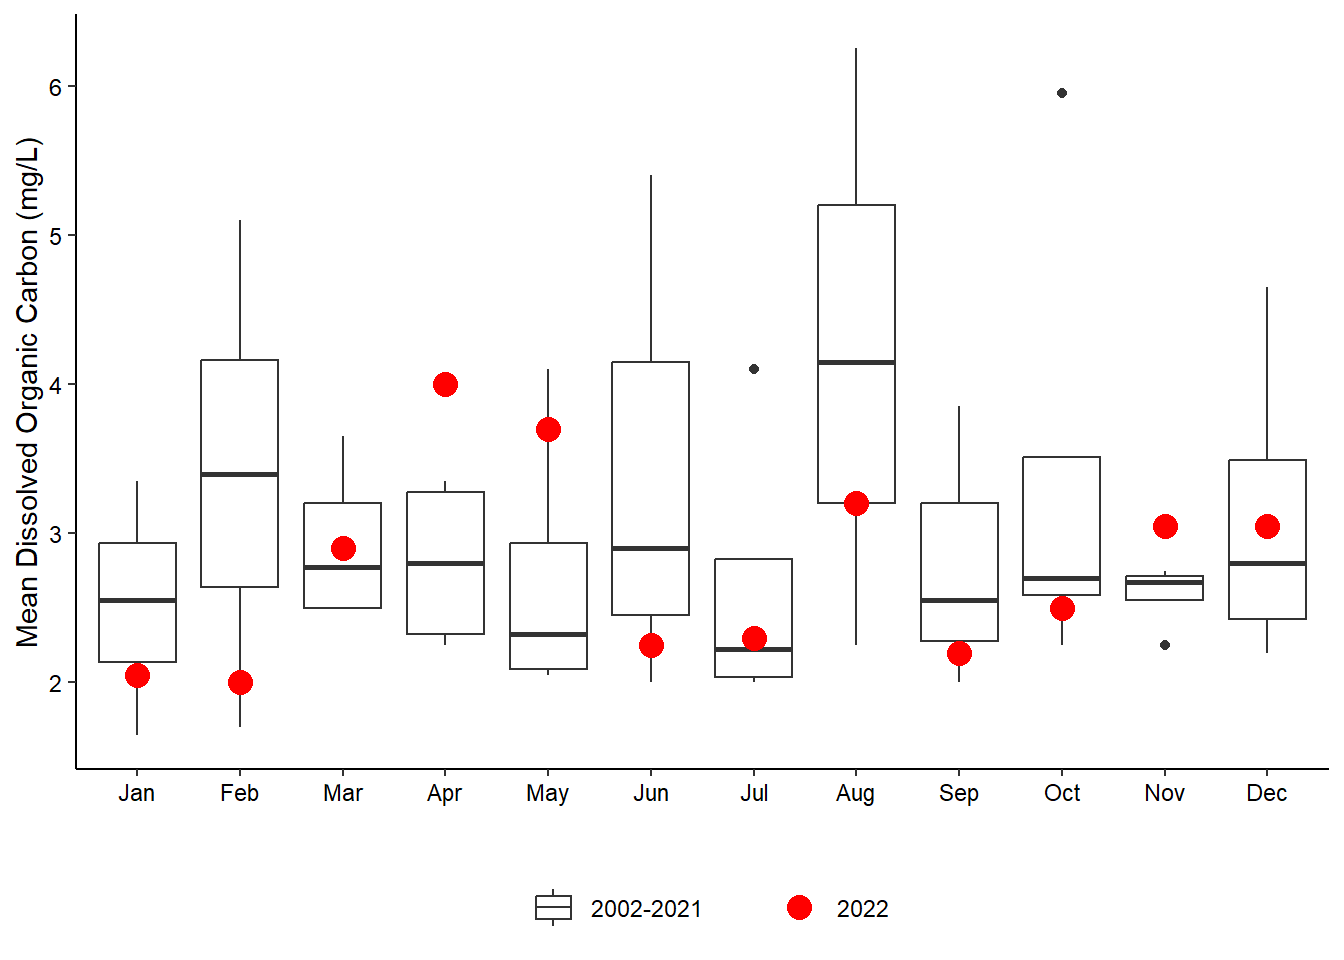
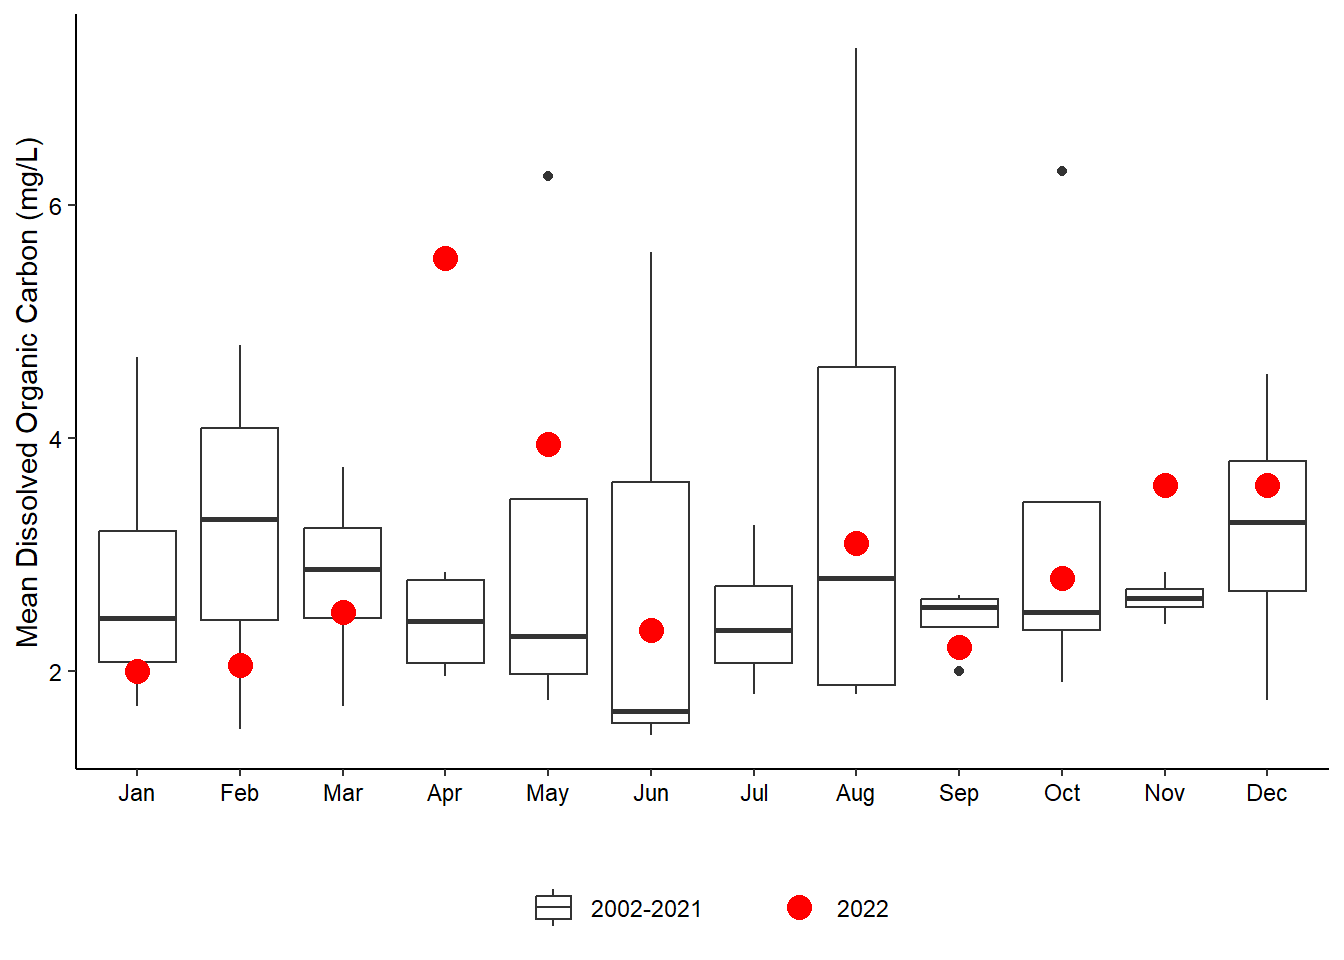
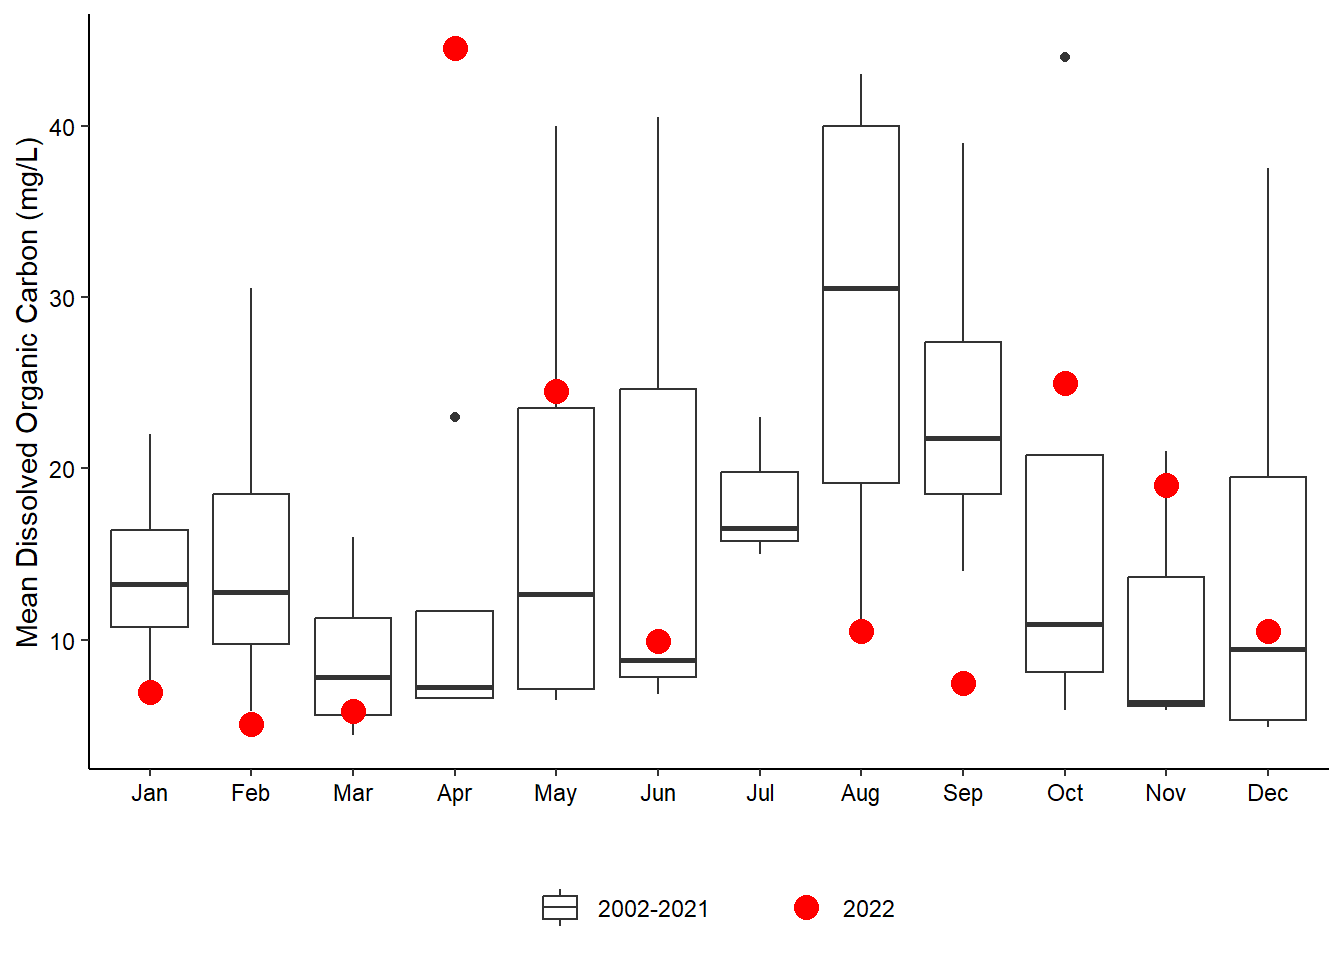
The highest values in dissolved organic carbon (DOC) are observed at Pellicer Creek, particularly in April of this year, which was the highest reported DOC in the entire SWMP dataset for all combined sites (44.5 mg/L) (Figure 6.1 (a)). Elevated DOC levels in April were not unique to Pellicer Creek, as this was a pattern in all the sites (Figure 6.1). Values dropped in each subsequent month until August, where they rose again. They were then further elevated in October after the passage of Hurricane Ian.
6.2 Bacteria
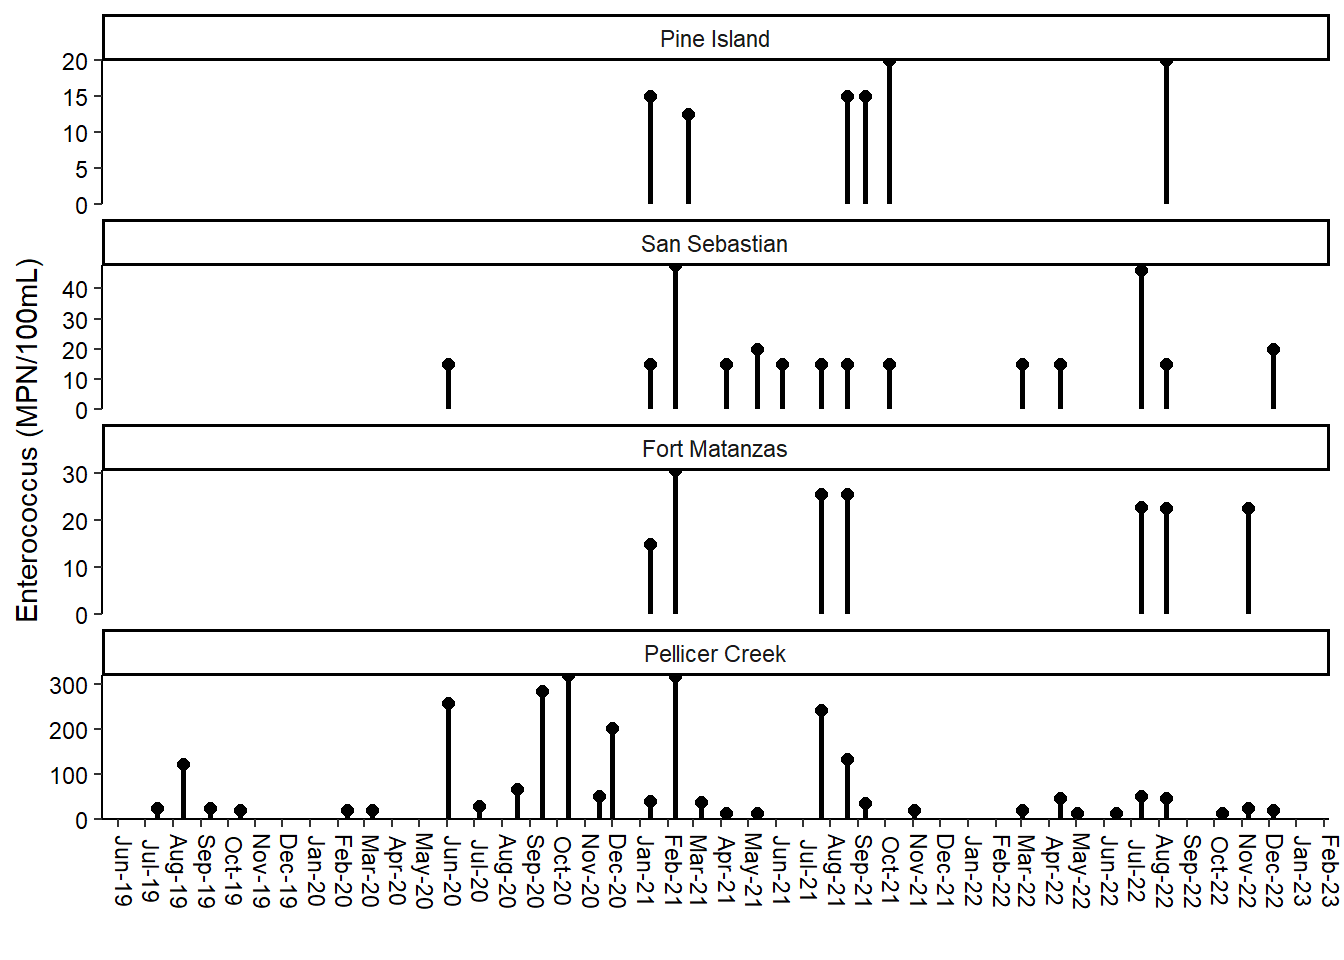
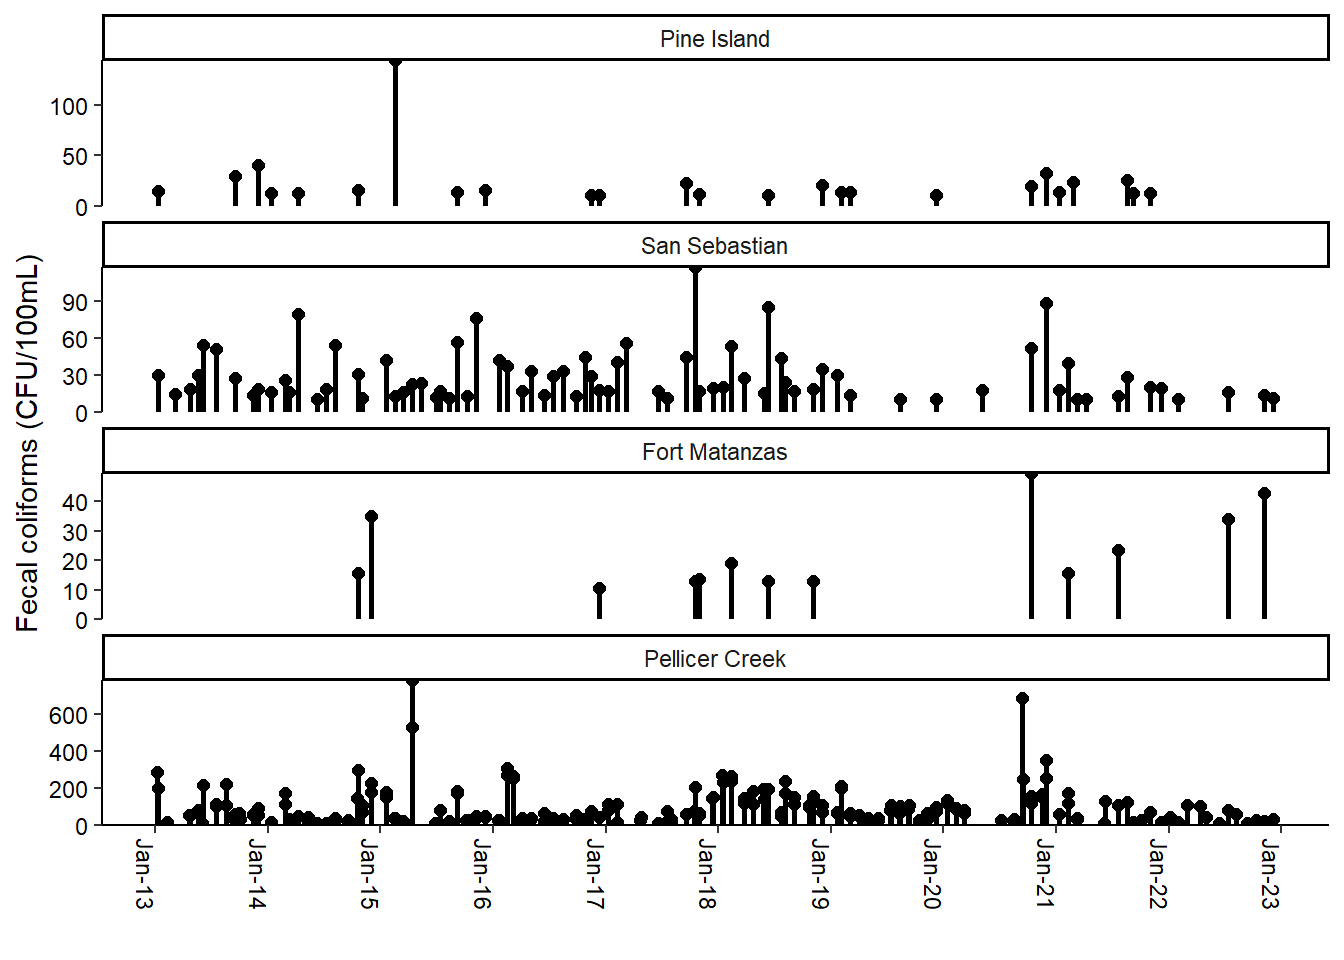
The SWMP program began analyzing water samples at each SWMP station for fecal coliform bacteria in 2013. In 2019, collections for Enterococcus bacteria began and both are now collected at all four sites. Due to overnight shipping requirements, all bacteria samples are qualified by the DEP laboratory as out of hold times. For proper analyses, hold times for these samples are not to exceed 7 hours from collection. Therefore, the SWMP program uses this data to show general patterns and trends only.
Bacteria is detected in water samples from Pellicer Creek more often and in higher quantities than the other three stations (Figure 6.2 (a); Figure 6.2 (b)). Fecal coliforms are also often detected at San Sebastian (Figure 6.2 (b)).