7 Hurricane Ian
Hurricane Ian (Figure 7.1) made landfall near Cayo Costa in southwestern Florida at 3:05pm EDT on Wednesday, September 28, 2022 as a Category 4 storm. It then made it’s way across the Florida peninsula to Cape Canaveral while downgrading to a Tropical Storm, before hitting the Atlantic Ocean in the early evening of Thursday, September 29, 2022 where it then strengthened to a Category 1 storm and headed towards the South Carolina coast. It made landfall south of Georgetown, South Carolina as a Category 1 storm the afternoon of Friday, September 30, 2022.
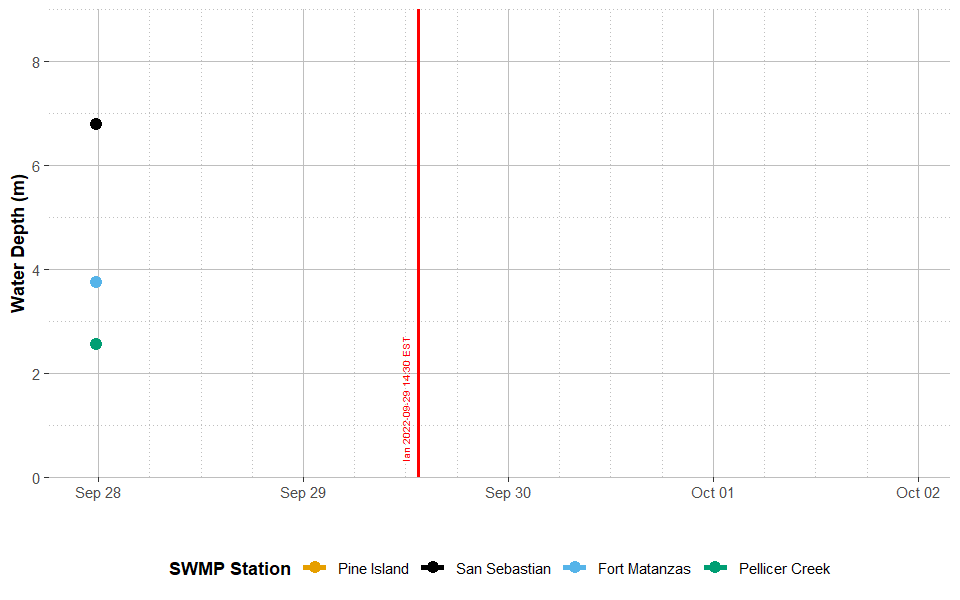
The effects of Hurricane Ian were observable at the GTM Research Reserve in northeast Florida starting Wednesday, September 28, 2022 with the onset of northeasterly winds and rising tides. The storm was closest to the GTM Research Reserve at 2:30 pm EST as determined by the lowest barometric pressure recorded at the weather station in Pellicer Creek (1001 mb).
7.1 Onset of winds
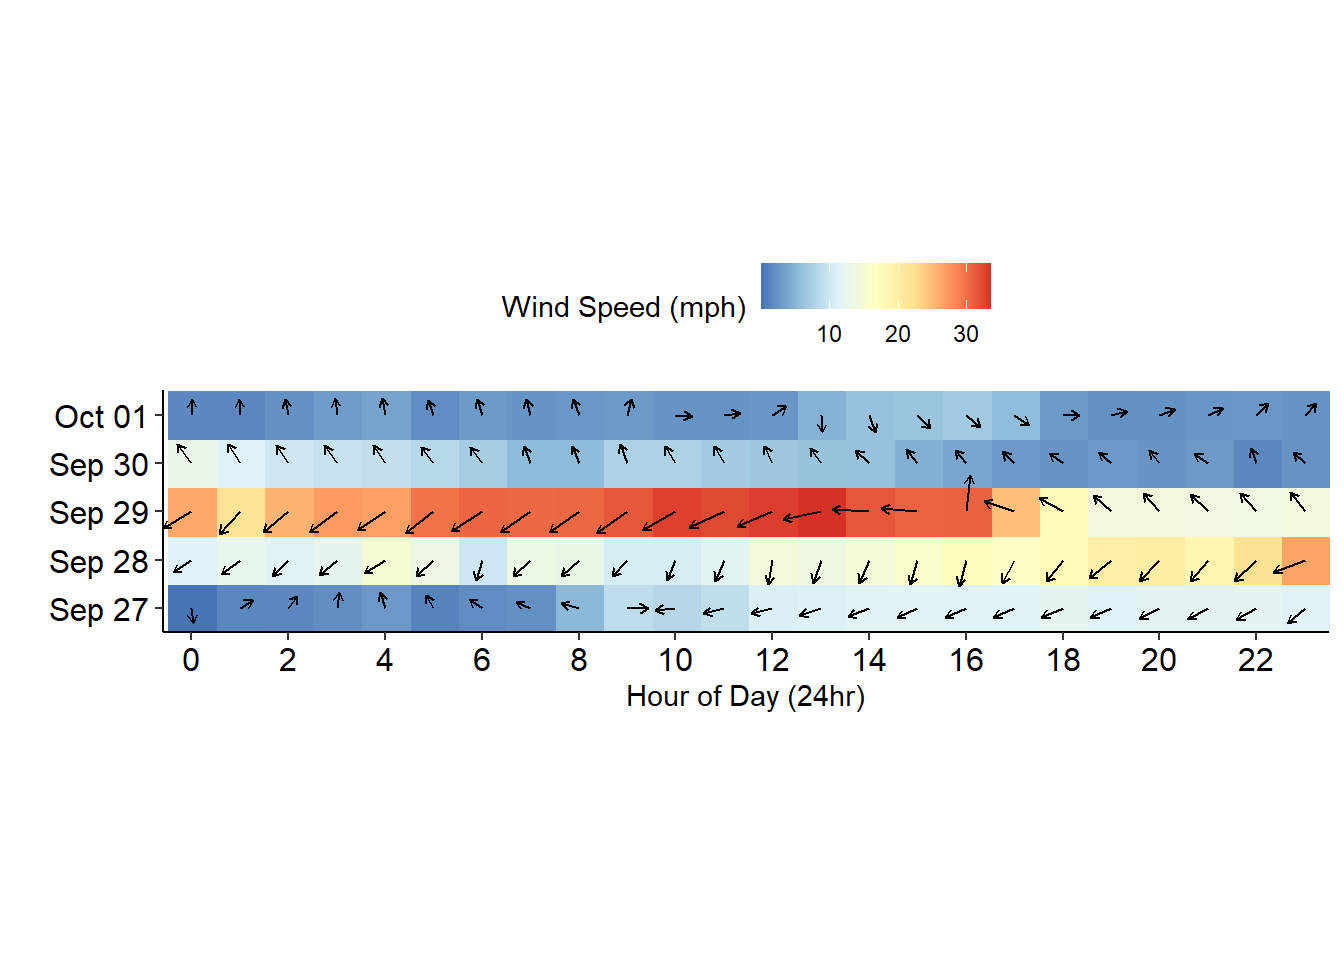
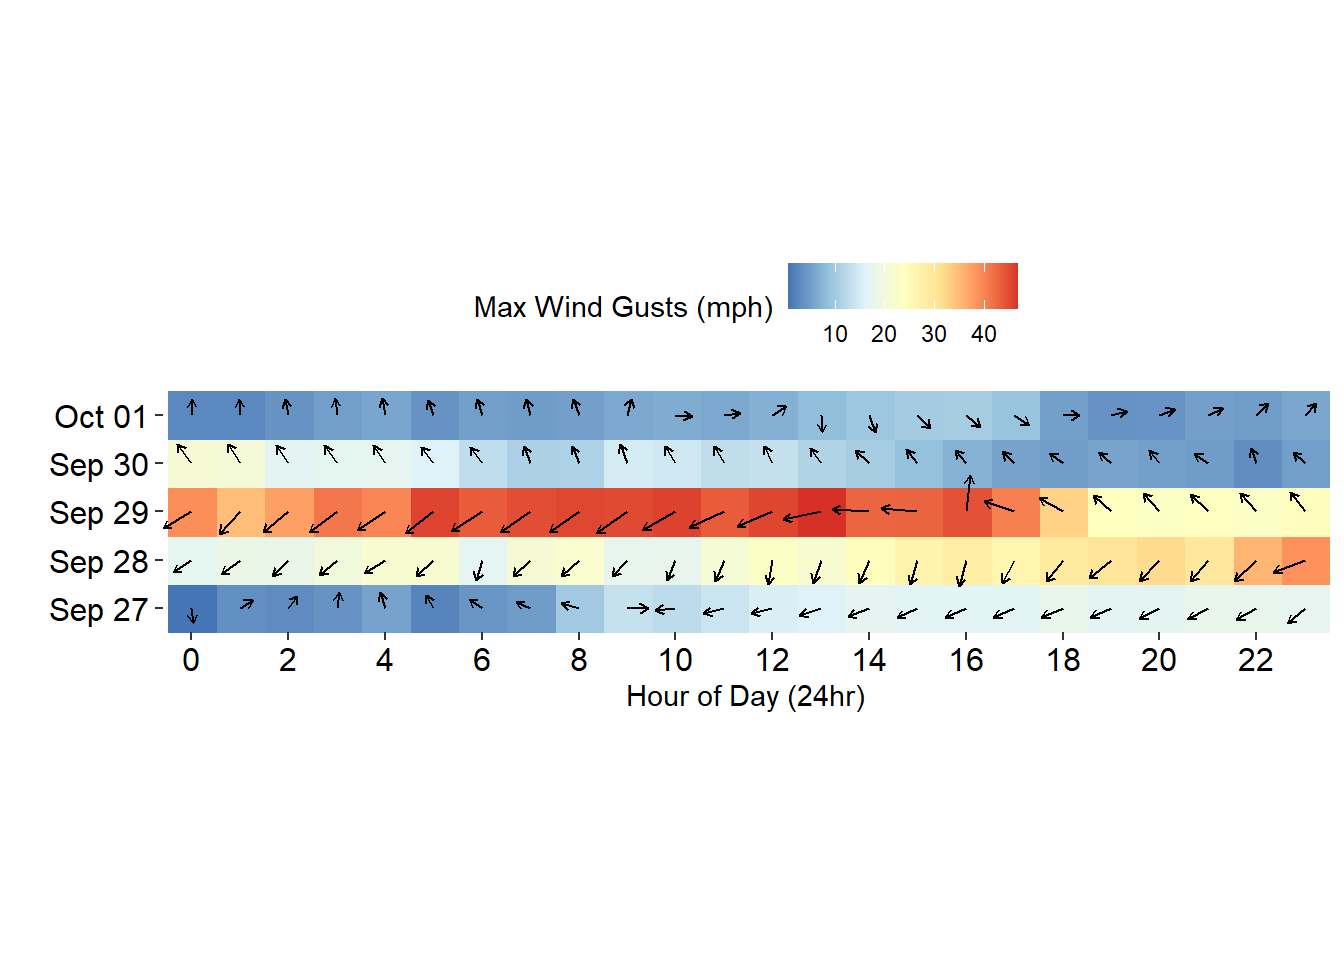
The winds picked up in northeast Florida the morning of Wednesday, September 28, 2022 from the northeast direction. News reports of the region experiencing a Nor’easter began on September 28th and the weather station in Pellicer Creek supports the onset of predominating northeasterly winds midday on Tuesday, September 27th that extended until after the storm went off the coast the evening of Thursday, September 29th (Figure 7.2). The station experienced sustained winds in excess of 30 mph from 5 am until almost 5 pm on Thursday, September 29th when the storm moved offshore (Figure 7.2 (a)). Maximum gusts during this same period of time were greater than 45 mph with the greatest gusts recorded at 48 mph (Figure 7.2 (b)).
7.2 Rising tides
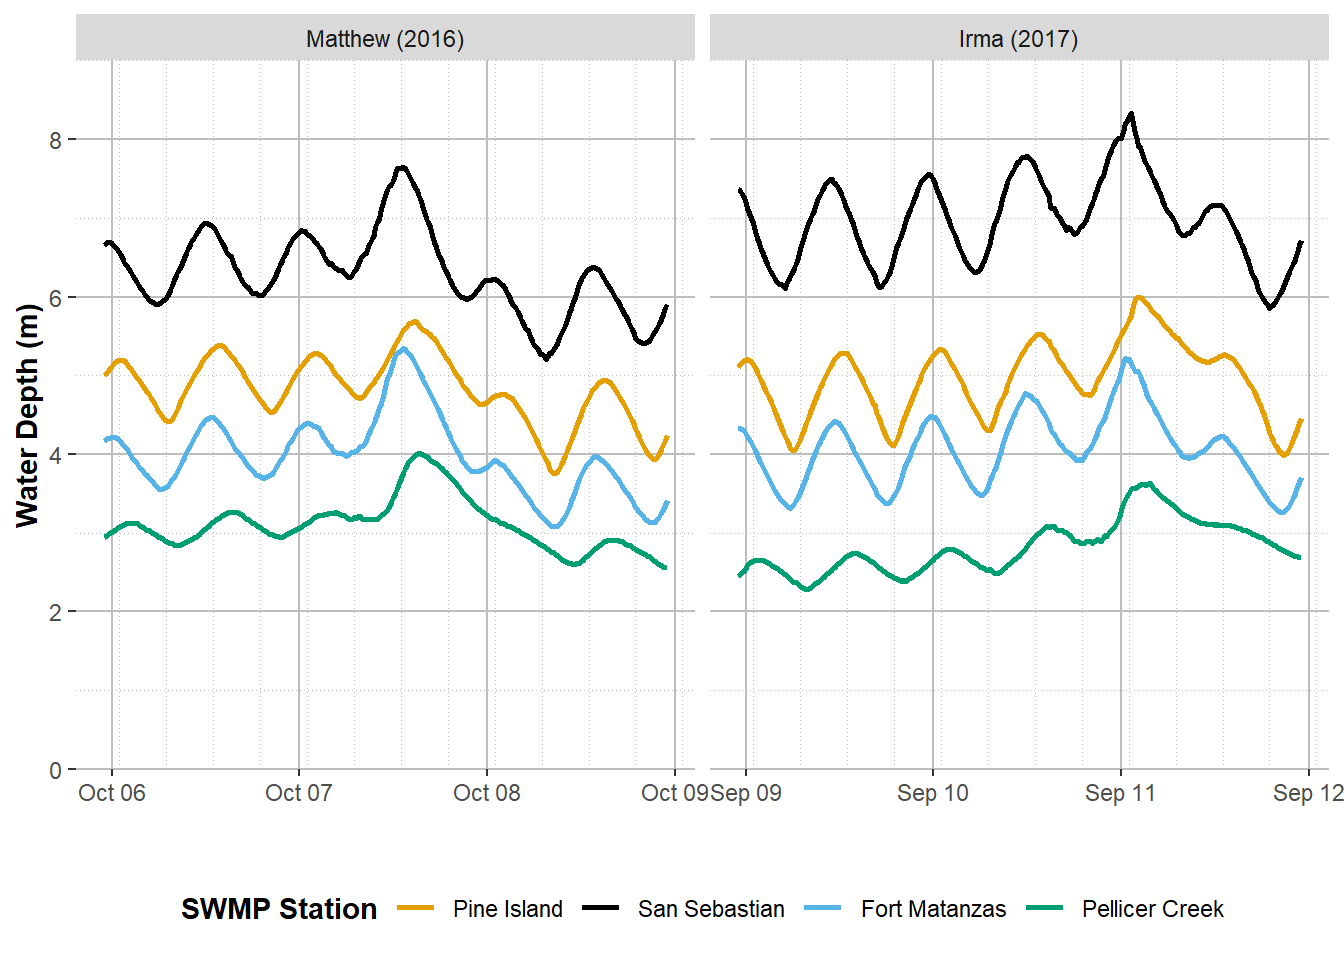
Water levels began to rise in the St. Augustine area Wednesday, September 28, 2022. Unlike storms Matthew and Irma in the past (Figure 7.3), there was no observable singular storm surge event that occurred with Hurricane Ian, but increasing water levels over several tidal cycles (Figure 7.4). It took three tide cycles until maximum water levels were reached when the storm was closest to the reserve. For most stations, the amount of water at the incoming tide was close to double what was receding at the outgoing tide. The greatest increase in water depth was observed in Pellicer Creek where there was an overall gain of 1.31 m (4.3ft) in the creek. After the storm’s passing, the water levels quickly dropped with each falling tide over the next two days (Figure 7.4).
Warning
Unfortunately, due to suspected sensor drift on an aging data sonde and the depth reading at post deployment differing from depth offset for calibrations, the depth data for Pine Island was marked suspect during quarterly review between 09/27/2022 12:30 pm EST and 09/30/2022 11:45 pm EST. For more information on the depth issues, see Chapter 9.
7.3 Heavy rainfall
All the rainfall during the storm occurred within two days Wednesday, September 28 and Thursday September 29, 2022. After the storm passed into the Atlantic Ocean the night of September 29, there was an abrupt stop of all precipitation and the system did not get any more rain until more than two weeks later on October 17, 2022. There was a total of 238mm (9.37in) of rain within those two days, the majority of which (67.5%) was on Thursday, September 29, 2022. (All information based on data collected at the weather station in Pellicer Creek).
7.4 A loaded freshwater system
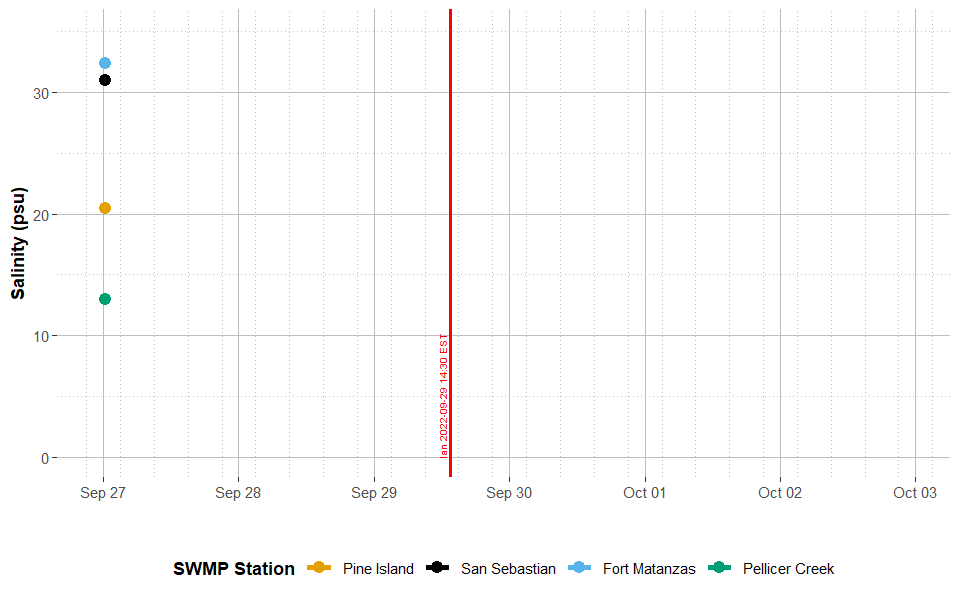
Between the increasing water levels before the storm and the heavy rainfall with it, the salinity at all the water quality stations was quite variable (Figure 7.5). For the two stations furthest away from the inlets (Pine Island and Pellicer Creek), salinity started to increase with each tidal cycle starting on Wednesday, September 28th, 2022. The predominating northeasterly winds along the northeast Florida coast at this time largely fought falling tides, trapping more salty, ocean waters within the estuary.
All sites experienced drops in salinity as the storm passed, but the greatest effect was in Pellicer Creek where salinity dropped to 0 psu (fresh water) for four days before any observable rise in salinity was observed by the station. Quite a bit of freshwater movement and draining from the watershed is observable at the other three stations in the days after the storm (Figure 7.5). Large changes (peaks and drops) in salinity at Fort Matanzas is most likely due to the influence of Pellicer Creek, the largest freshwater source to the Matanzas Estuary, as well as the proximity of this site to the Matanzas Inlet (4 km north). The Pine Island station appeared to have increased in salinity with the storm and then fell back to pre-storm levels within a day and a half after the storm’s passing.
7.5 Recovery
A large note to make when investigating recovery time frames is that not long after the passing of the hurricane, northeast Florida experienced seasonal “king tide” events, which regularly occur in the fall months (primarily October) and lead to higher than high tides. This effect largely impacts the ability to fully assess the “recovery” of the system after the hurricane. However, observing potential recovery within two weeks after the storm revealed that many sites did return to pre-storm values or ranges (Table 7.1).
Dissolved oxygen at many stations increased with the storm and remained high for several days following the storm. Preceding the storm, much of the estuary was experiencing lower values of dissolved oxygen. The storm appeared to have reoxygenated the waterways, though both Fort Matanzas and San Sebastian experienced a drop in the day after the storm, which then climbed back up to pre-storm levels within a few days. For Pine Island, the dissolved oxygen remained high after the storm and hasn’t fallen back to pre-storm patterns.
Although pre-storm salinity values were reached not long after the storm passed at San Sebastian and Fort Matanzas, the tidal range of salinity did not resume pre-storm patterns until over a week had passed after the storm. This was likely largely driven by the excess freshwater in the estuary.
| Station | Salinity | Dissolved Oxygen | Depth |
|---|---|---|---|
| Pine Island | 1 | NA | 1 |
| San Sebastian | 11 | 6 | 1 |
| Fort Matanzas | 12 | 4 | 1 |
| Pellicer Creek | 12 | 10 | 13 |