5 Nutrient Indicators
The state thresholds used in chlorophyll a, total nitrogen, and total phosphorus visualizations come from Chapters 62-302 (Surface Water Quality Standards) and 62-303 (Identification of Impaired Surface Waters) of the Florida Administrative Code (F. A. C.).
By visiting Florida Rules
5.1 Summary
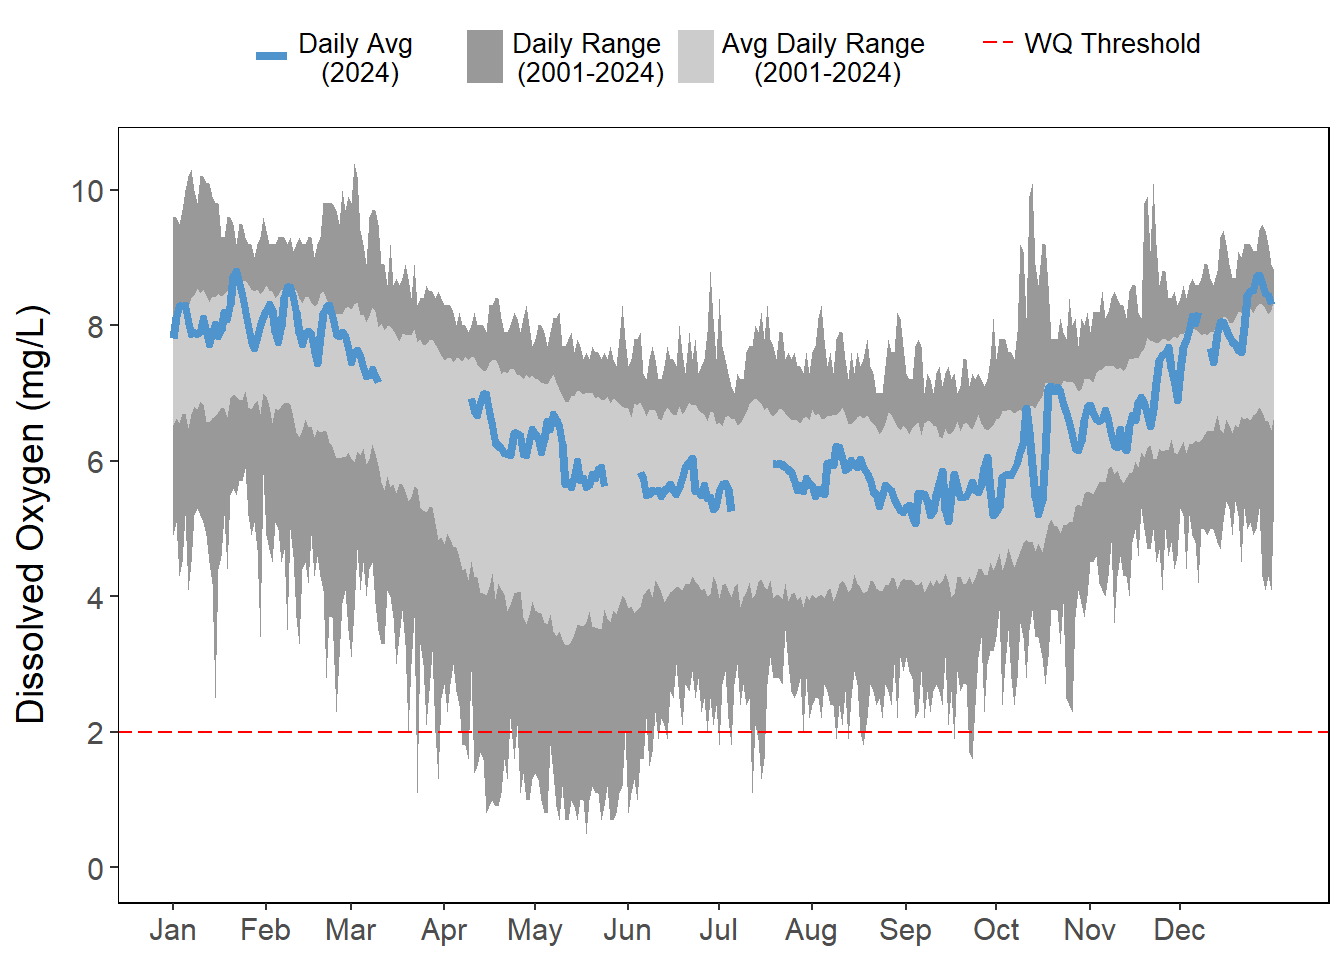
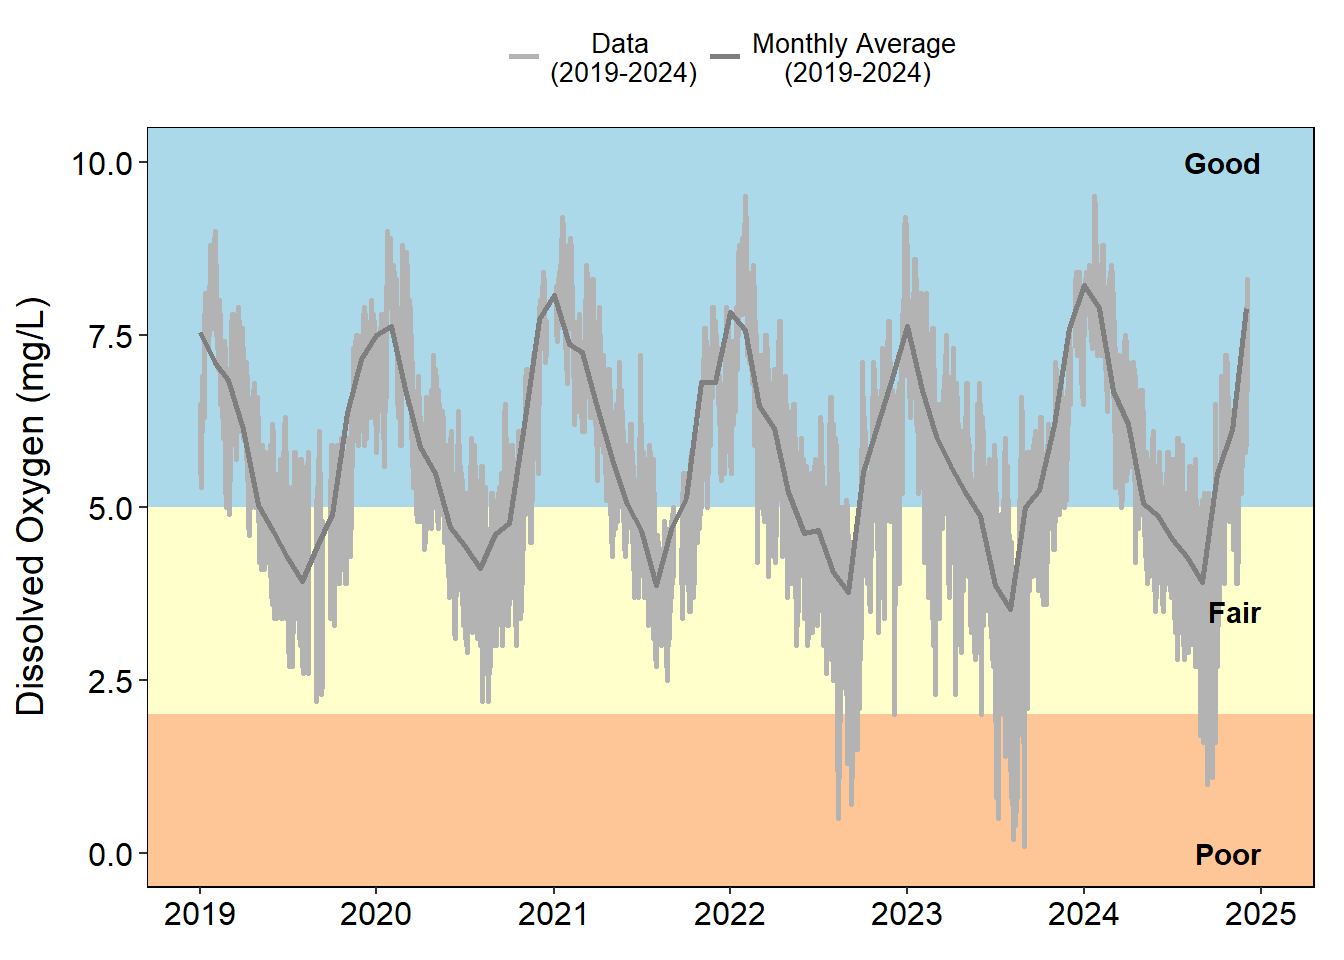
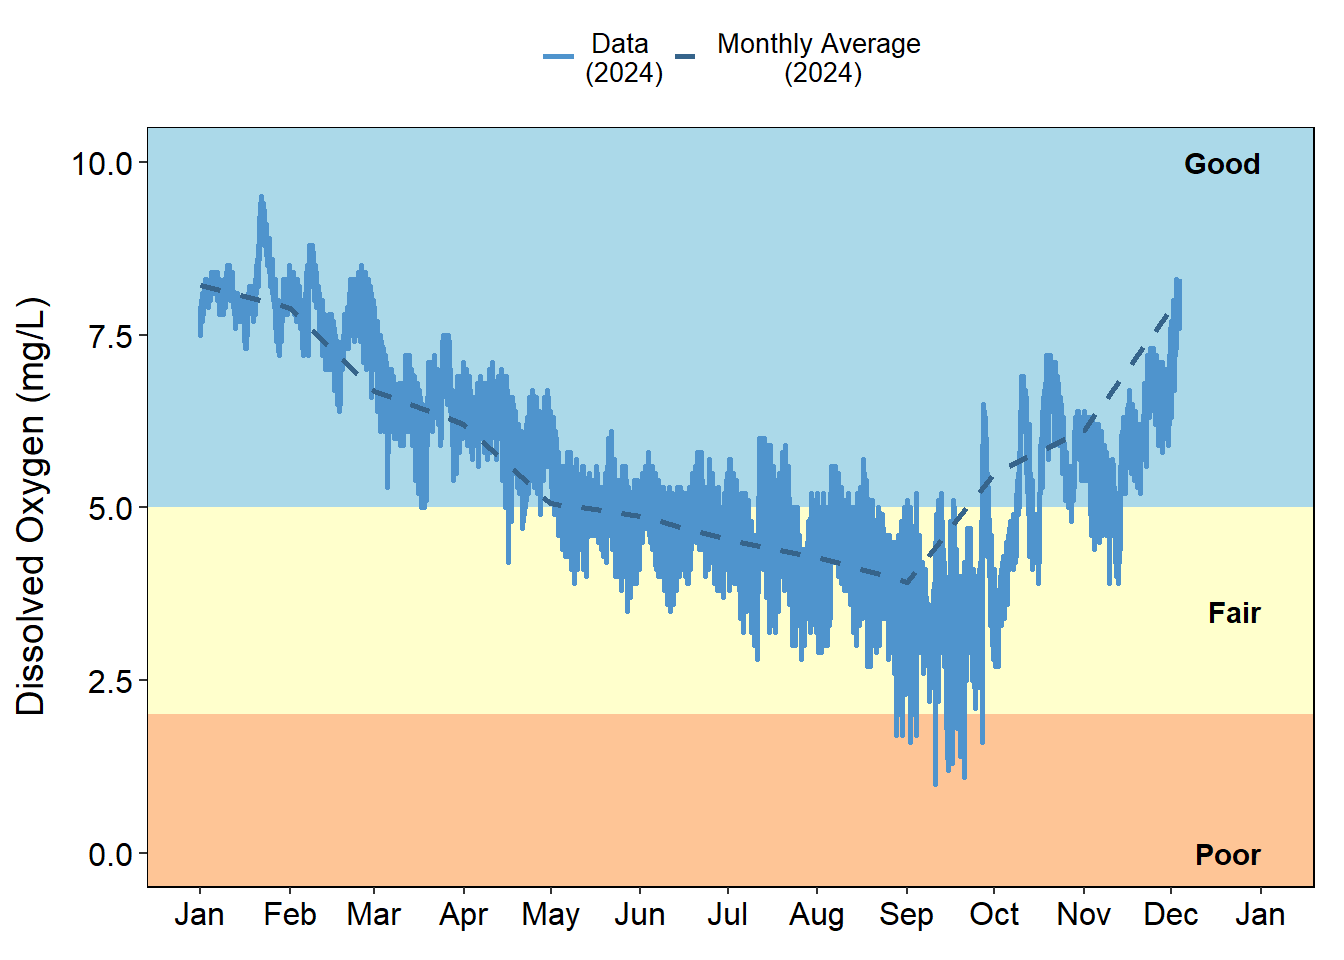
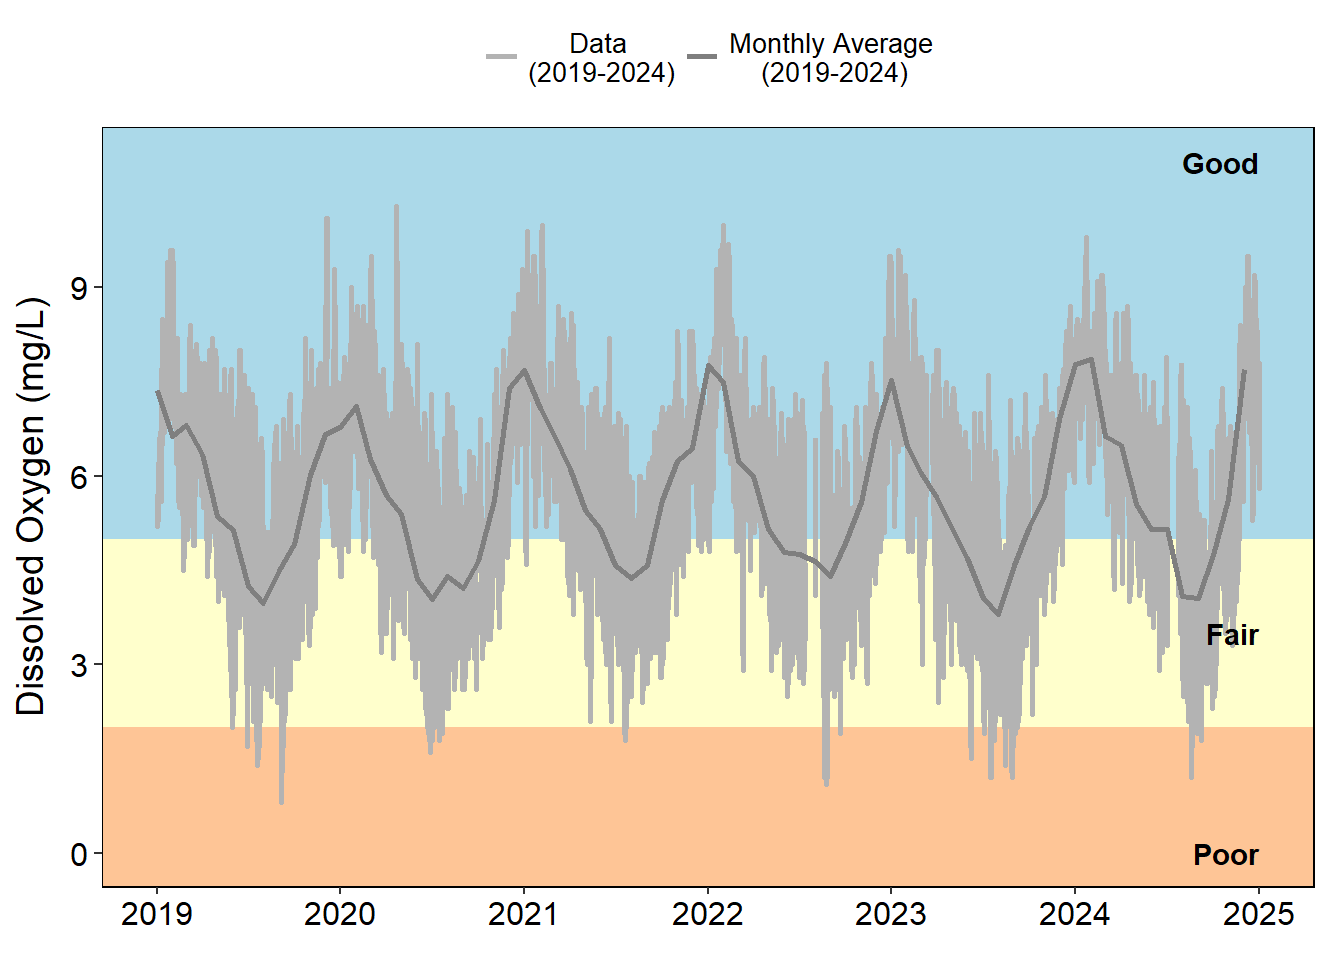
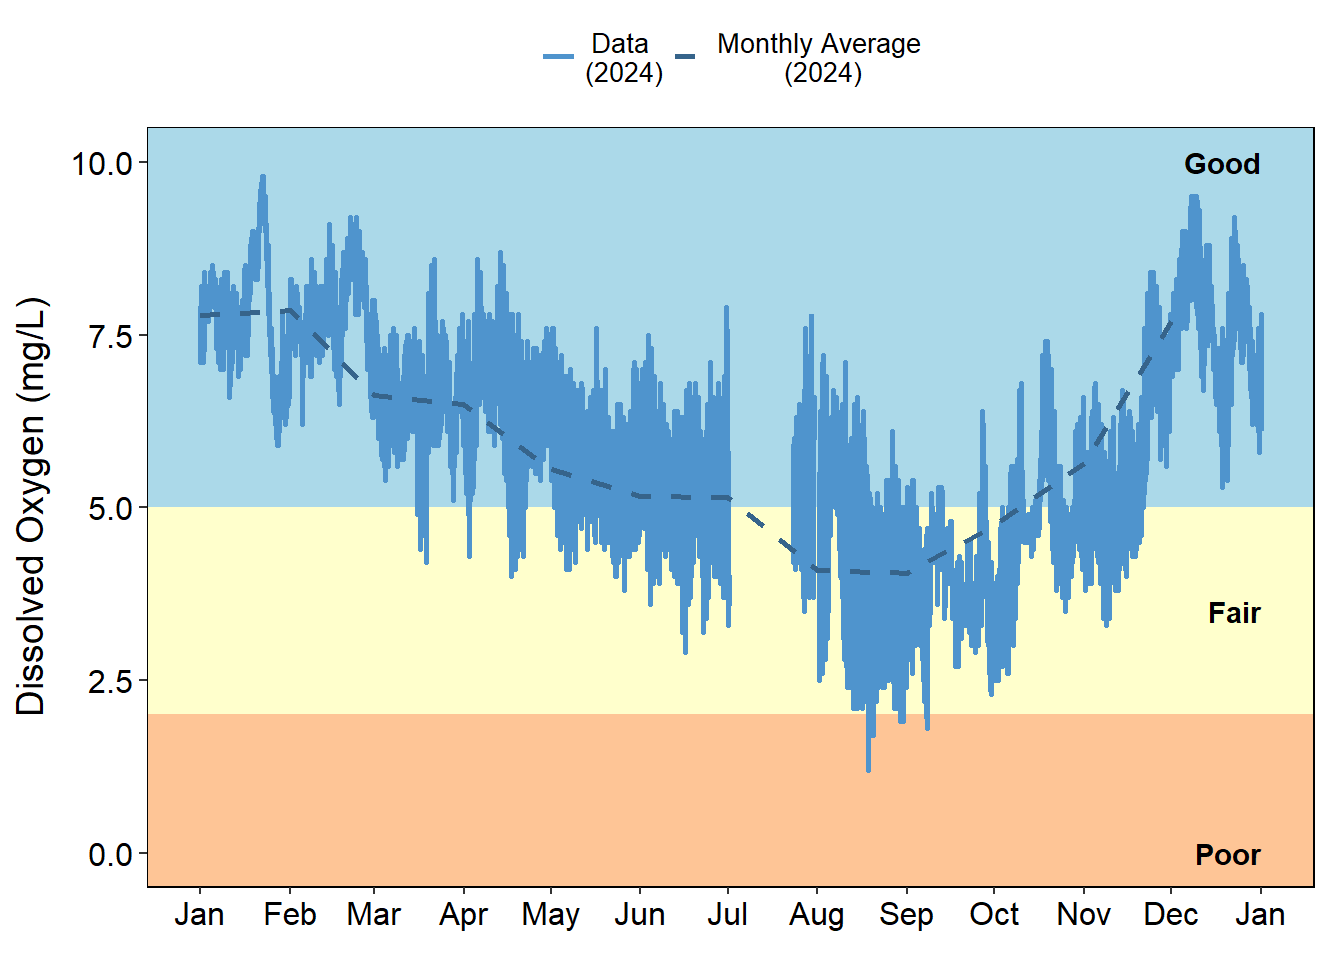
Daily average dissolved oxygen values were mostly within or above their average ranges in 2024, and never fell below the 2 mg/L hypoxia threshold (Figure 5.1). Historically, dissolved oxygen values at Pine Island (Figure 5.2 (a)) and Pellicer Creek (Figure 5.3 (a)) frequently fell below the 2 mg/L hypoxia threshold during the third and fourth quarters. Data for 2024 follows the same trend, falling below threshold from August to October for both sites ((Figure 5.2 (b); Figure 5.3 (b)).
Pellicer Creek is located within a waterbody with known impairments for dissolved oxygen, chlorophyll a, and fecal coliform bacteria. As such, this station frequently experiences low dissolved oxygen values, particularly in the summer months (Figure 5.3). Dissolved oxygen at Pine Island has been uncharacteristically low in the past two years (Figure 5.2).
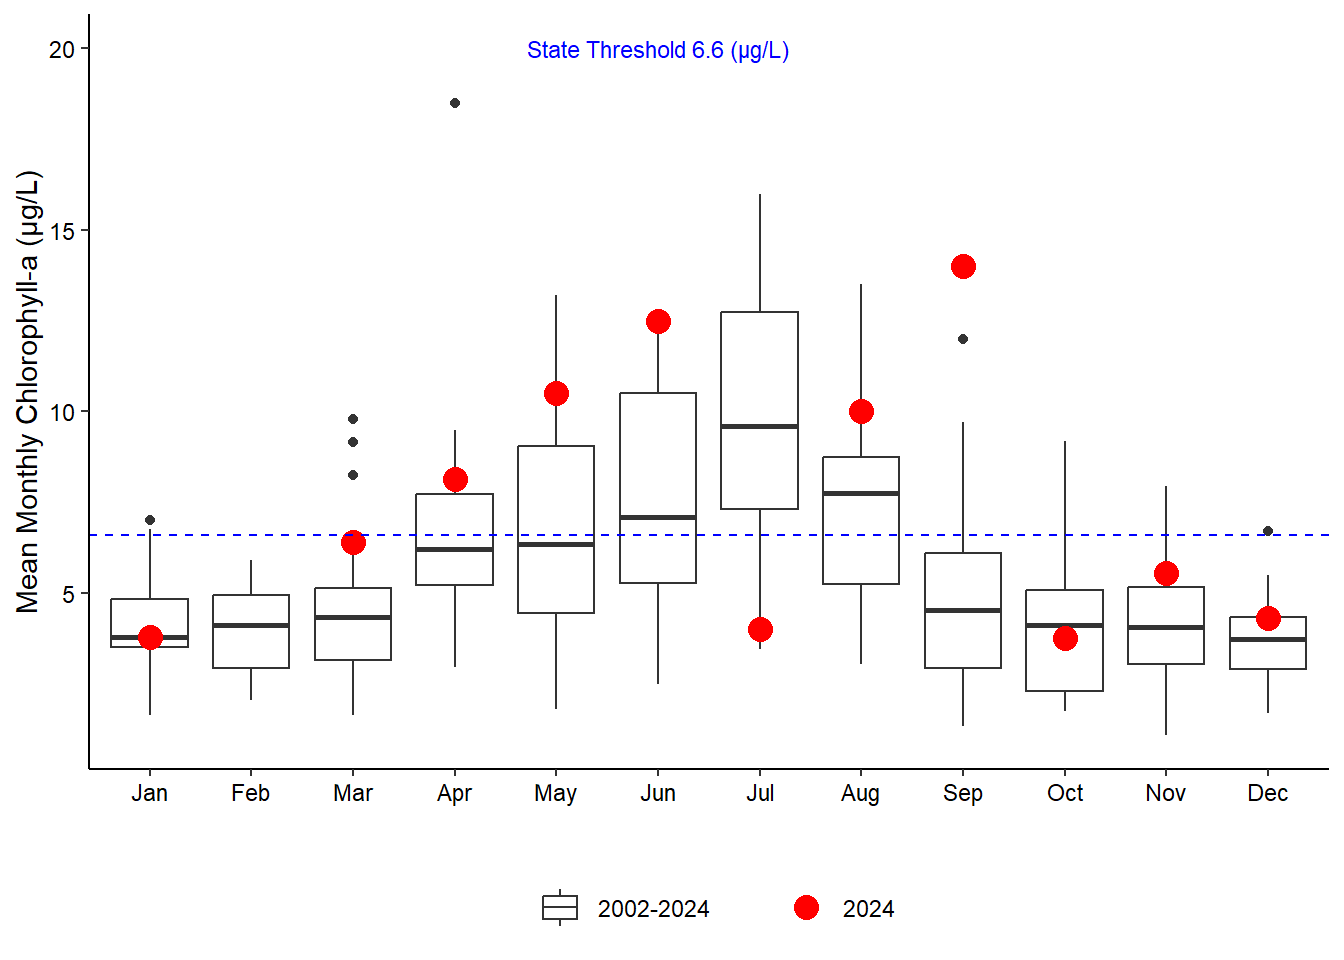
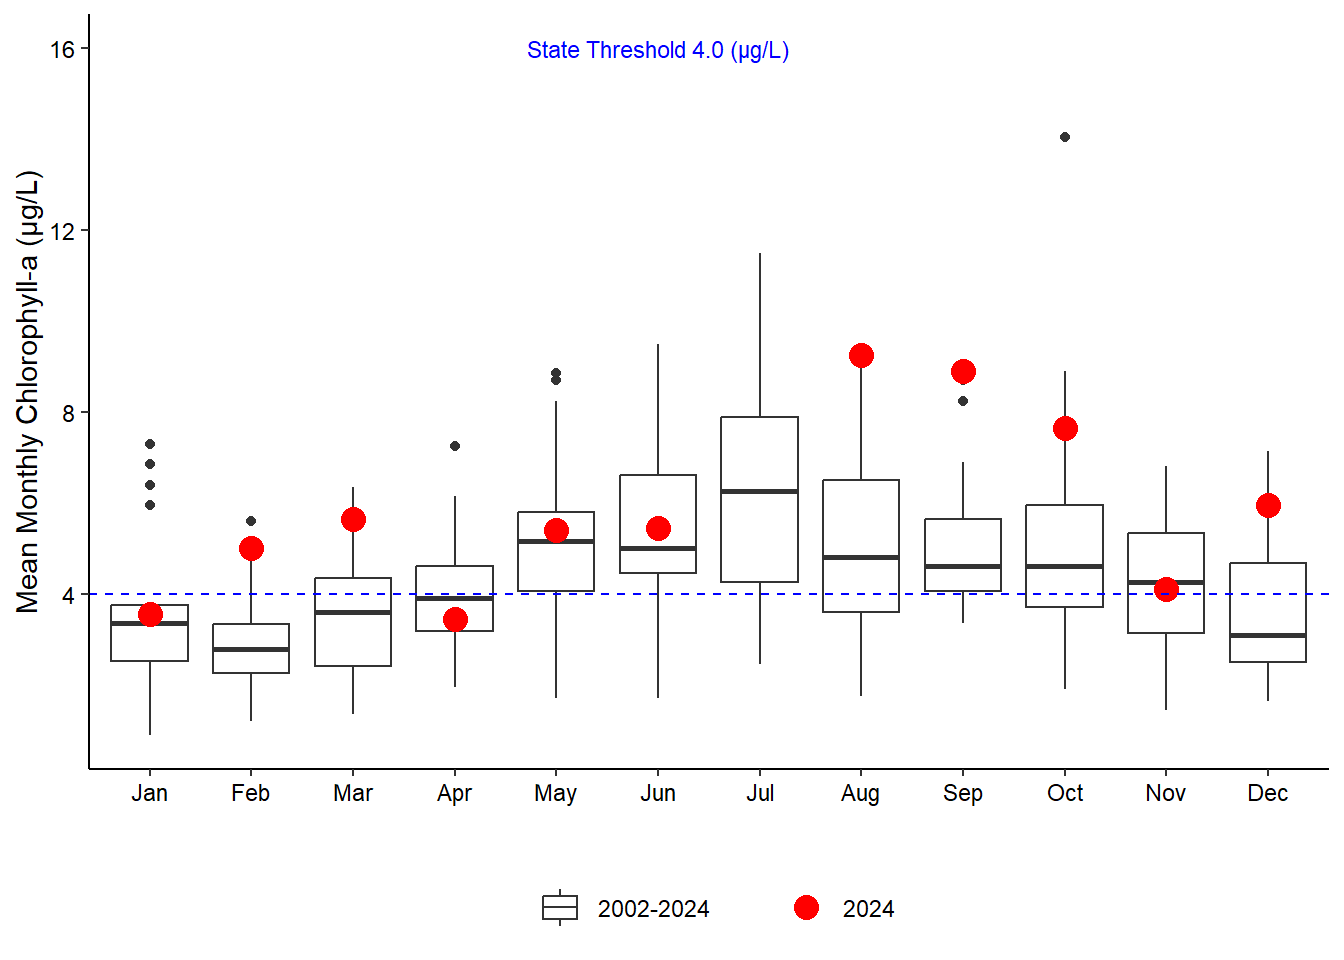
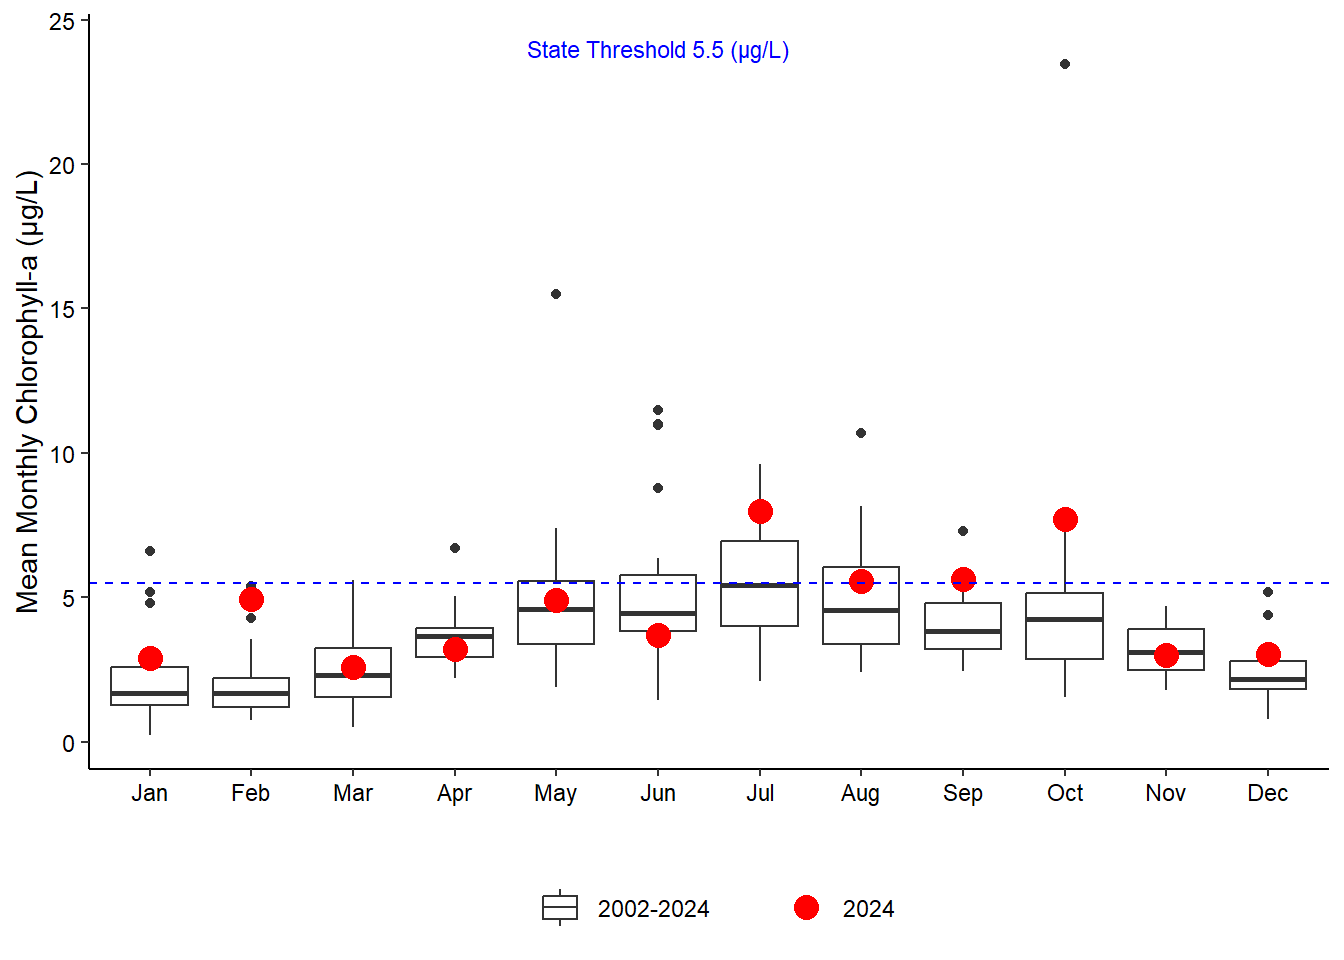
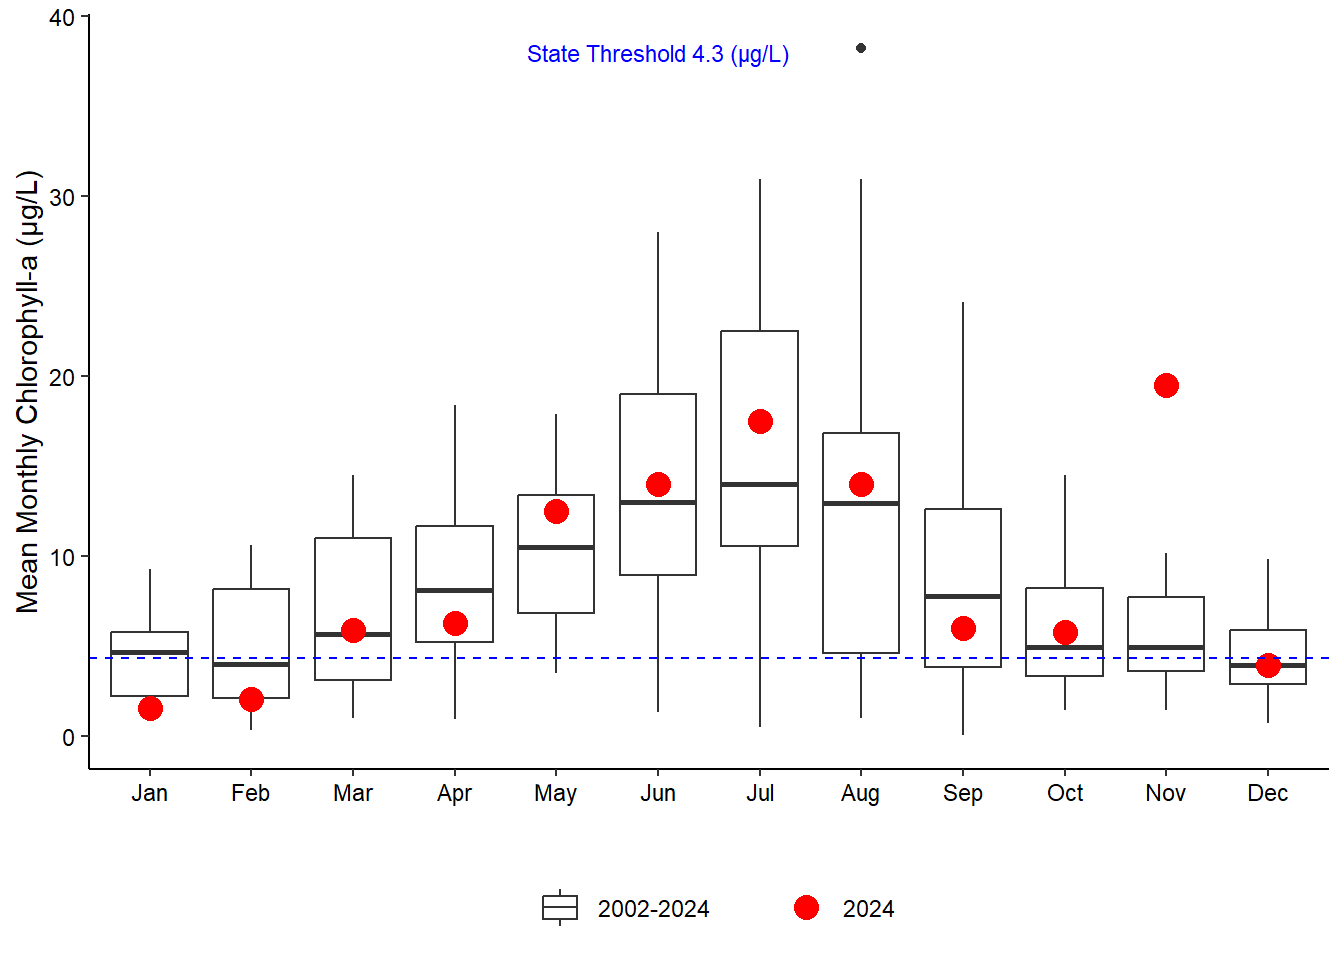
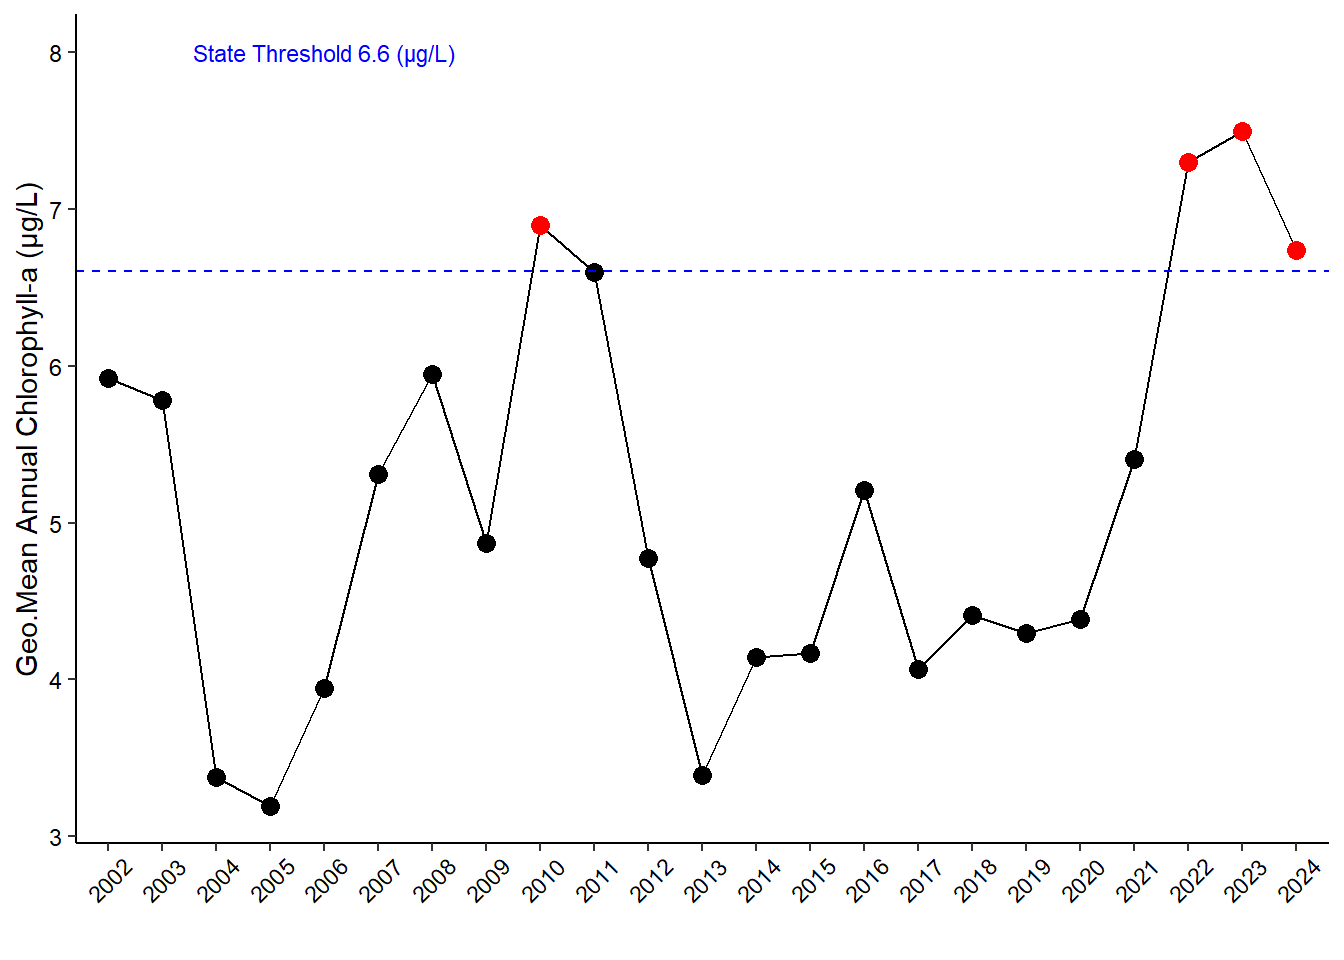
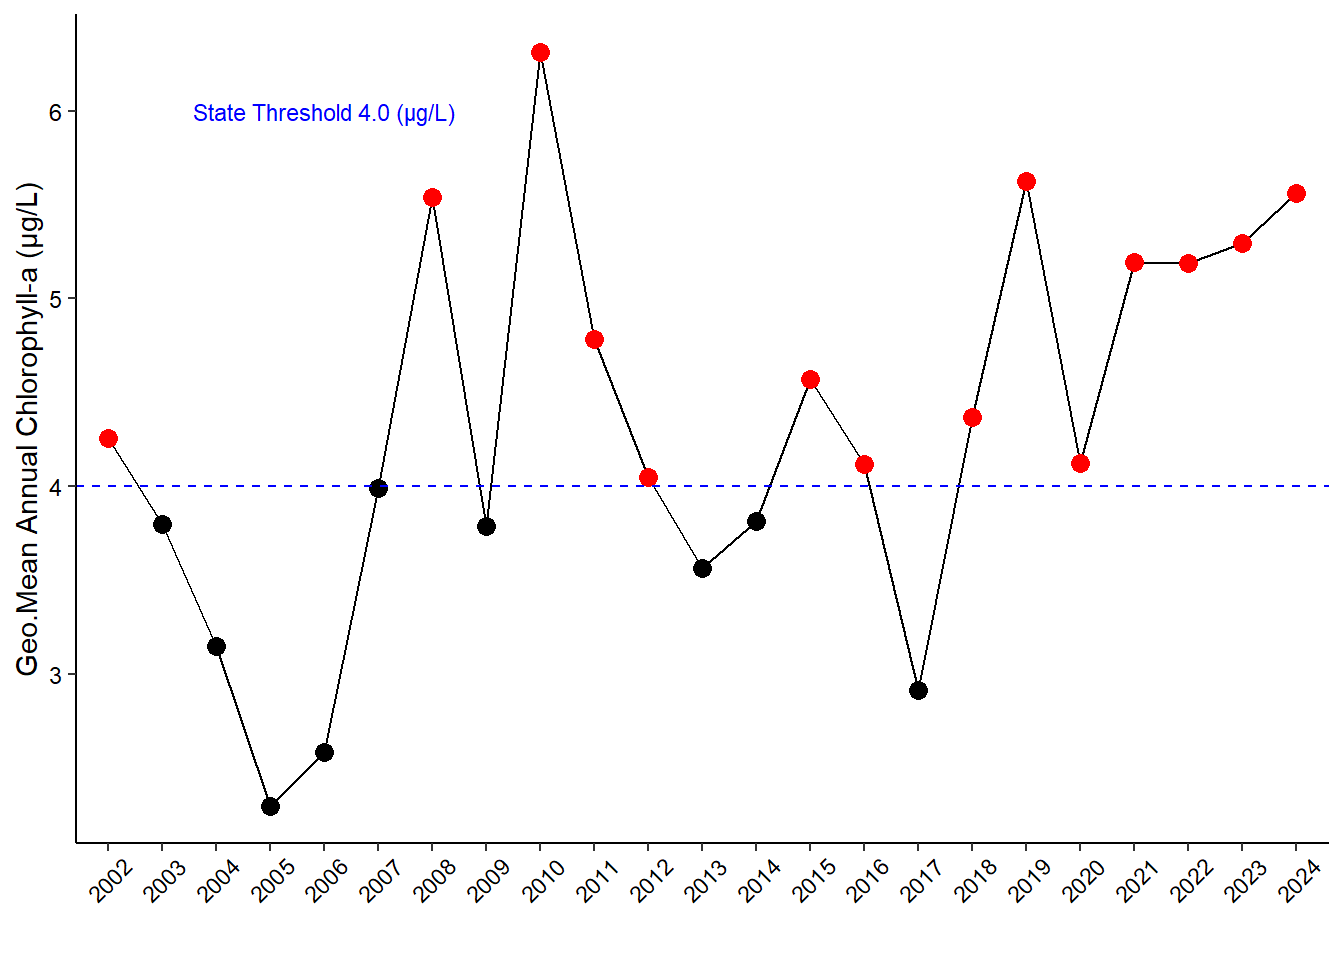
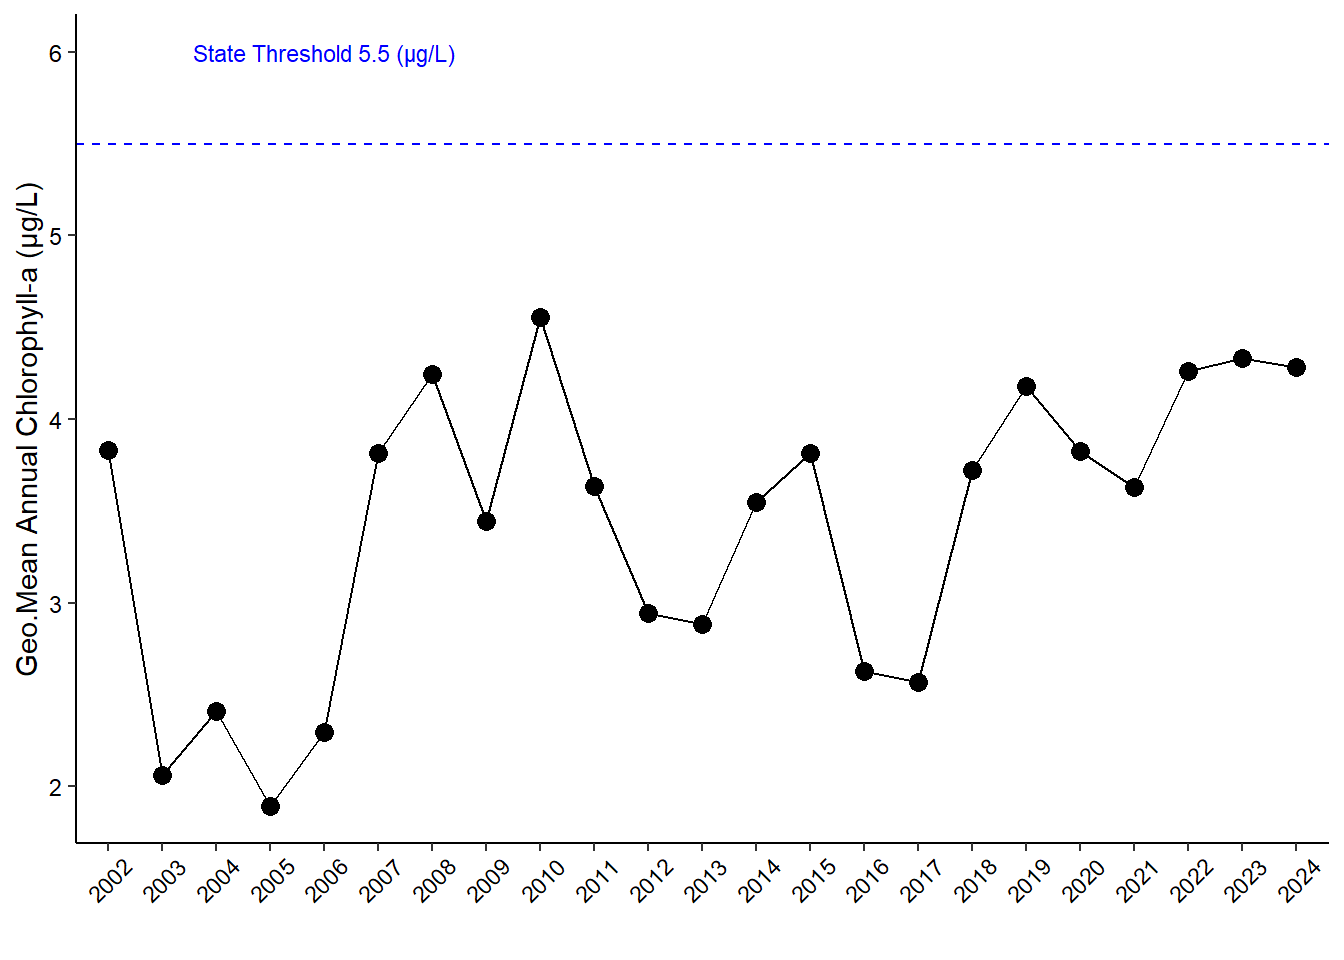
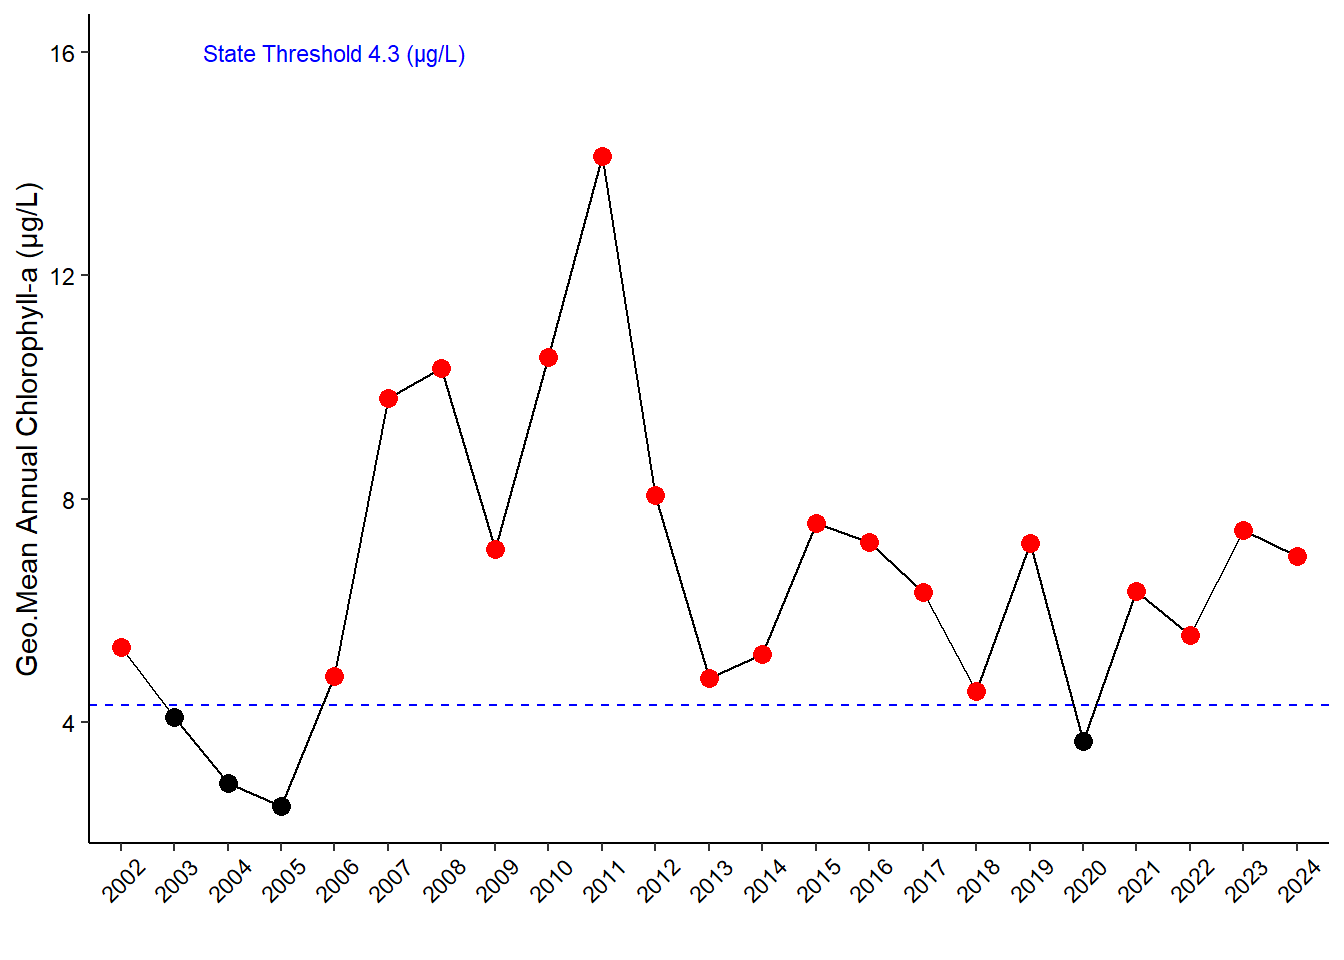
Chlorophyll a values were often higher than average at all stations this year, especially at Pine Island and San Sebastian (Figure 5.4). However, Pine Island data for quarter 4 were closer to average and fell below the state threshold for that waterbody (6.6 μg/L) each month. The annual geometric mean (AGM) chlorophyll a values were above the state threshold levels at all stations except for Fort Matanzas (Figure 5.5).
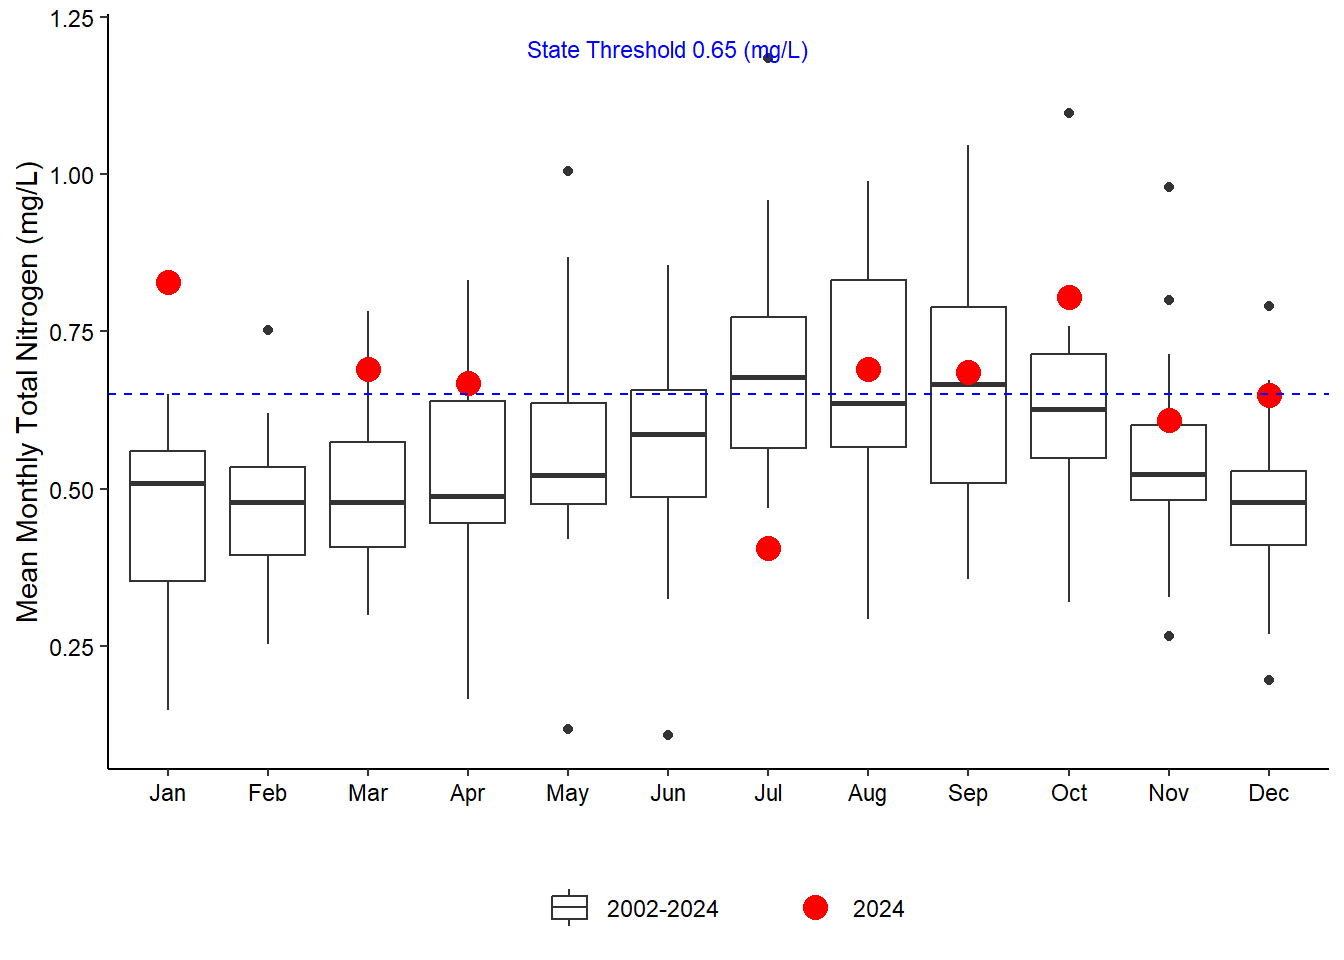
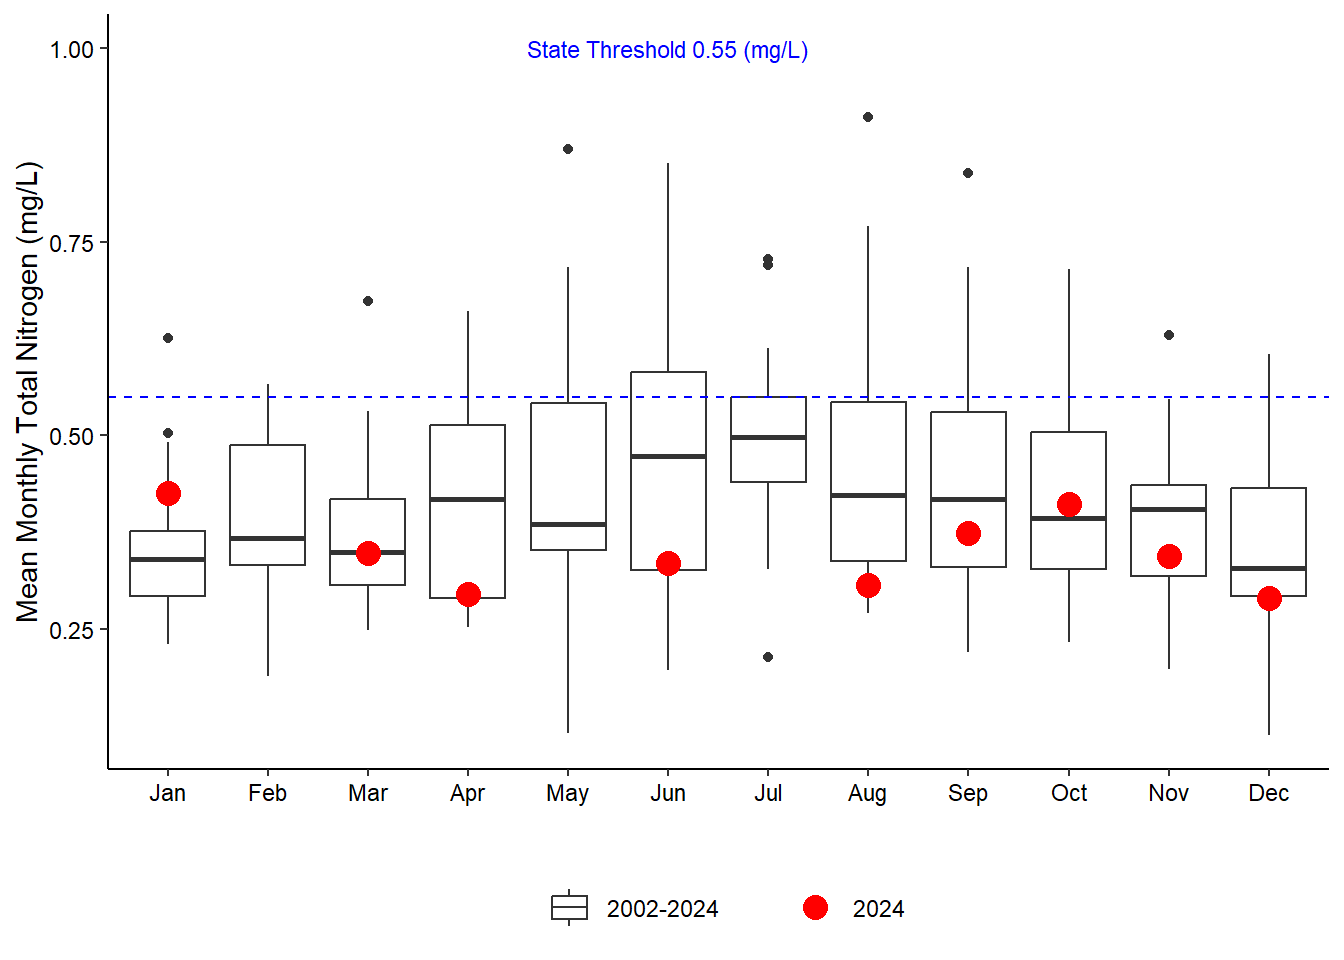
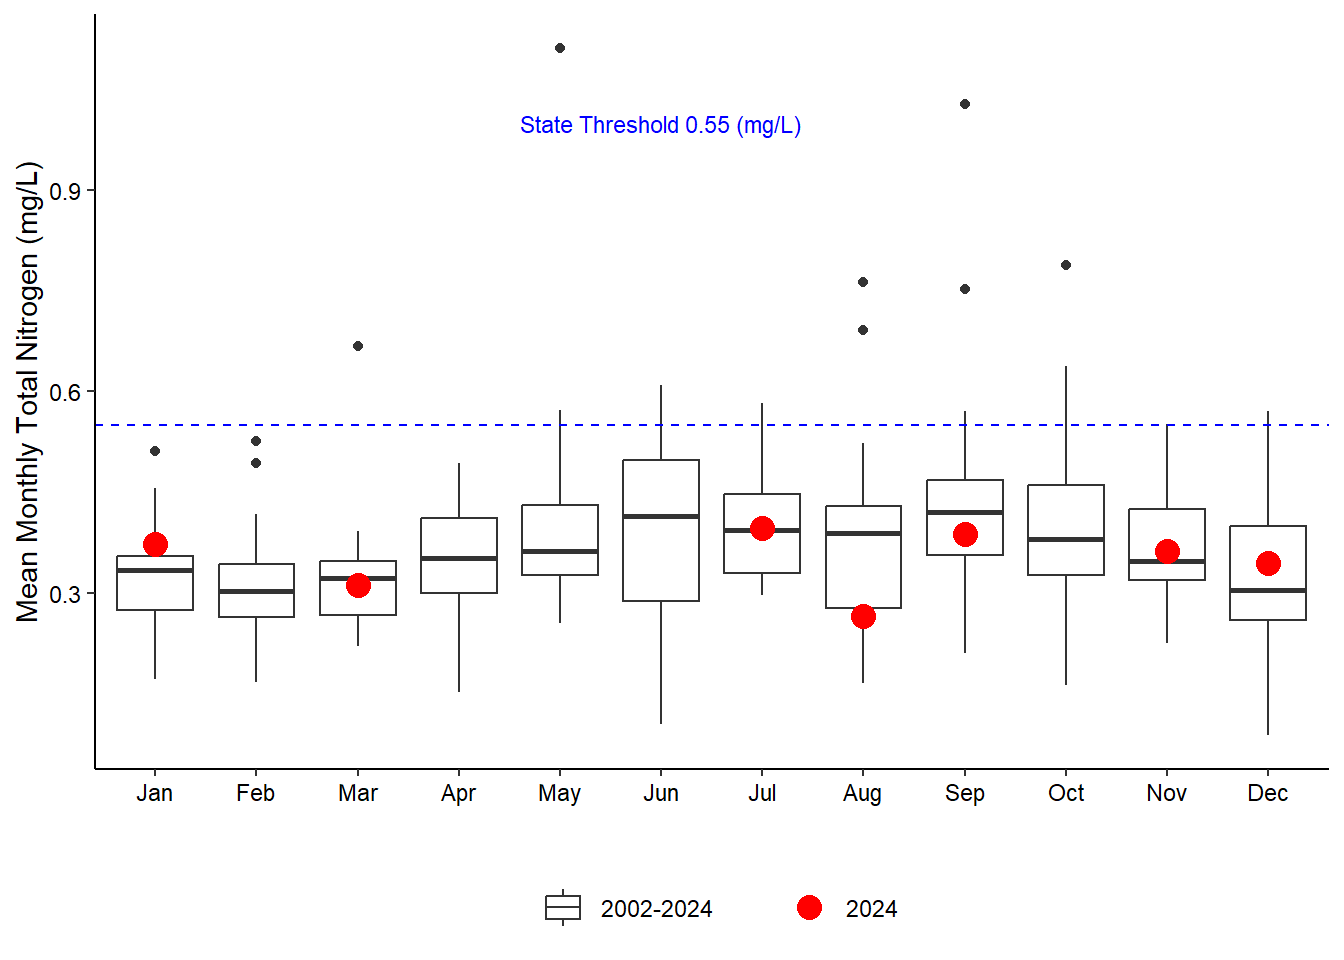
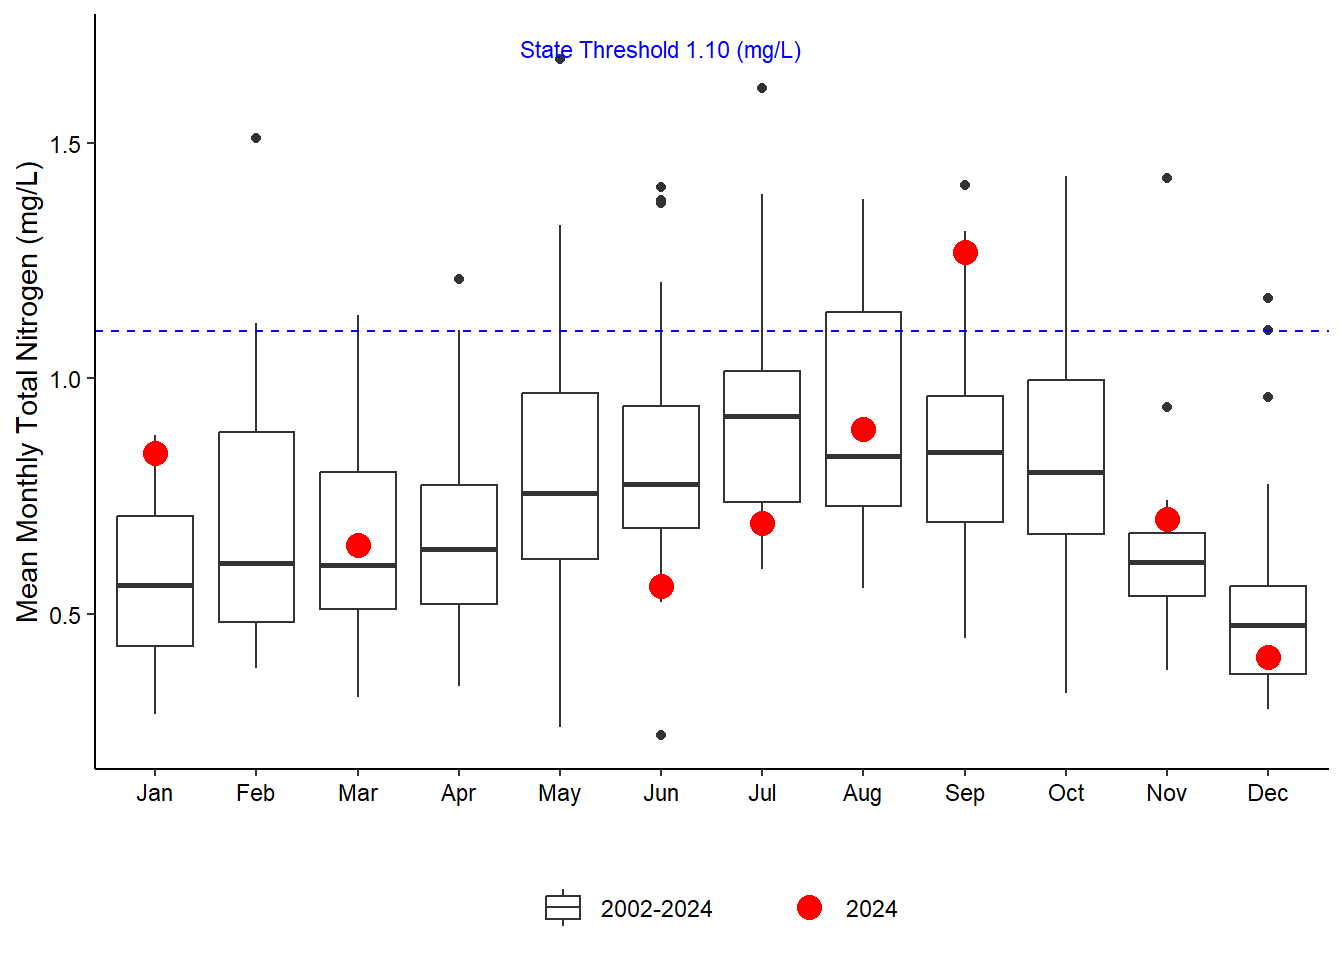
Total Nitrogen (TN) is calculated by adding Total Kjeldahl Nitrogen, Nitrate and Nitrite. It accounts for the inorganic nitrogen fraction as well as larger pools of organic bioavailable forms. Several of the nitrate and nitrite values fell below the Florida Department of Environmental Protection Central Lab’s minimum detection limit; therefore, TN monthly concentration means were unable to be calculated for multiple months across all stations (Figure 5.6). This was especially true at Fort Matanzas, which has the least amount of TN data (Figure 5.6 (c)). The mean monthly TN values for all months in 2024 fell below the state threshold for their respective waterbodies at San Sebastian and Fort Matanzas (Figure 5.6 (b); Figure 5.6 (c)). The majority of Pine Island’s 2024 mean monthly TN concentrations were above the state threshold, while only September’s concentration was higher than the state threshold at Pellicer Creek (Figure 5.6 (a); Figure 5.6 (d)).
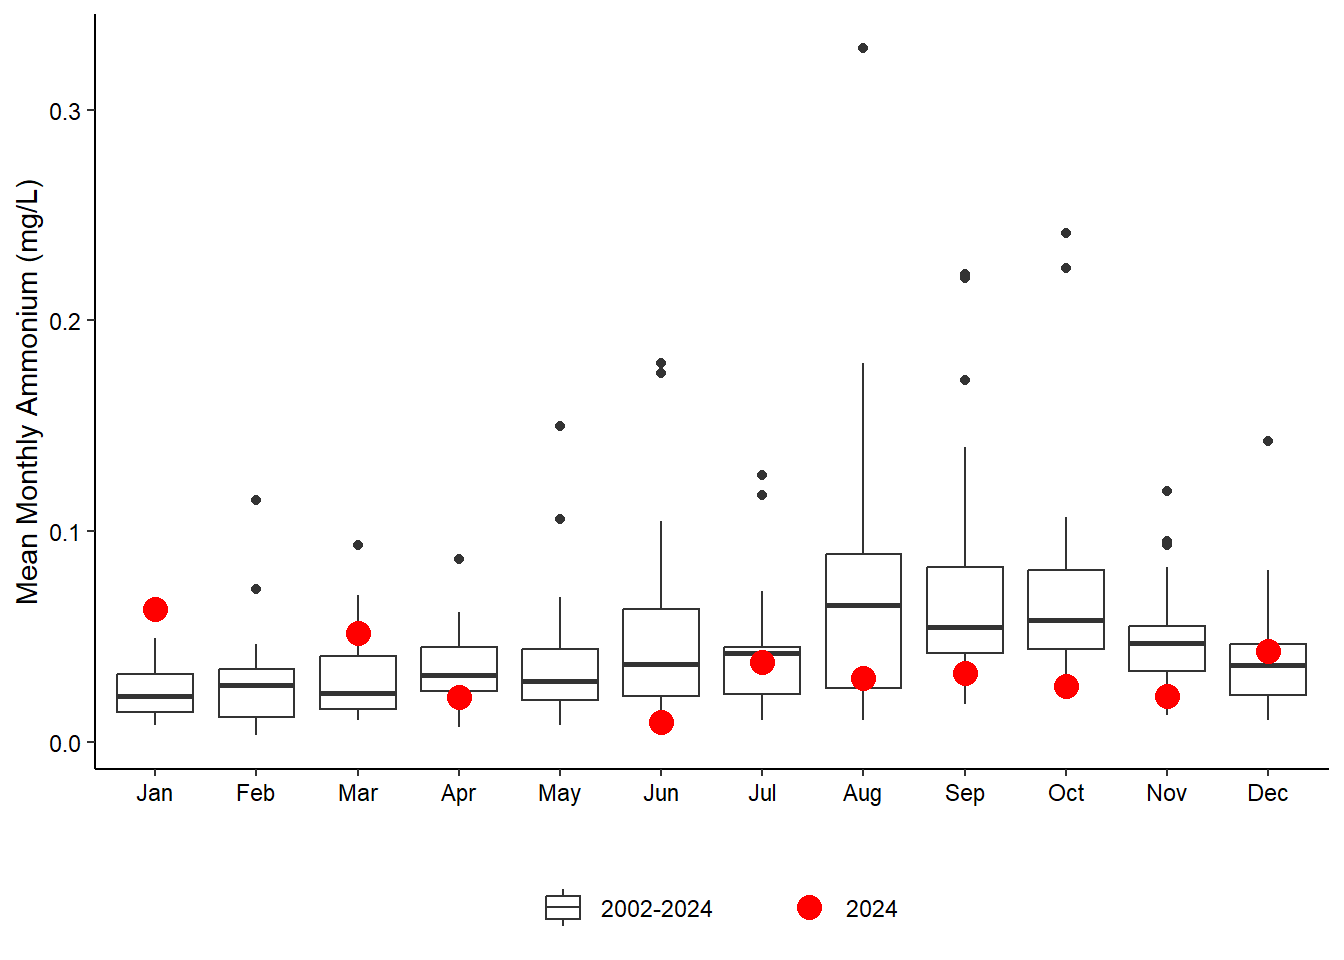
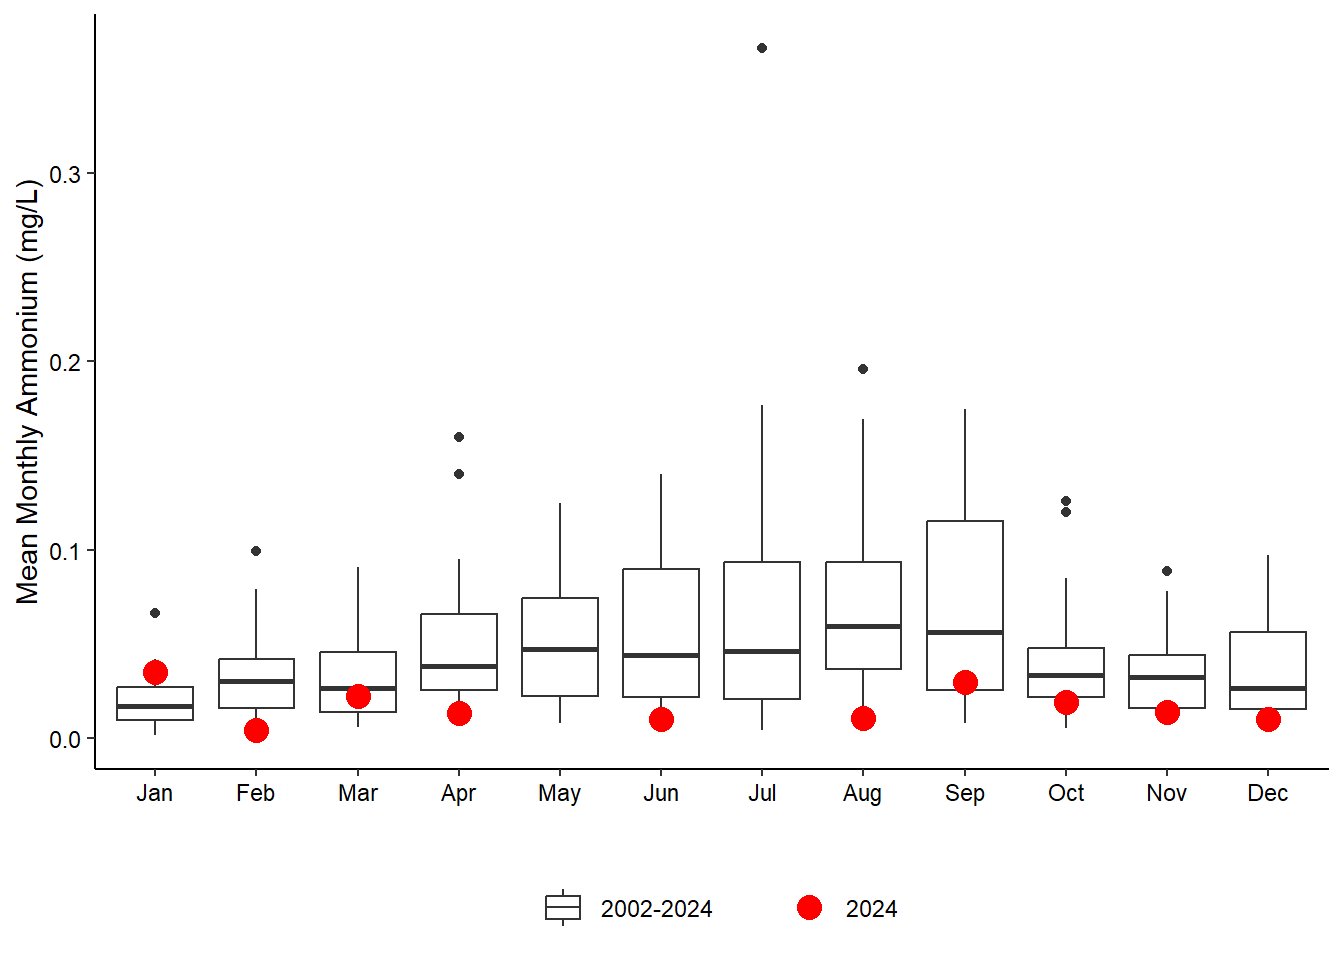
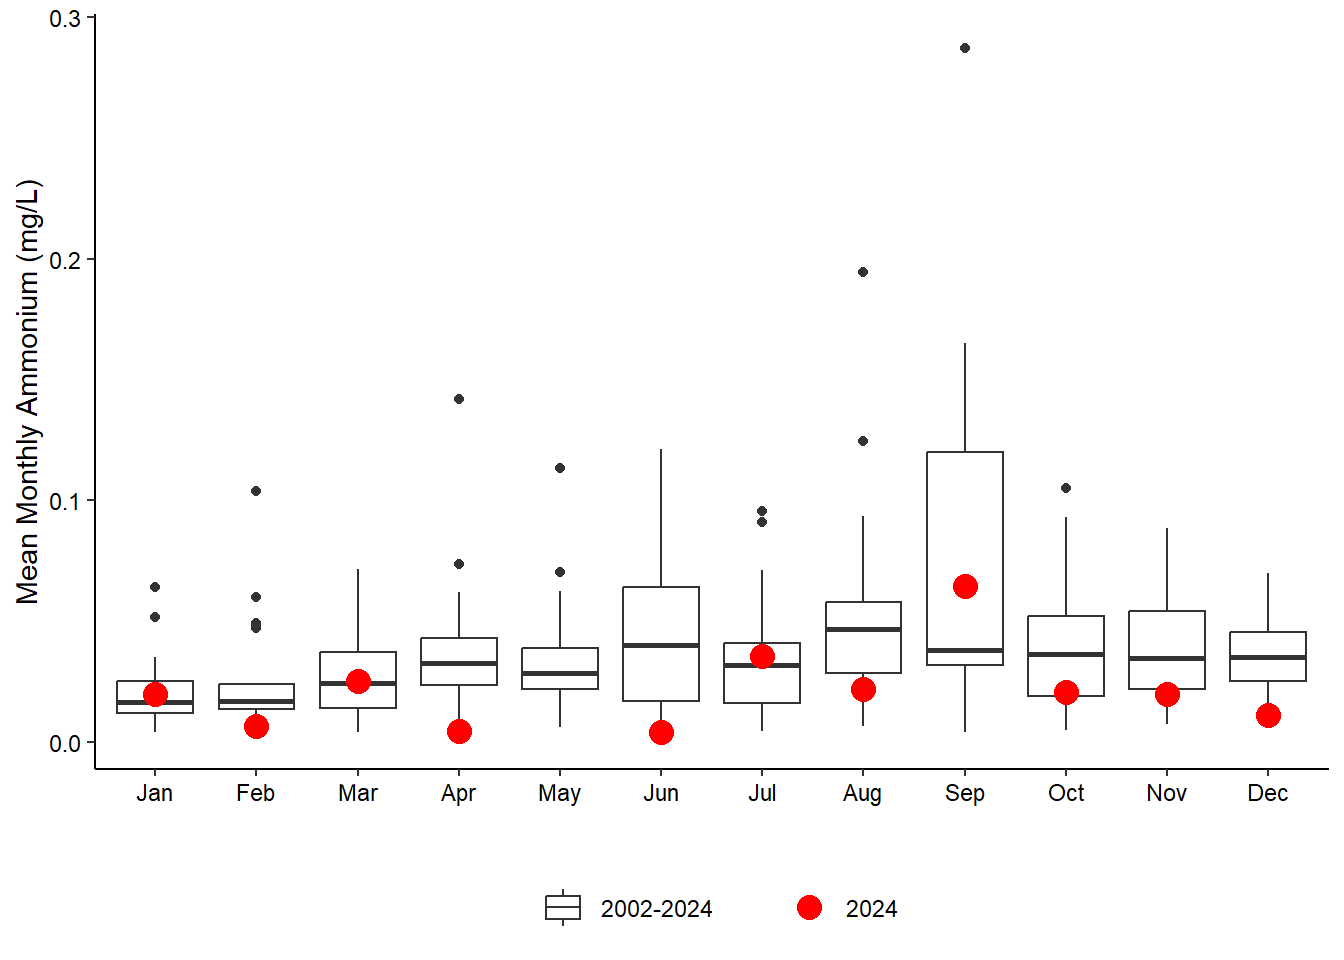
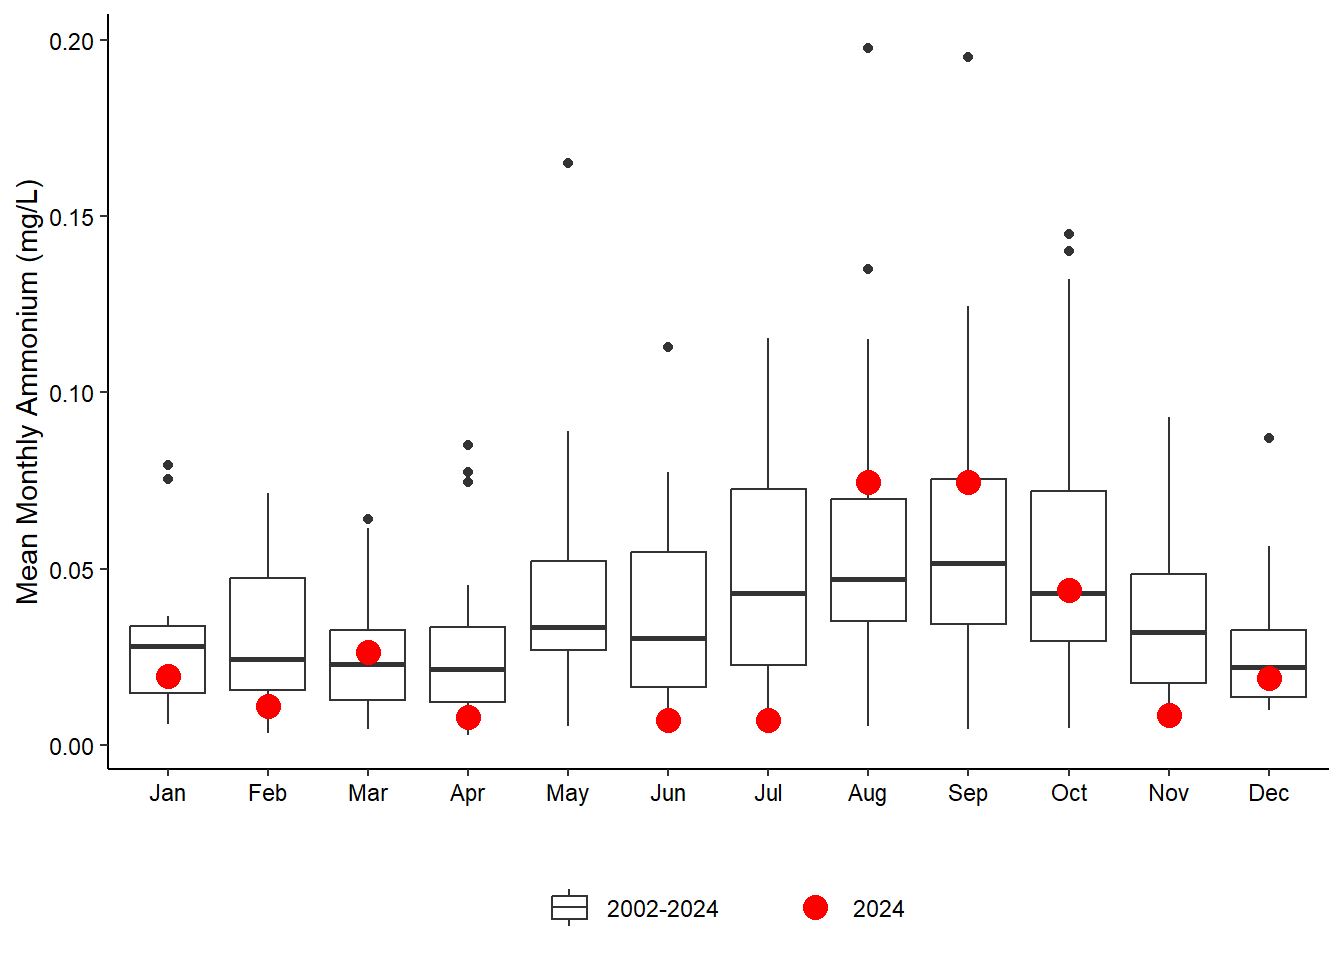
Ammonium (NH4) is directly measured in our samples and is a key inorganic nutrient assimilated by phytoplankton in primary production. NH4 concentrations for 2024 were near or below monthly means most of year at all four stations (Figure 5.7). Concentrations were notably above average at Fort Matanzas in September (Figure 5.7 (c)), Pellicer Creek in August and September (Figure 5.7 (d)), and Pine Island in December (Figure 5.7 (a)).
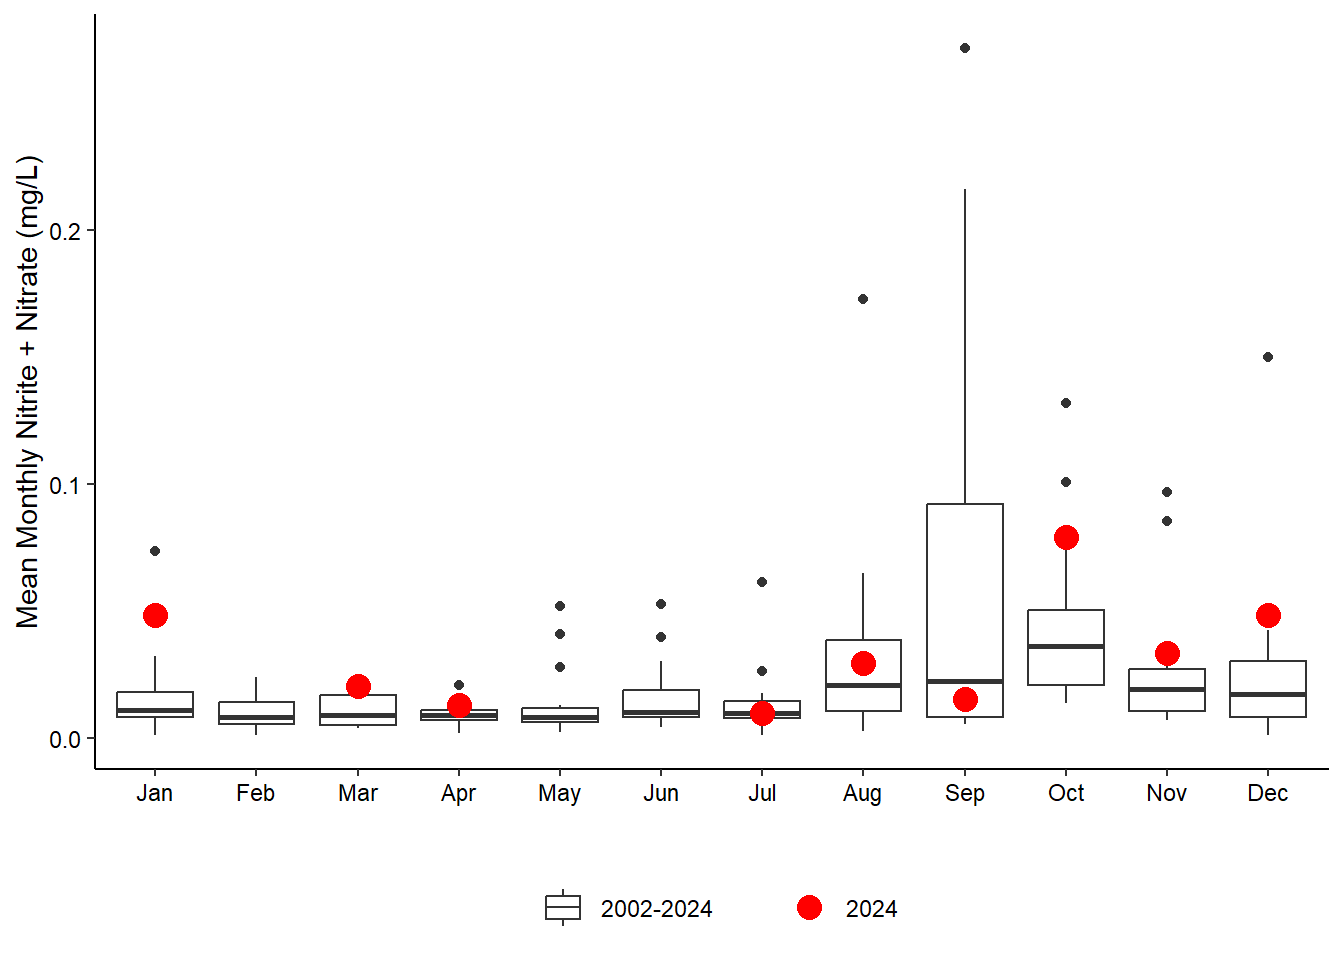
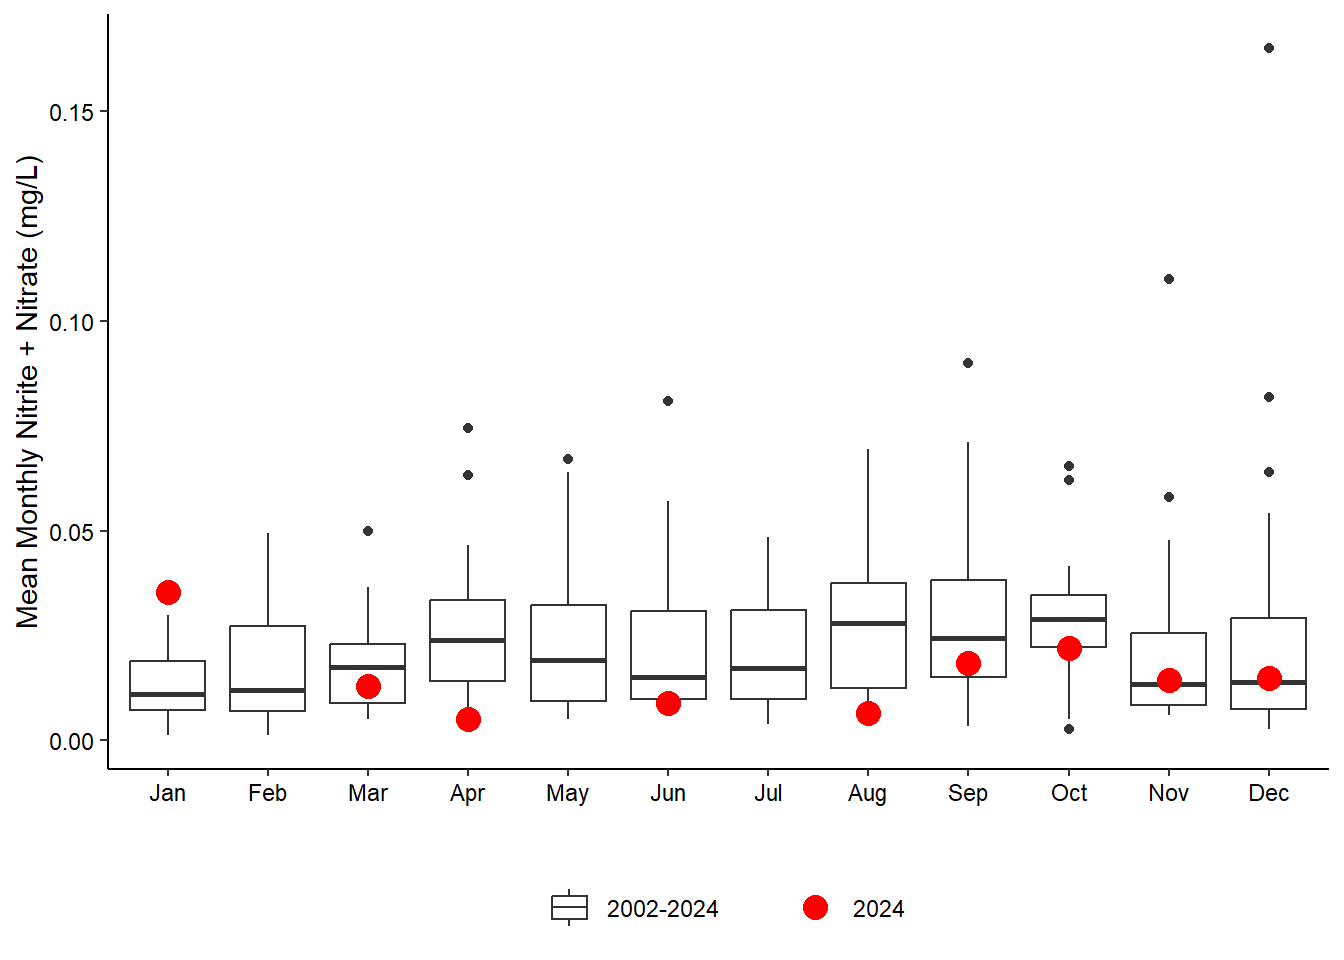
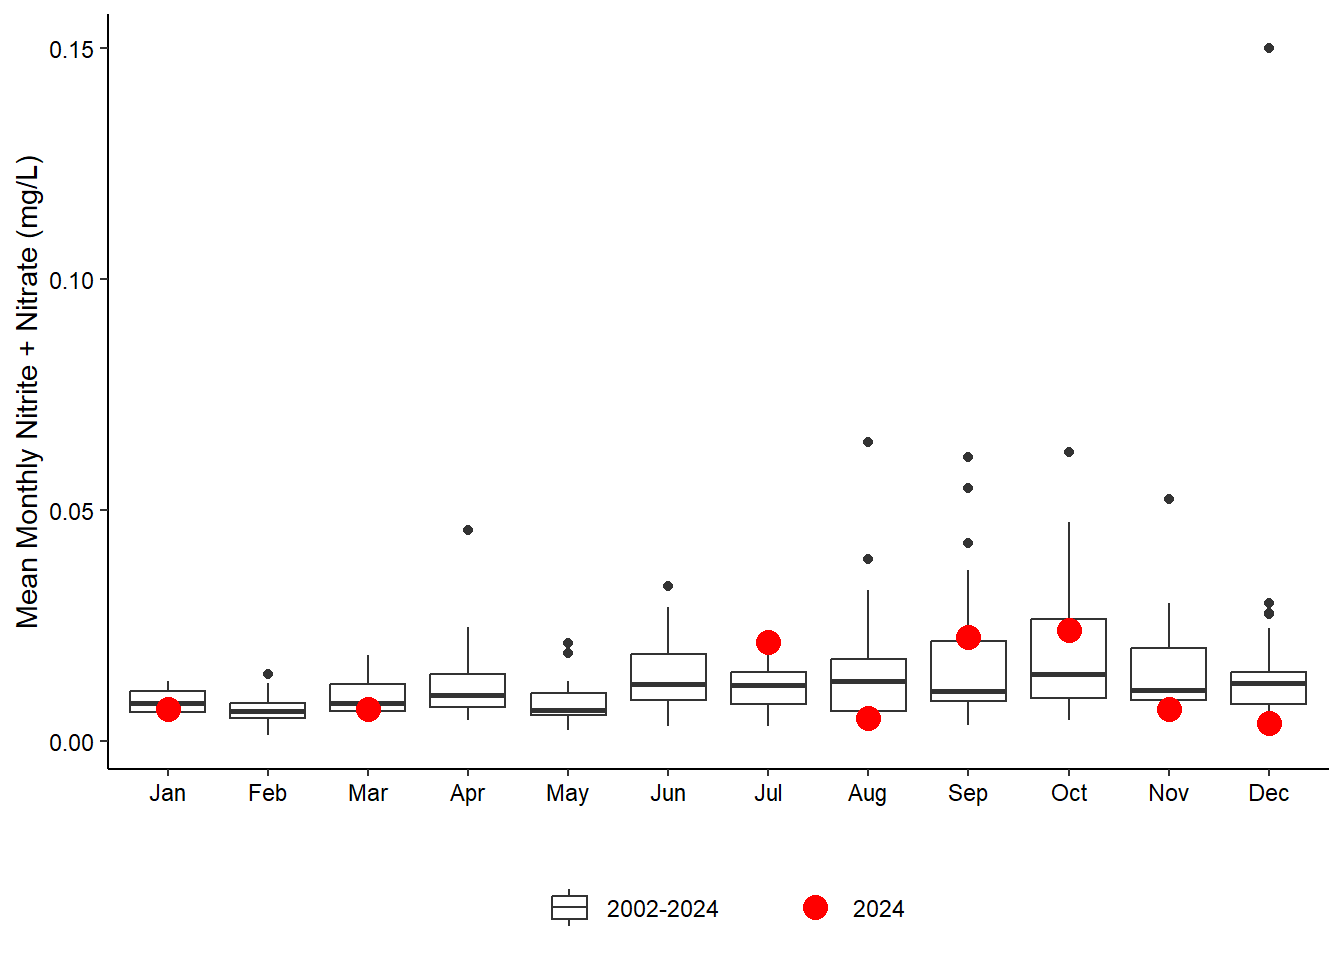
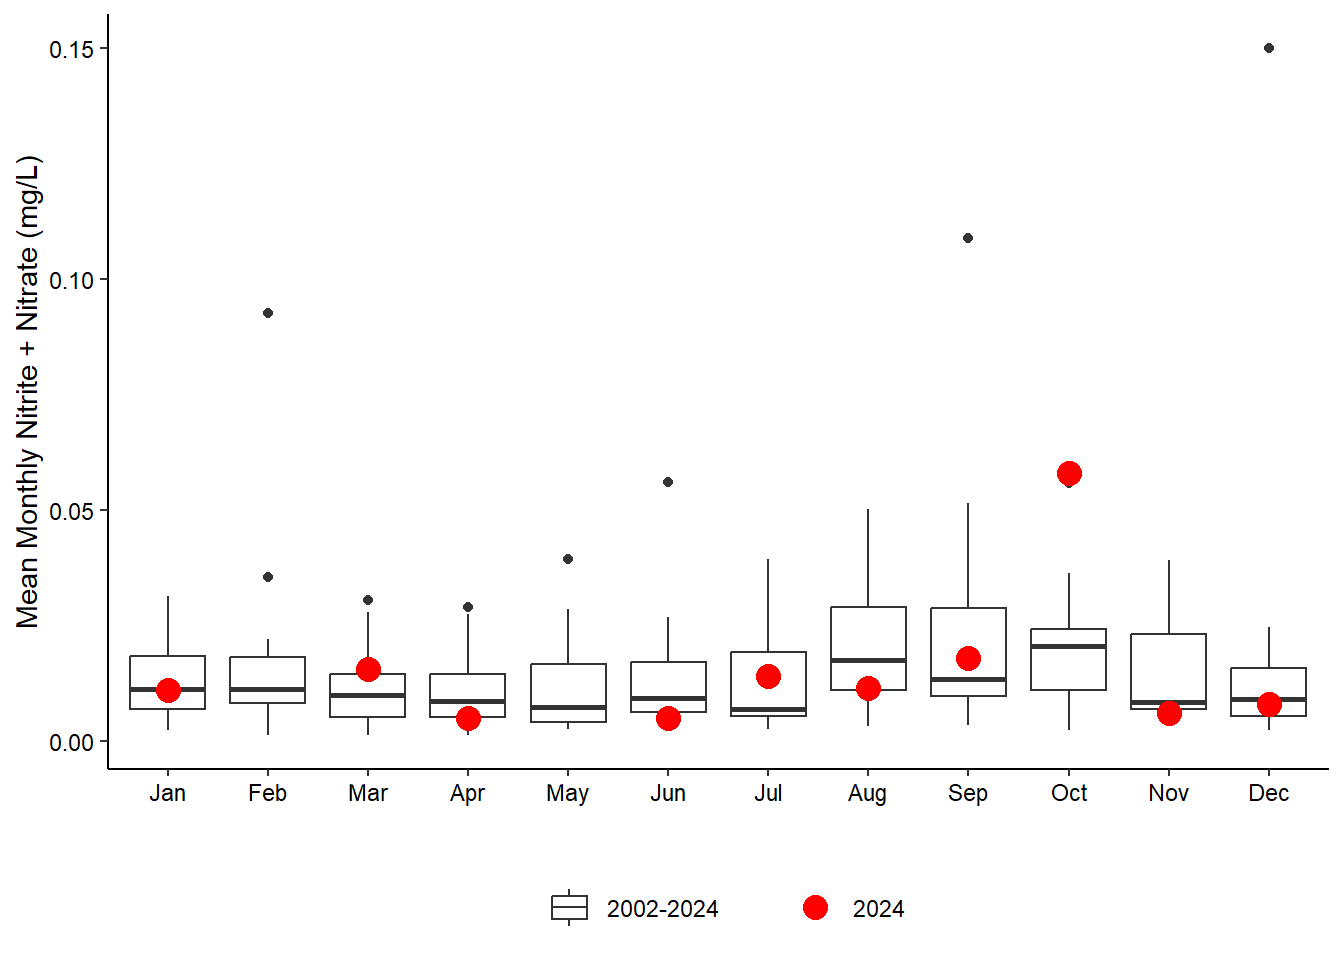
Nitrite + Nitrate (NO23) concentrations for 2024 were near or above the monthly mean at Pine Island for most of the year, with the last quarter having all three months within or greater than the highest quartile (Figure 5.8 (a)). Concentrations were especially high in January and October at Pine Island, January at San Sebastian, and October at Pellicer Creek (Figure 5.8 (a); Figure 5.8 (b); Figure 5.8 (d)).
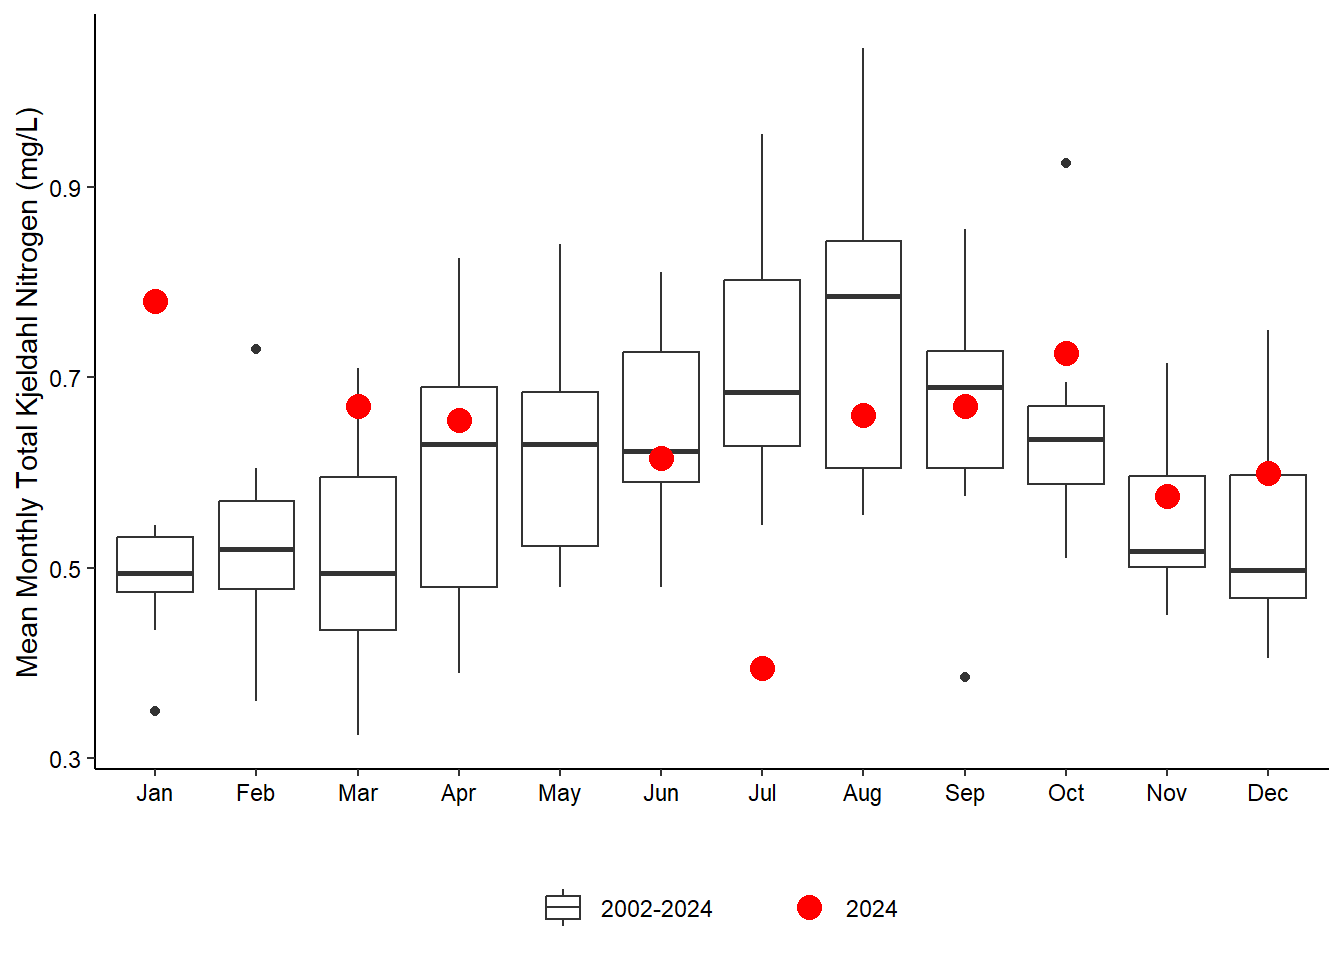
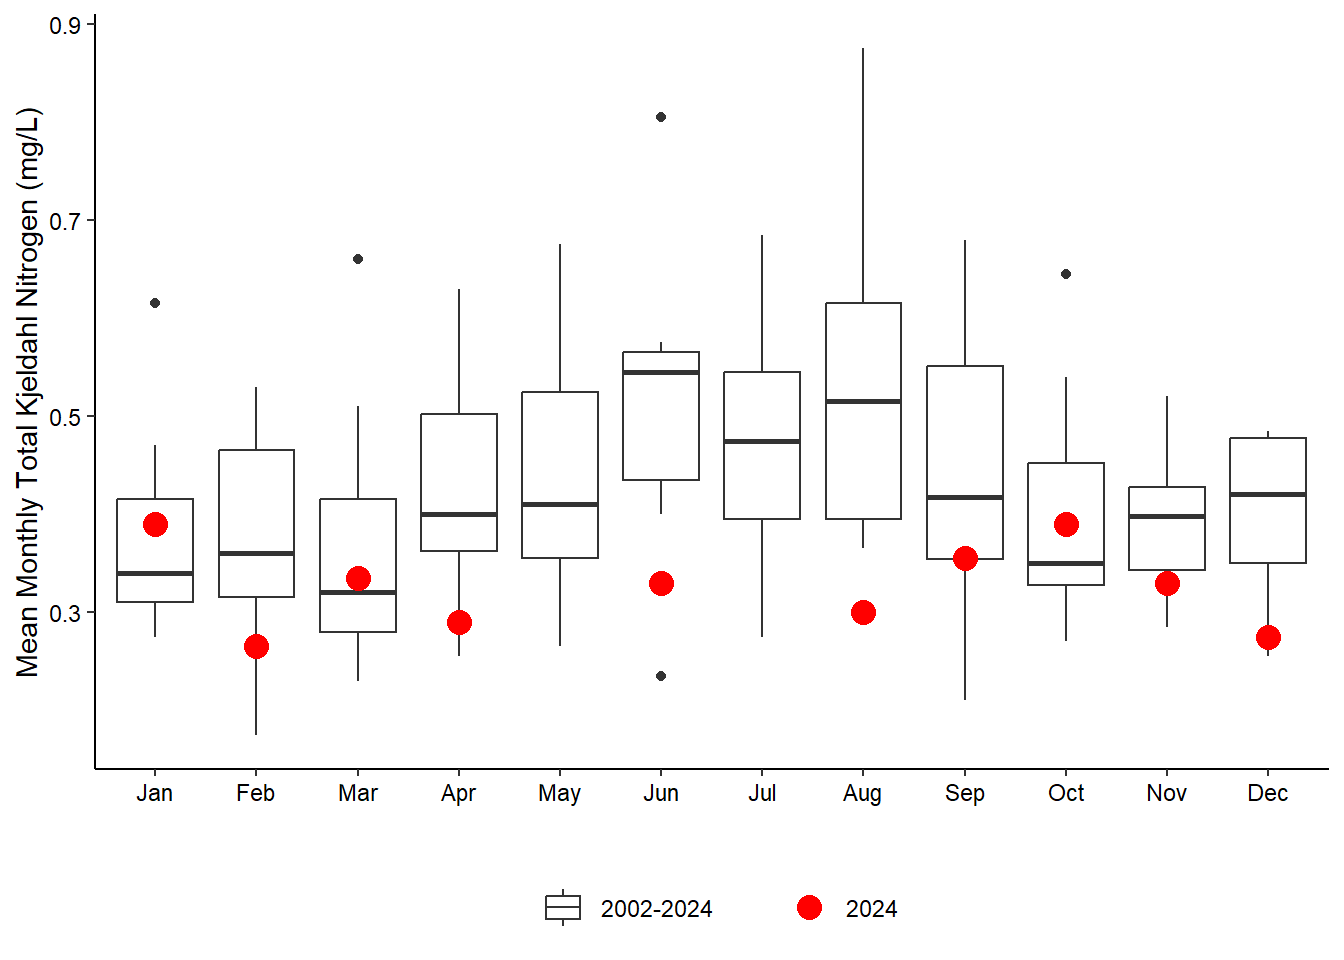
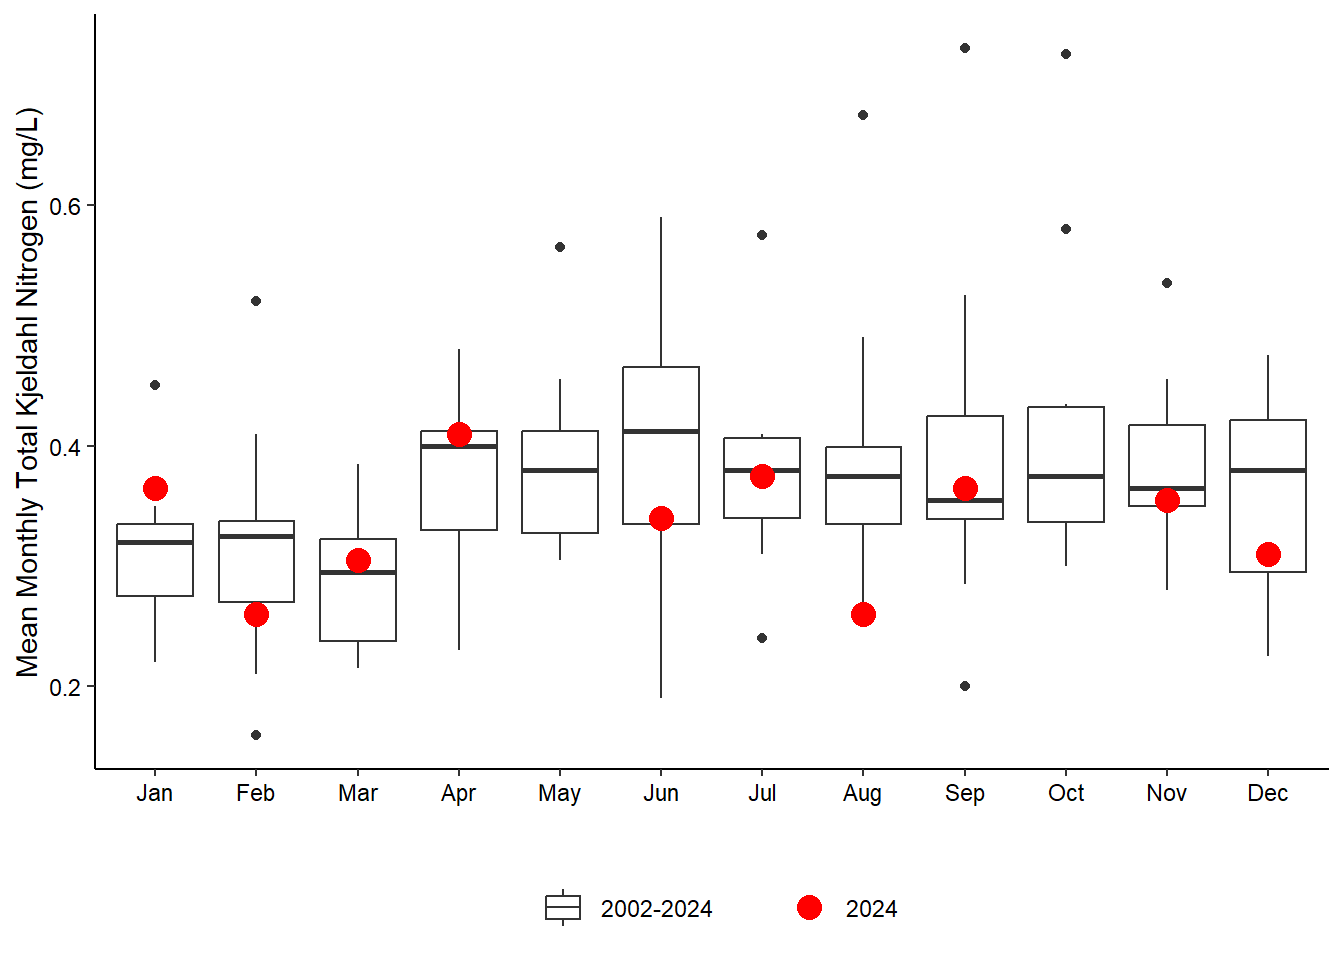
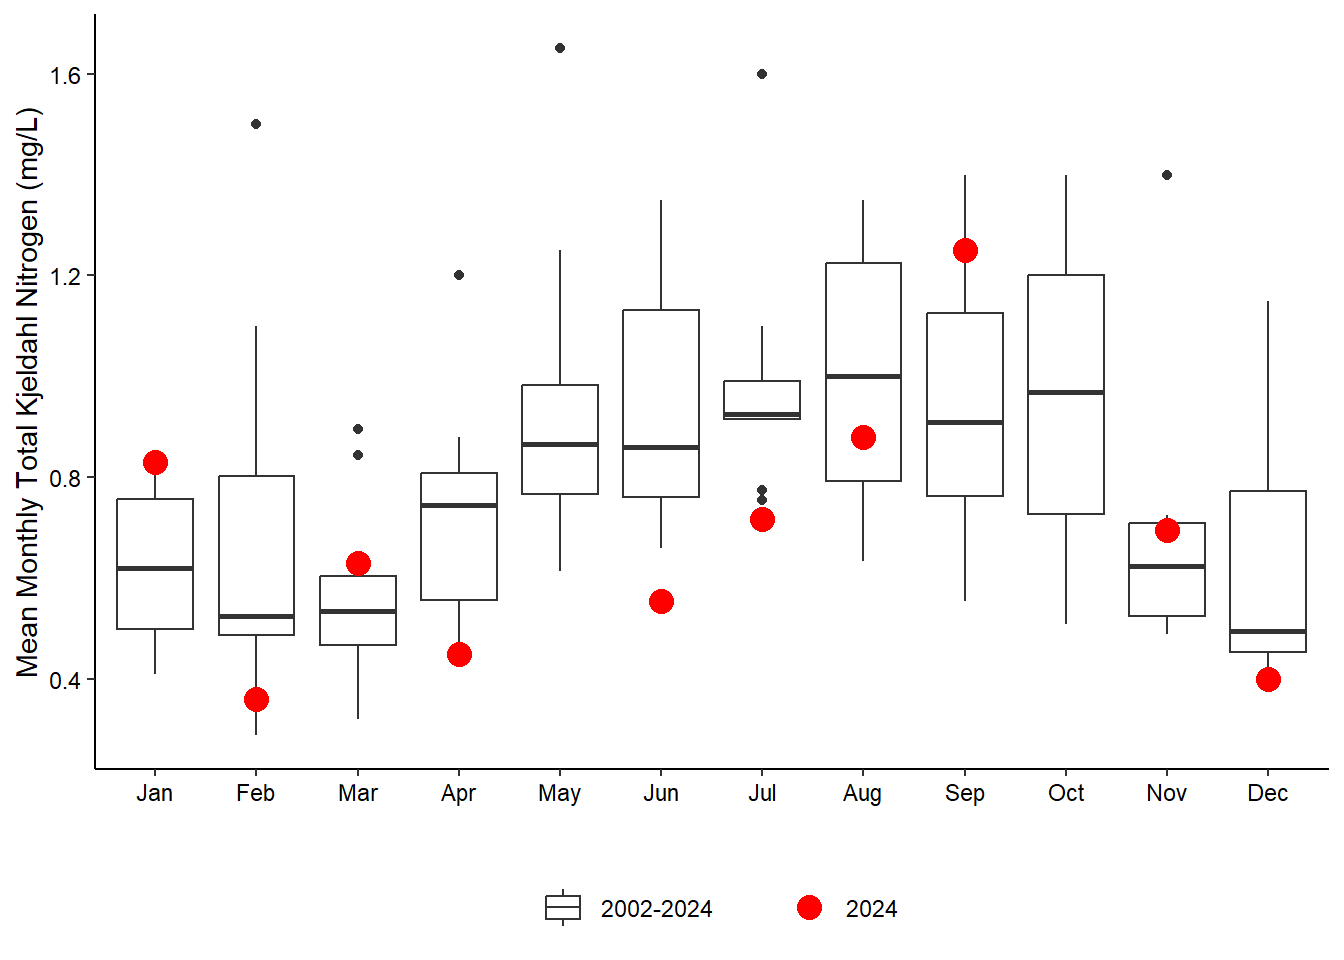
Total Kjeldahl Nitrogen (TKN) is the total concentration of organic nitrogen and ammonia and is directly measured in our samples. TKN concentrations in 2024 were highly variable and frequently deviated from the historical monthly means at all sites Figure 5.9). Pine Island concentrations were notably higher than historical average in January, March, and October, while notably lower than average in July ((Figure 5.9 (a)). San Sebastian had respectively low monthly concentrations in February, April, June, August and December (Figure 5.9 (b)). January was relatively higher than average at Fort Matanzas, while June, August and December were significantly lower than historical concentration means (Figure 5.9 (c)). Pellicer Creek had significant high and low concentrations throughout the year with very few close to historical averages (Figure 5.9 (d)).
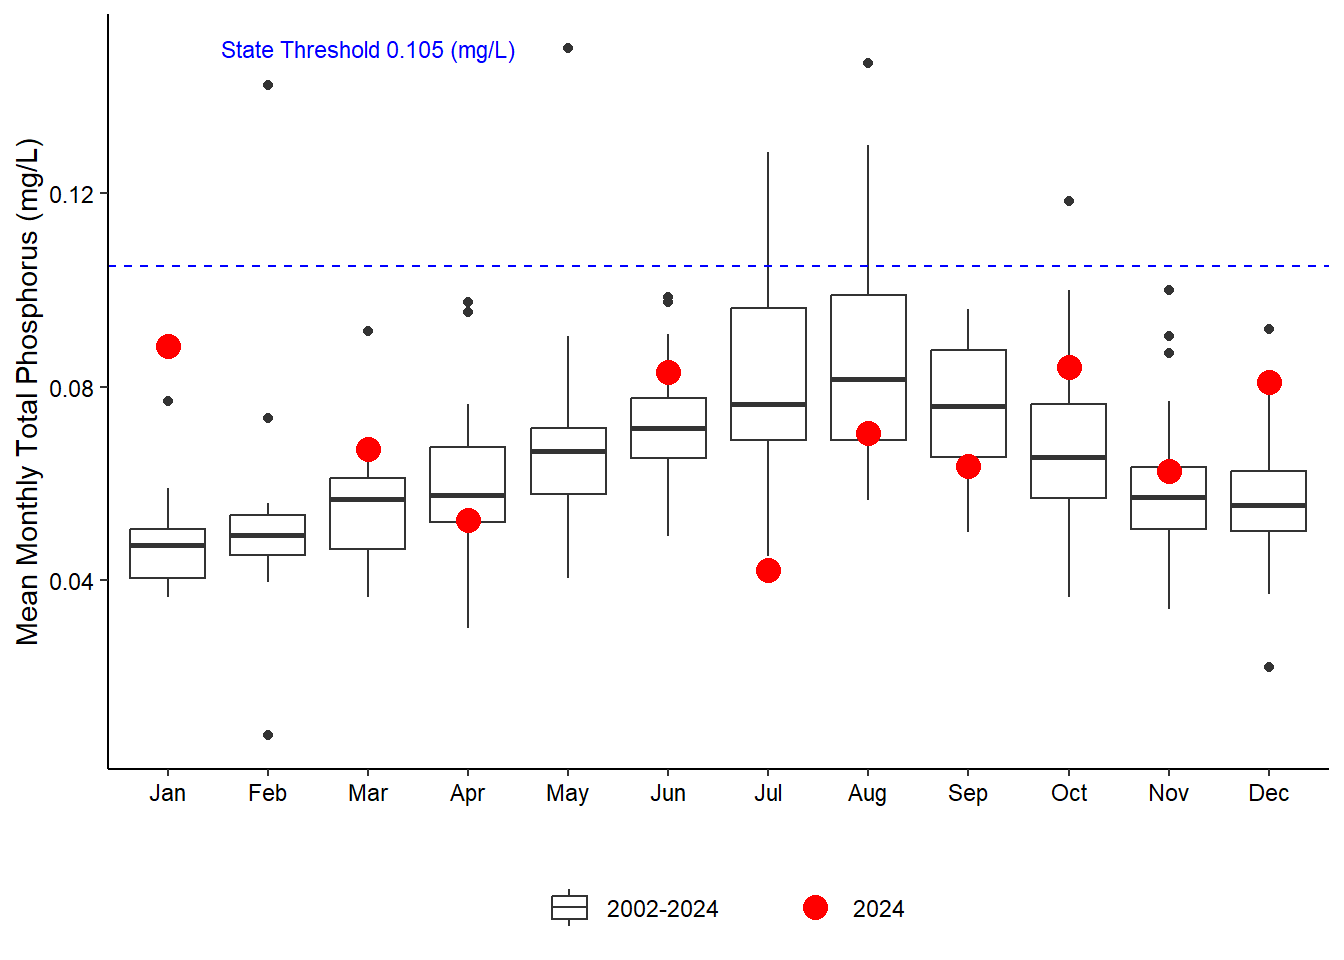
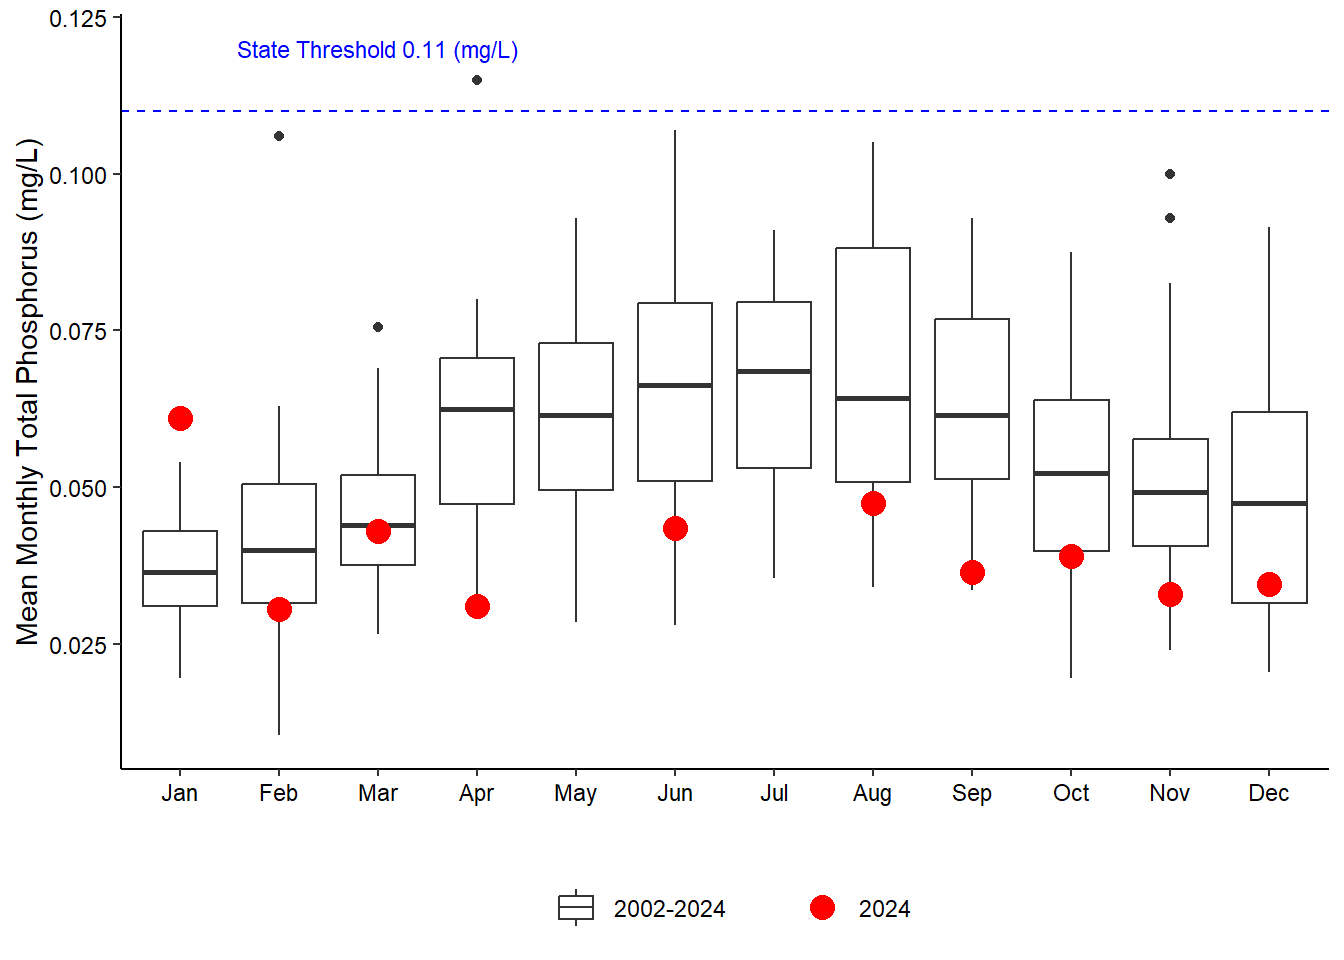
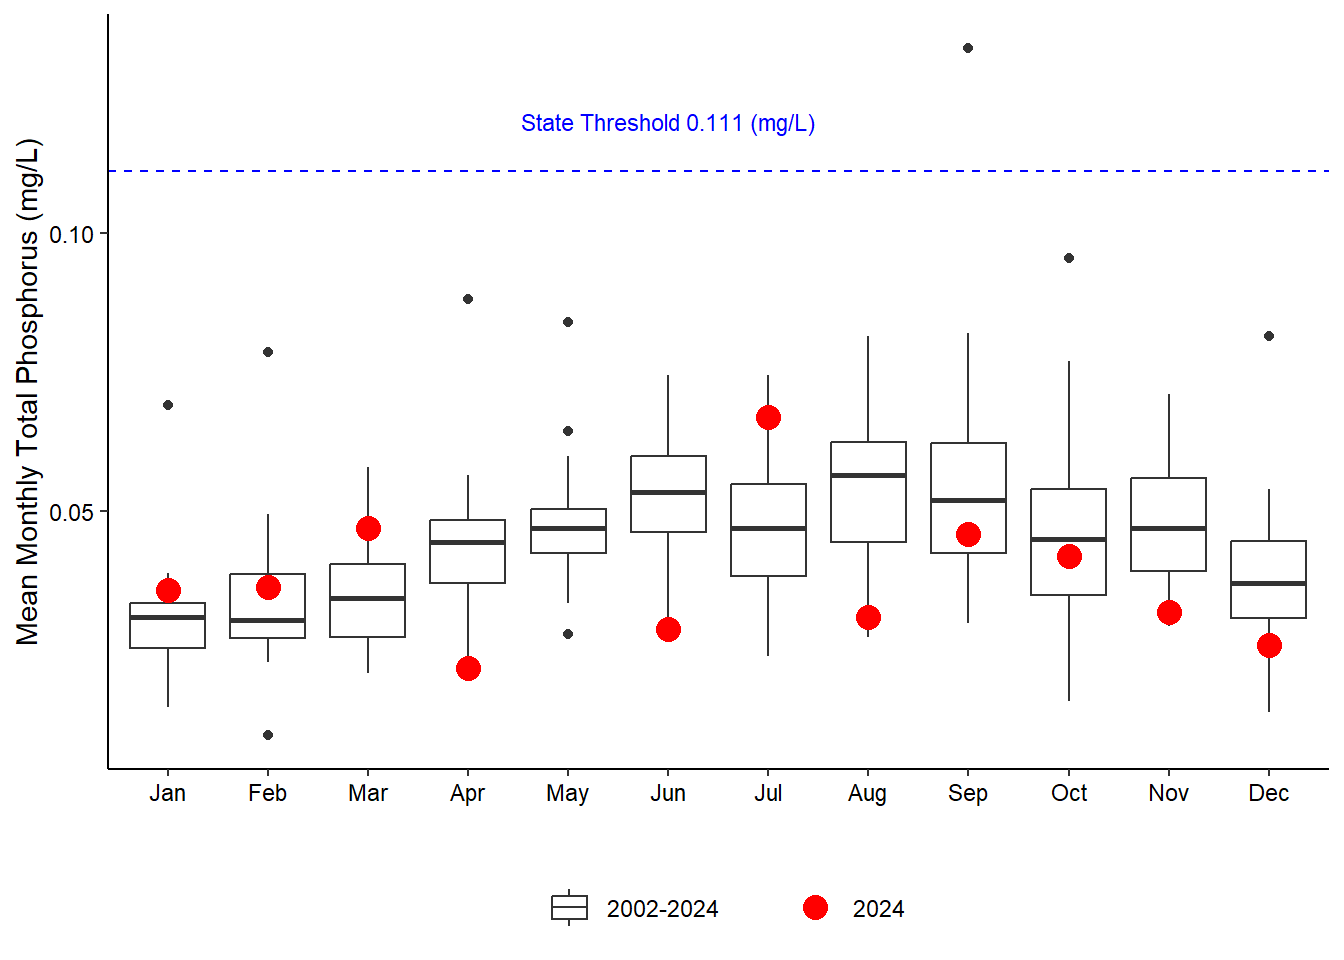
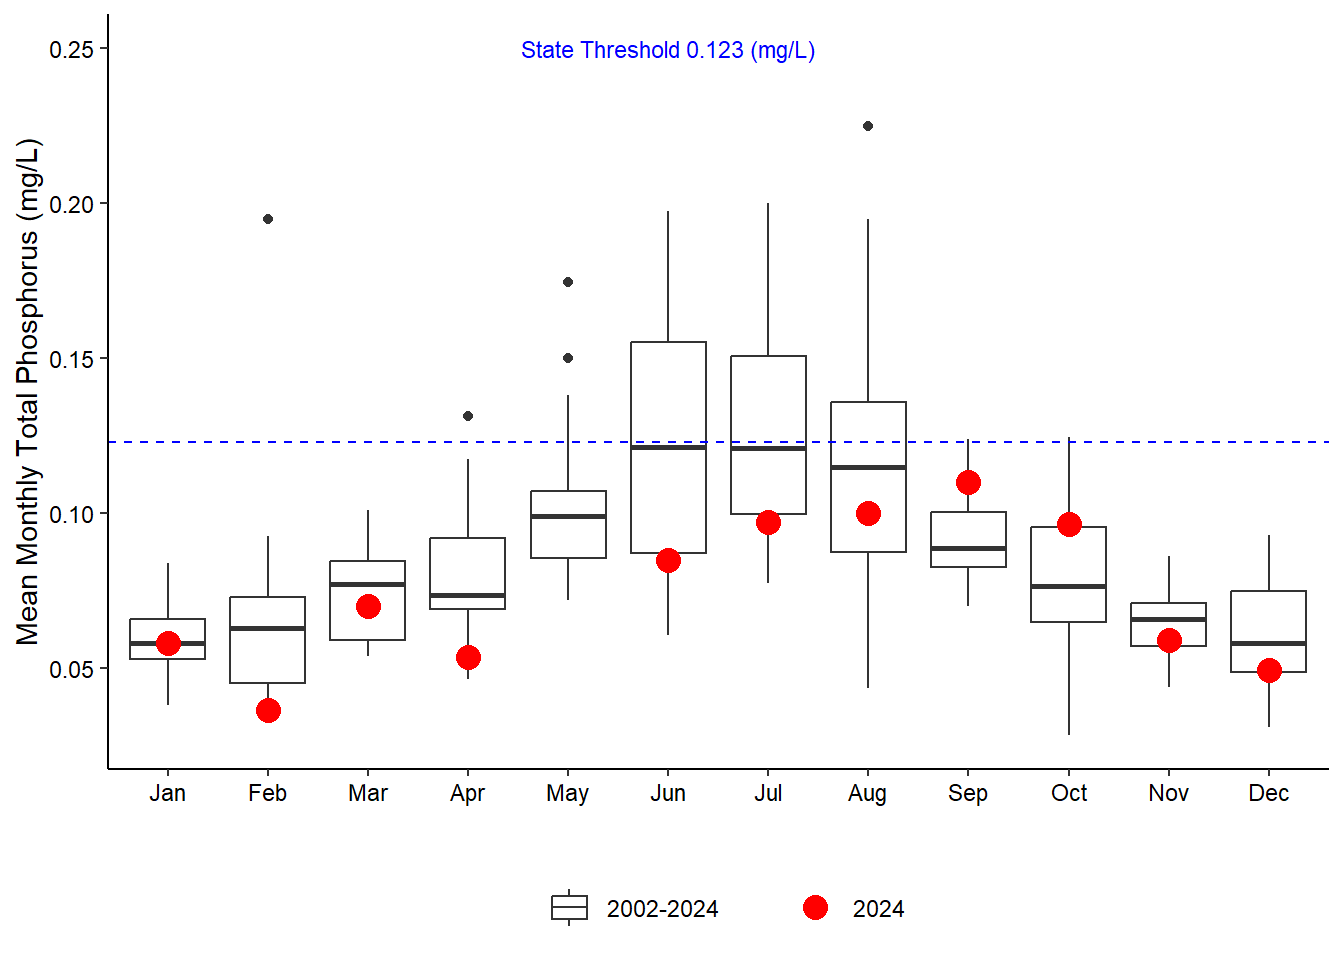
Total phosphorus (TP) concentrations were below the state threshold at all stations for each month with available concentrations during 2024 (Figure 5.10). Pine Island had highly variable mean monthly concentrations with most months being notably higher or lower than average (Figure 5.10 (a)). Pellicer Creek concentrations were largely below average for 2024, with only January having an average value, and September and October being above average (Figure 5.10 (d)). Most monthly concentrations at San Sebastian were significantly less than average, except for an above average January and an average March (Figure 5.10 (b)). Fort Matanzas concentrations fell mostly below average, while quarter 1 and July were above average. (Figure 5.10 (b); Figure 5.10 (c)).
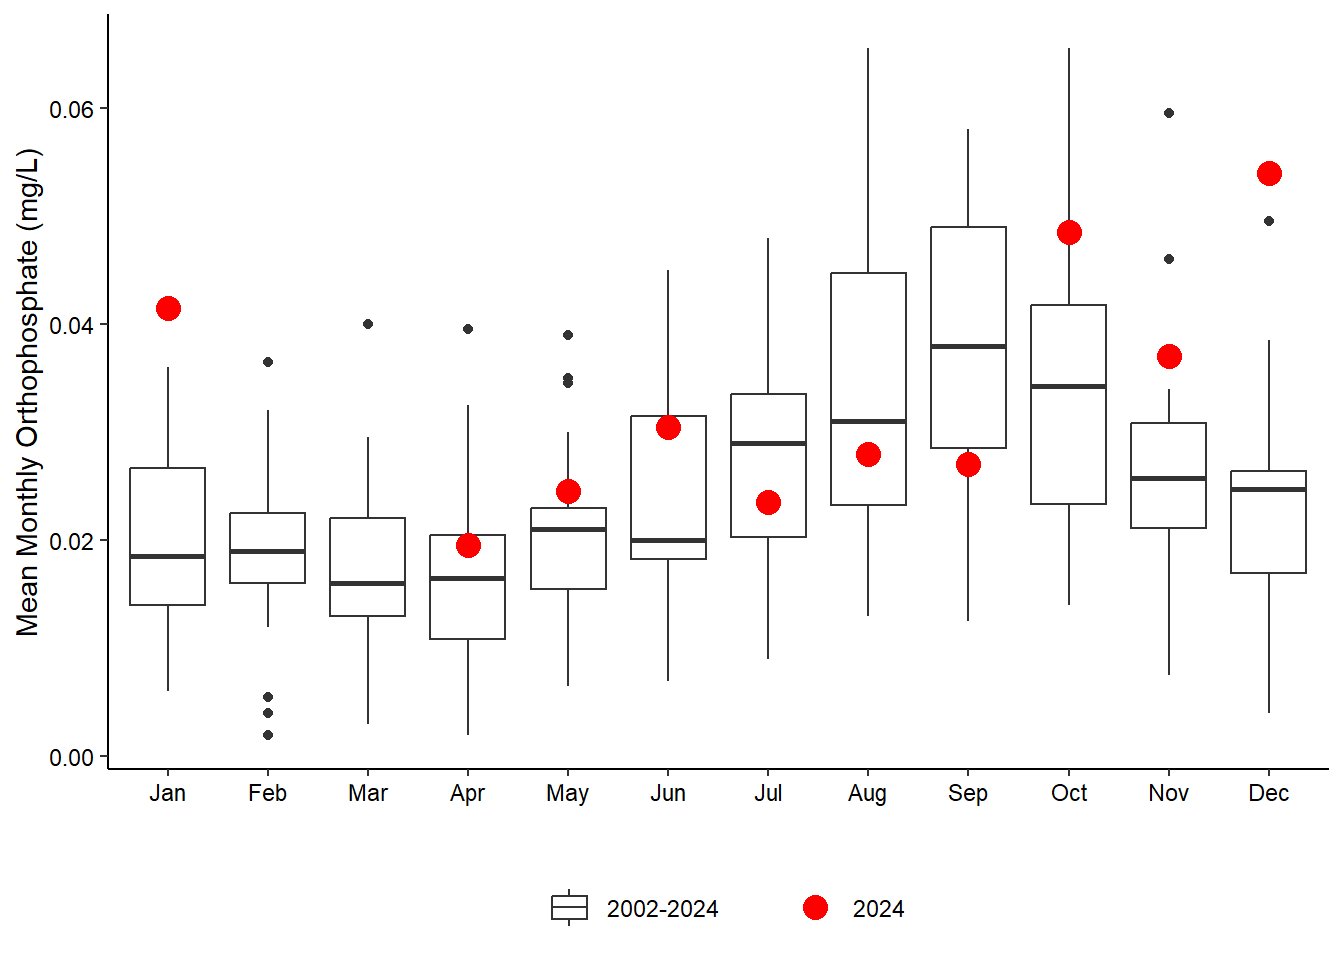
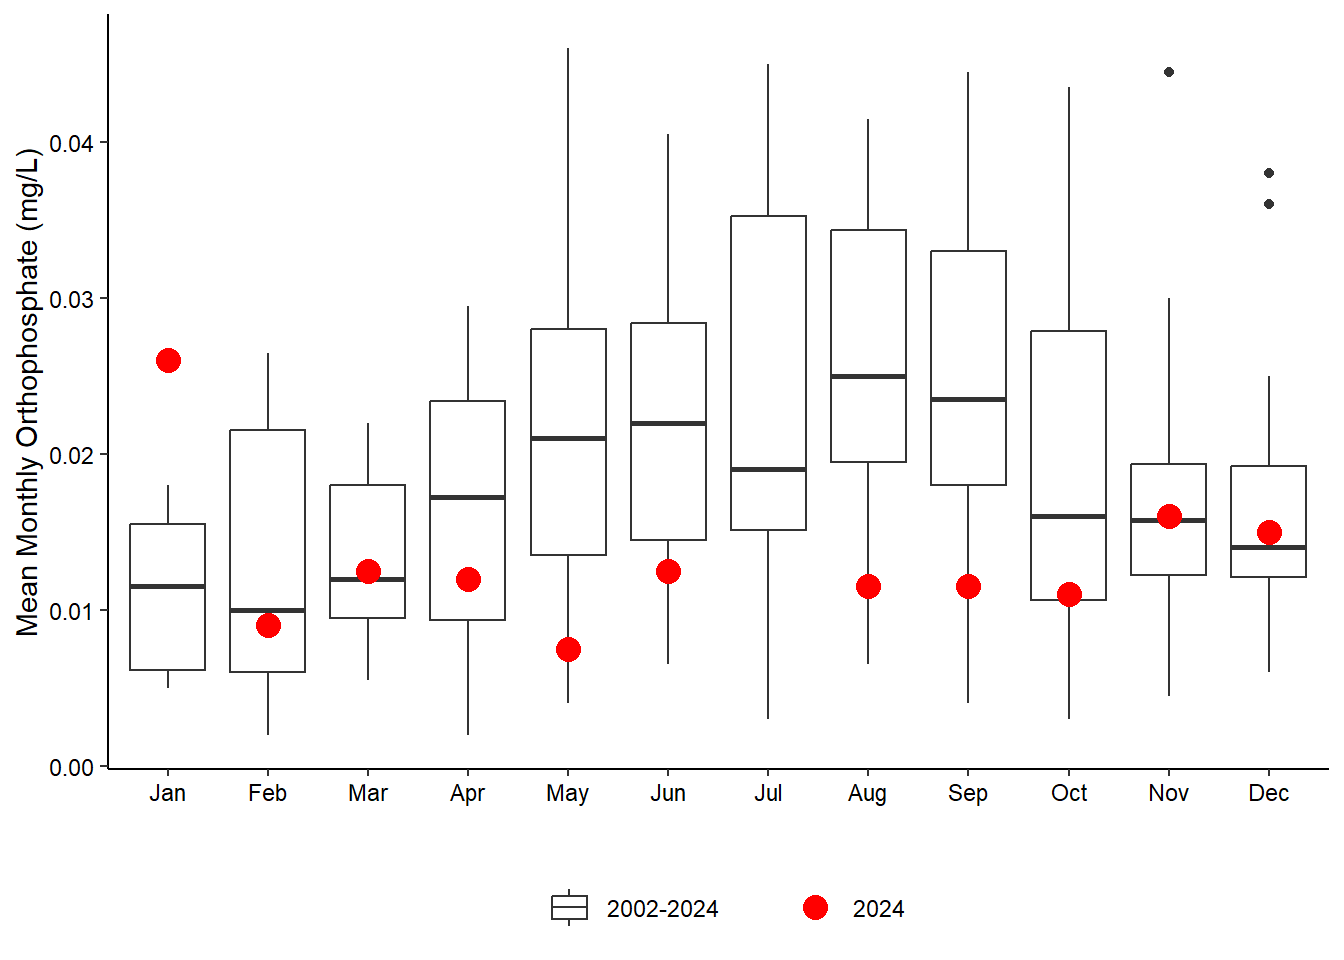
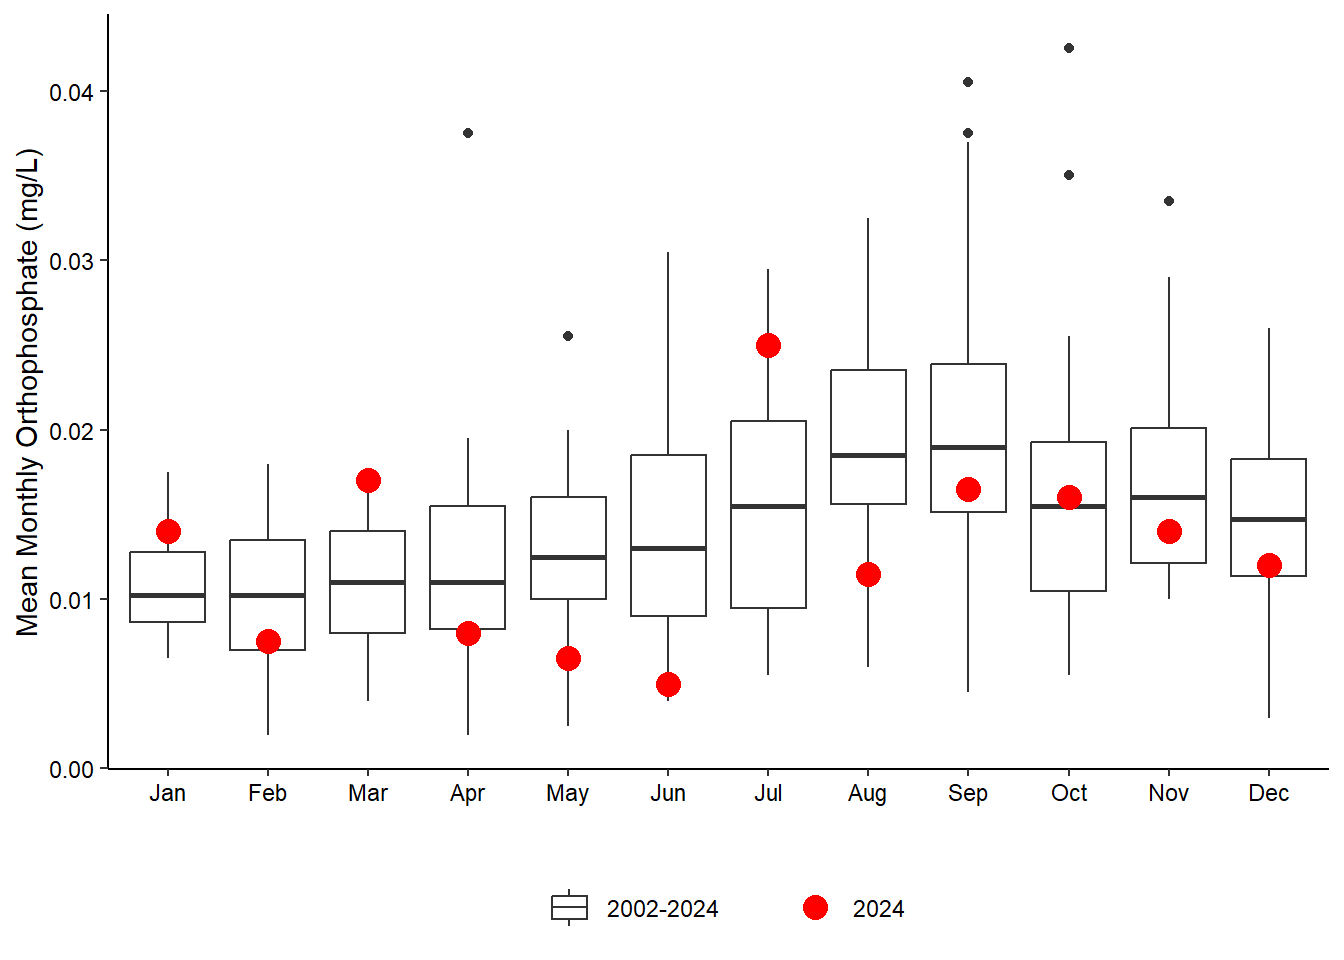
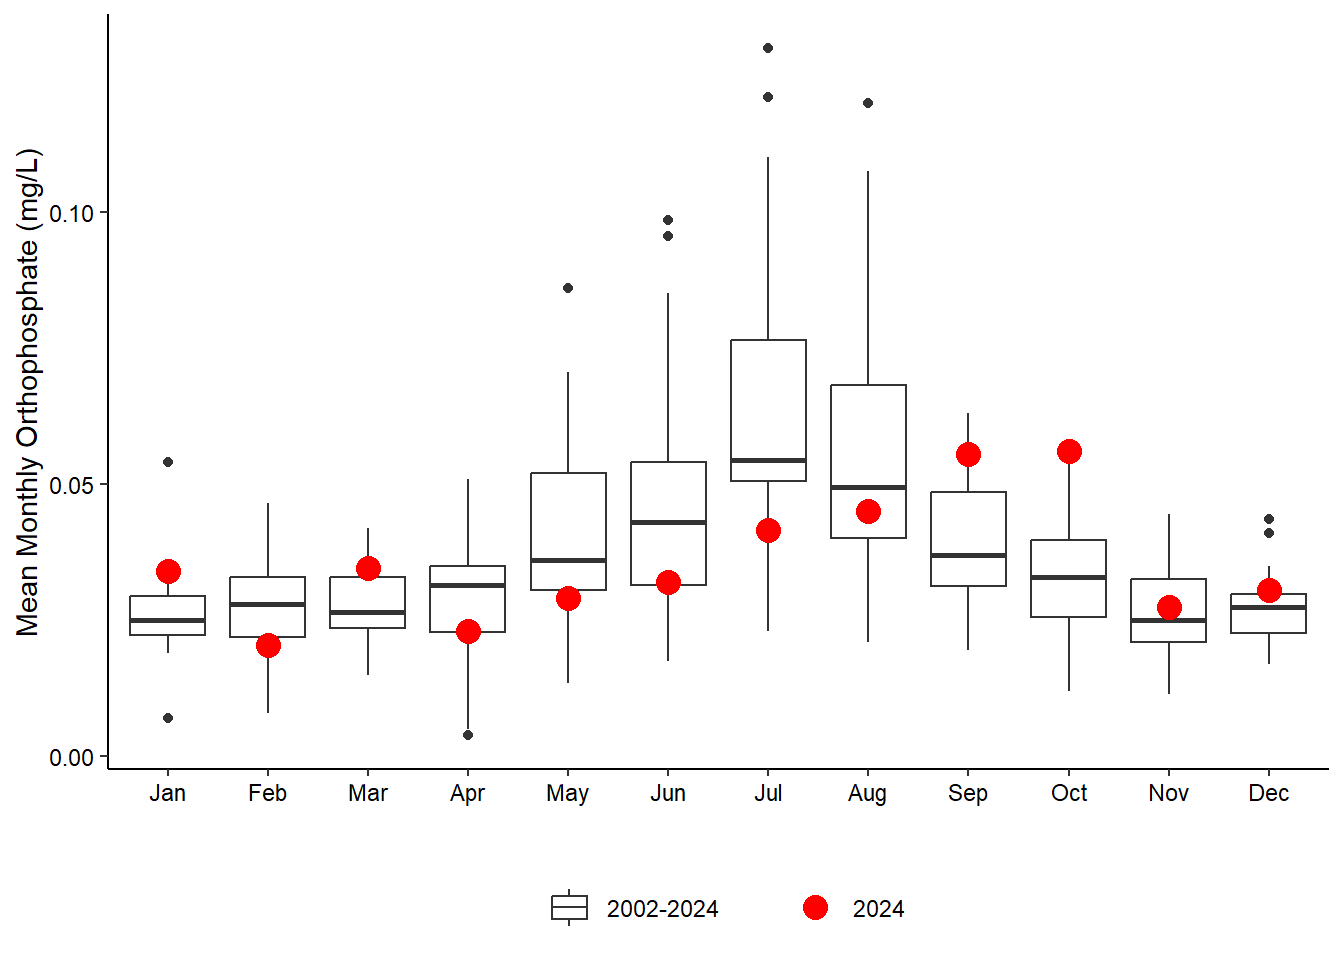
Pine Island orthophosphate concentrations were relatively stable from April to September in 2024, though they fell both above and below historical monthly averages, while January and all of quarter 4 had significantly higher monthly averages (Figure 5.11 (a)). April – October at San Sebastian had significantly below-average monthly means, with February- March and November- December being near historical average, and January well above historical average (Figure 5.11 (b)). Pellicer Creek had a steady monthly mean increase from April to October of 2024 with concentrations falling below average for all except September- October. Quarter 1 concentrations were relatively high (January and March) and low (February), while November and December’s concentrations fell just above historical mean (Figure 5.11 (d)). Fort Matanzas had the most highly variable mean monthly concentrations, with only October being near average and all other months falling higher or lower than historical data (Figure 5.11 (c)).
5.2 Data
5.2.1 Dissolved Oxygen
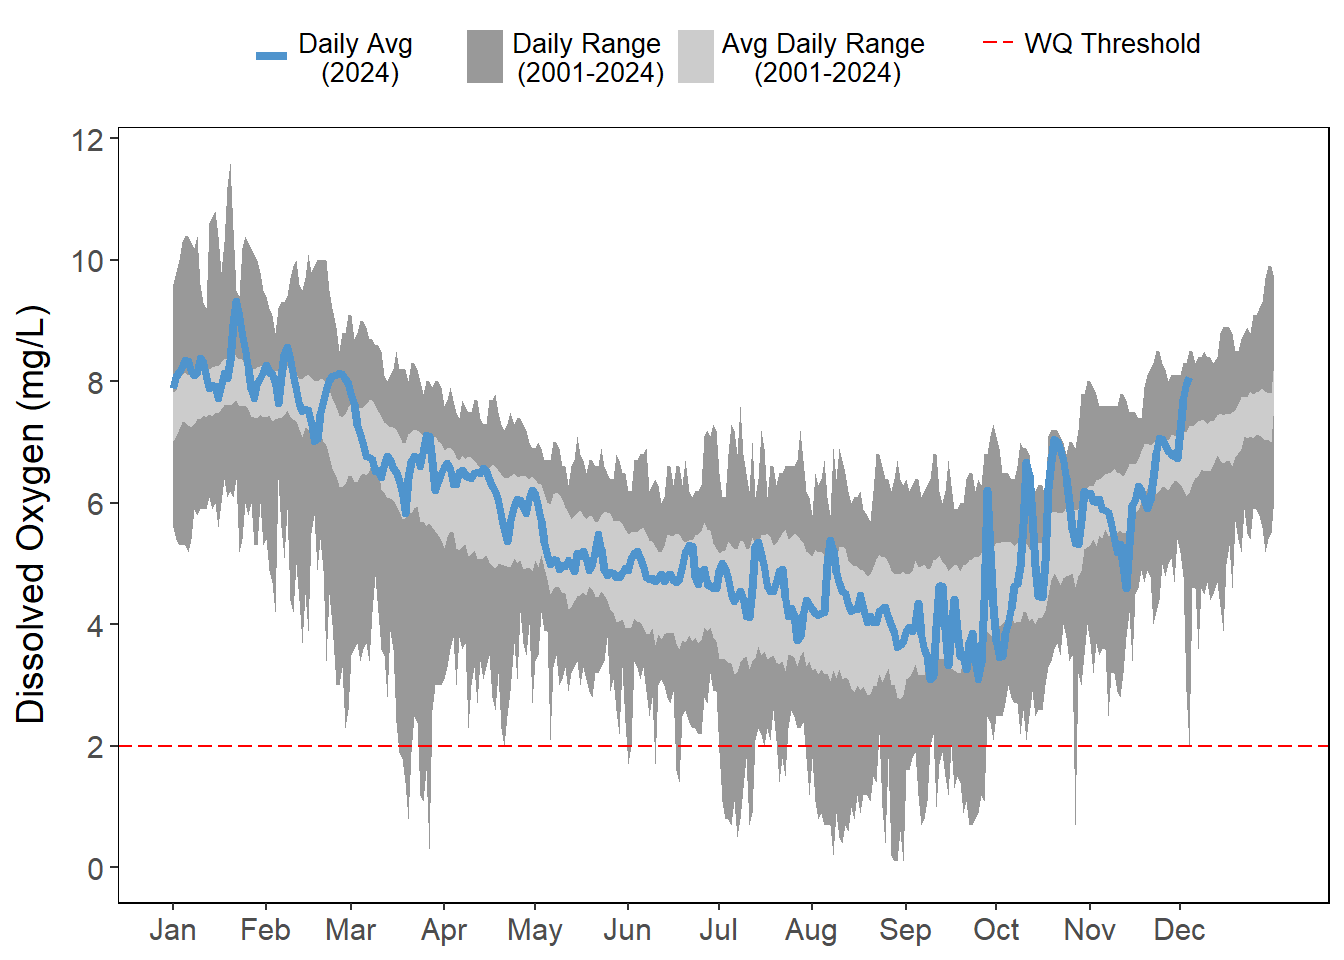
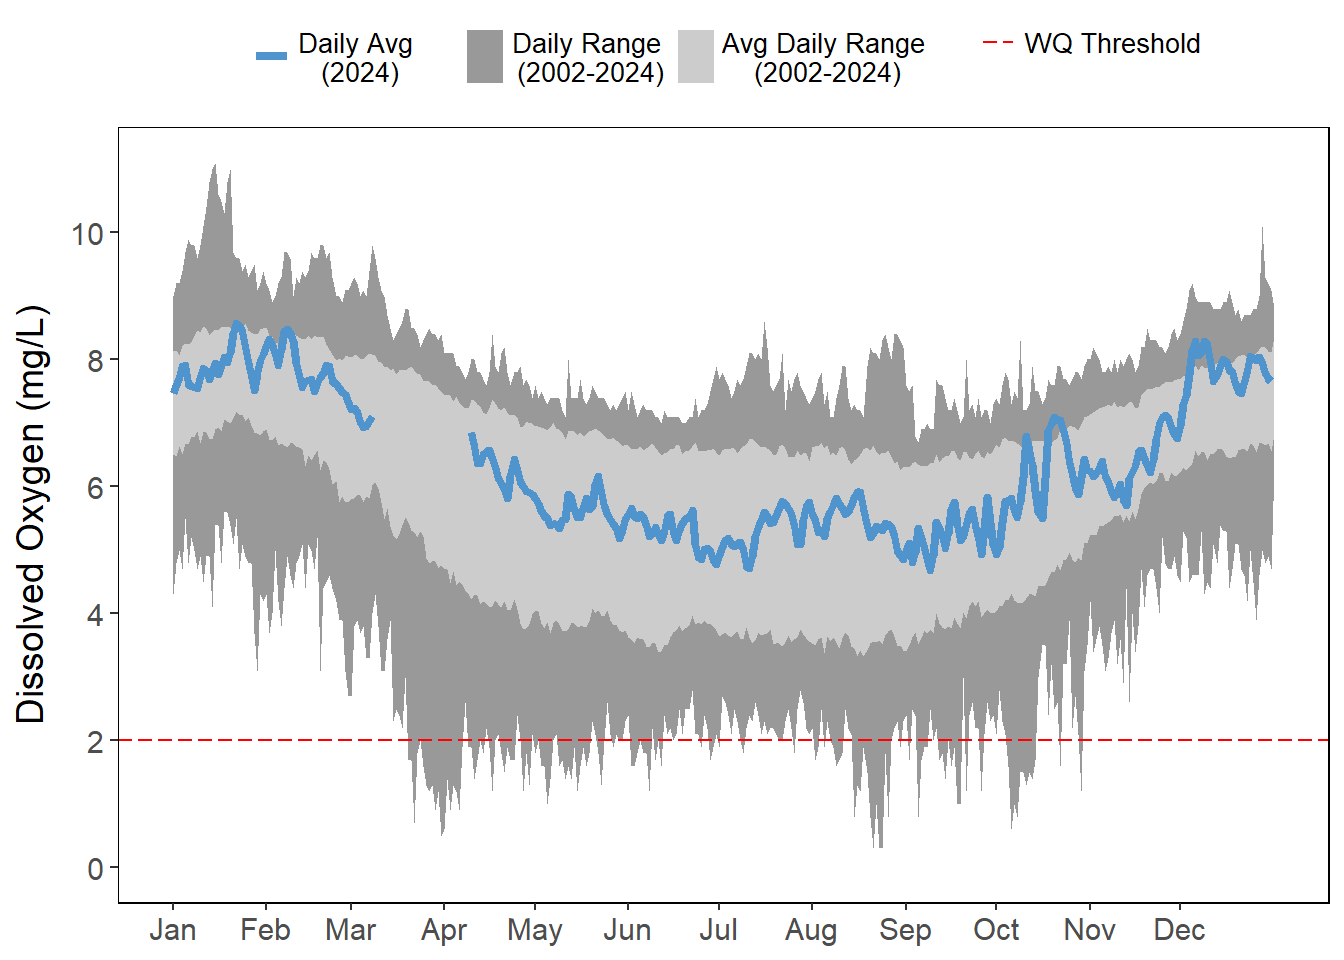
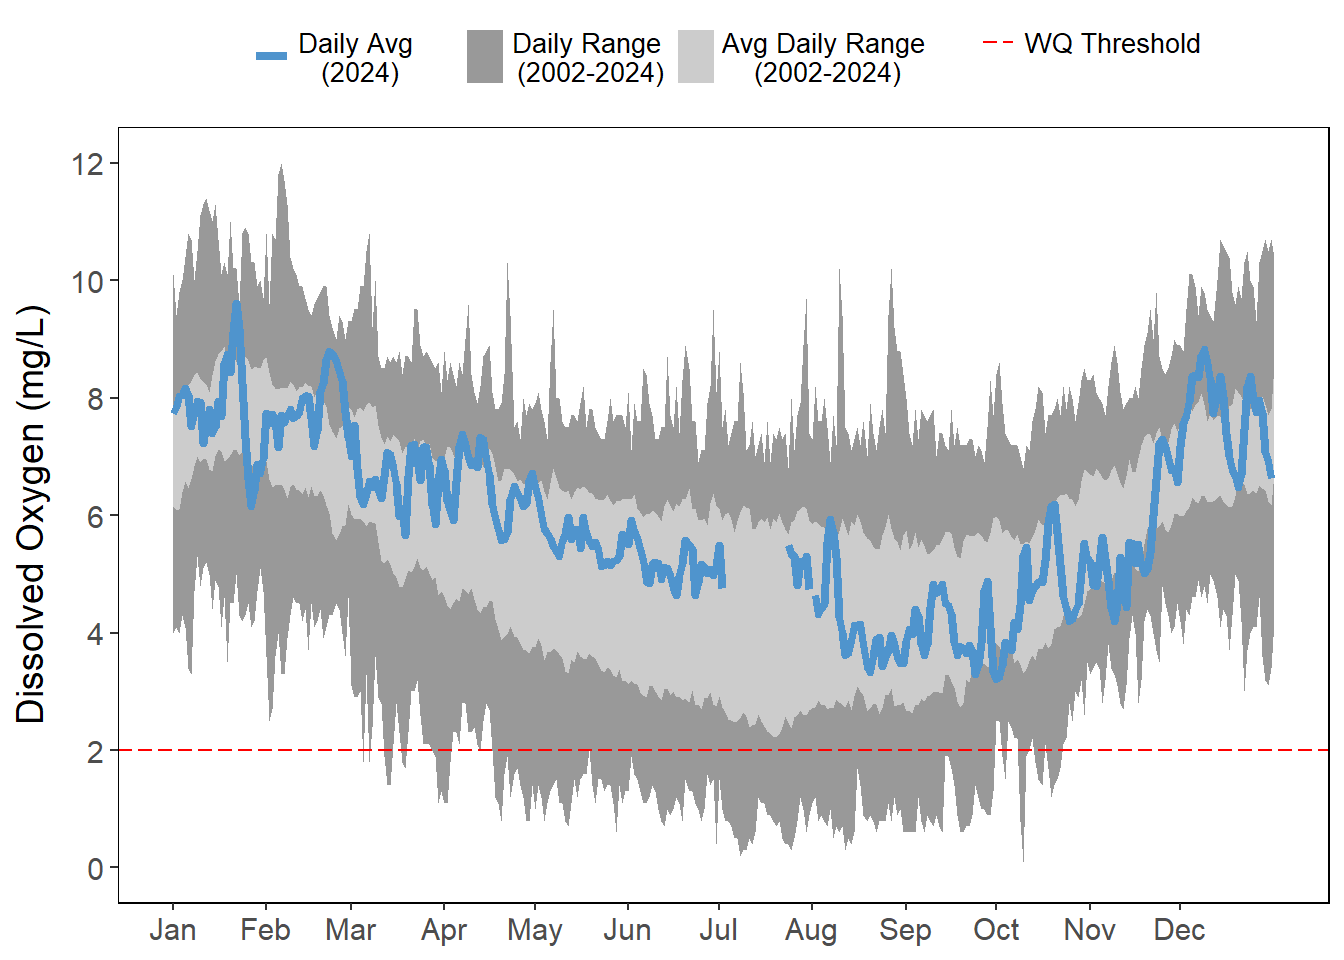
#Dissolved oxygen at Pine Island has been uncharacteristically low in the past two years.
#Pellicer Creek is located within a waterbody with known impairments for dissolved oxygen, chlorophyll a, and fecal coliform bacteria. As such, this station frequently experiences low dissolved oxygen values, particularly in the summer months (Figure 5.3).
5.2.2 Chlorophyll a
5.2.3 Nitrogen
5.2.3.1 Total Nitrogen
5.2.3.2 Ammonium
5.2.3.3 Nitrite + Nitrate
5.2.3.4 Total Kjeldahl Nitrogen
5.2.4 Phosphorus
5.2.4.1 Total Phosphorus
5.2.4.2 Orthophosphate