| Month | Year | Total Precipitation (mm) |
|---|---|---|
| May | 2009 | 451.0 |
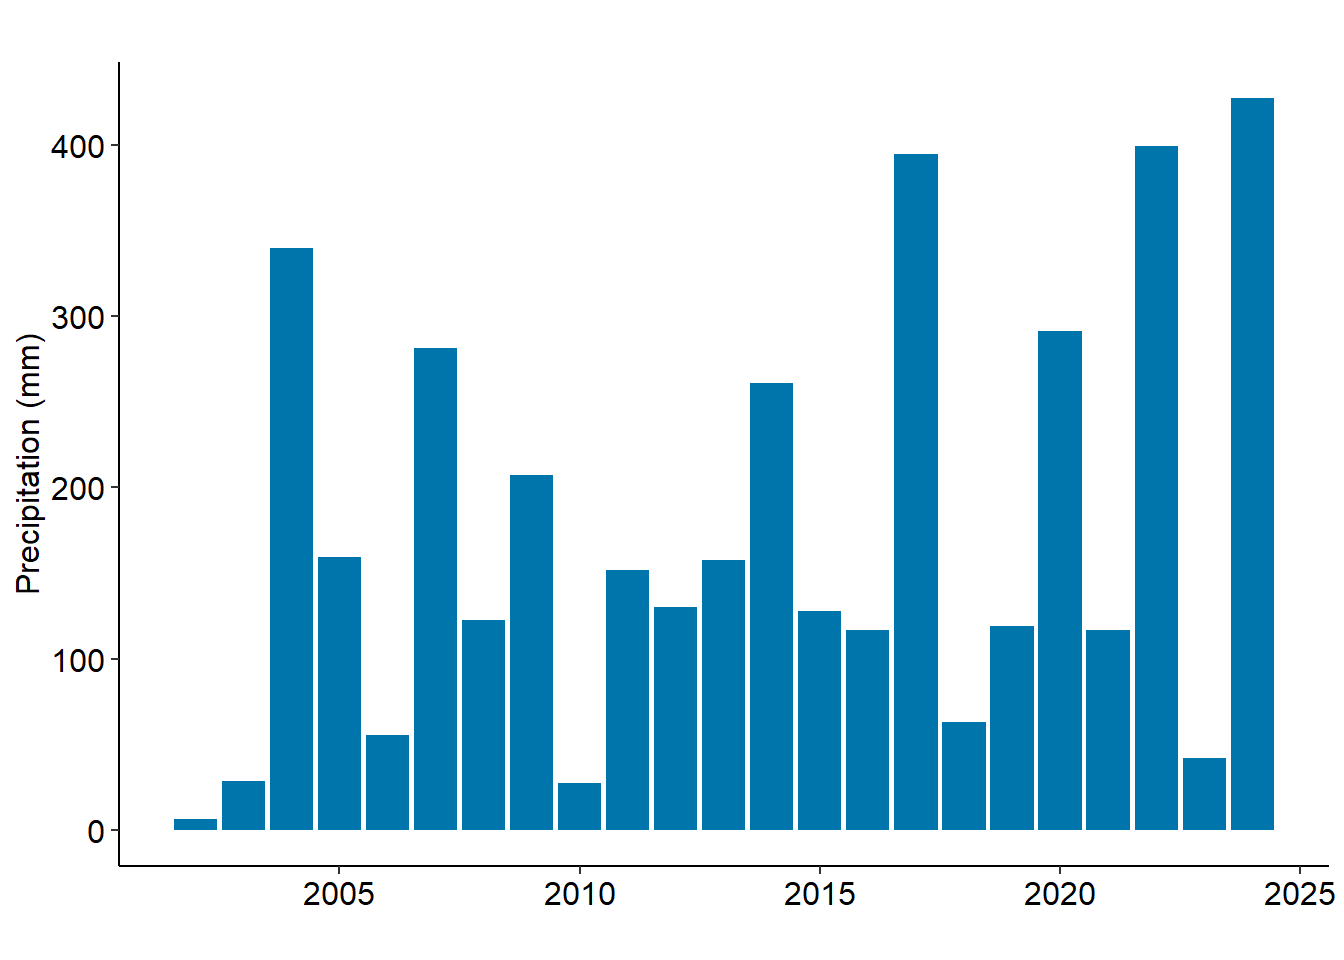
| Sep | 2024 | 427.1 |
| Sep | 2022 | 399.3 |
| Sep | 2017 | 394.4 |
| Sep | 2004 | 339.9 |
4 Environmental
The following includes variables that establish the estuarine setting: rainfall, light intensity, water temperature, and salinity. These variables are driven primarily by climatic patterns and largely influence water quality, biological processes, and habitat condition.
4.1 Summary
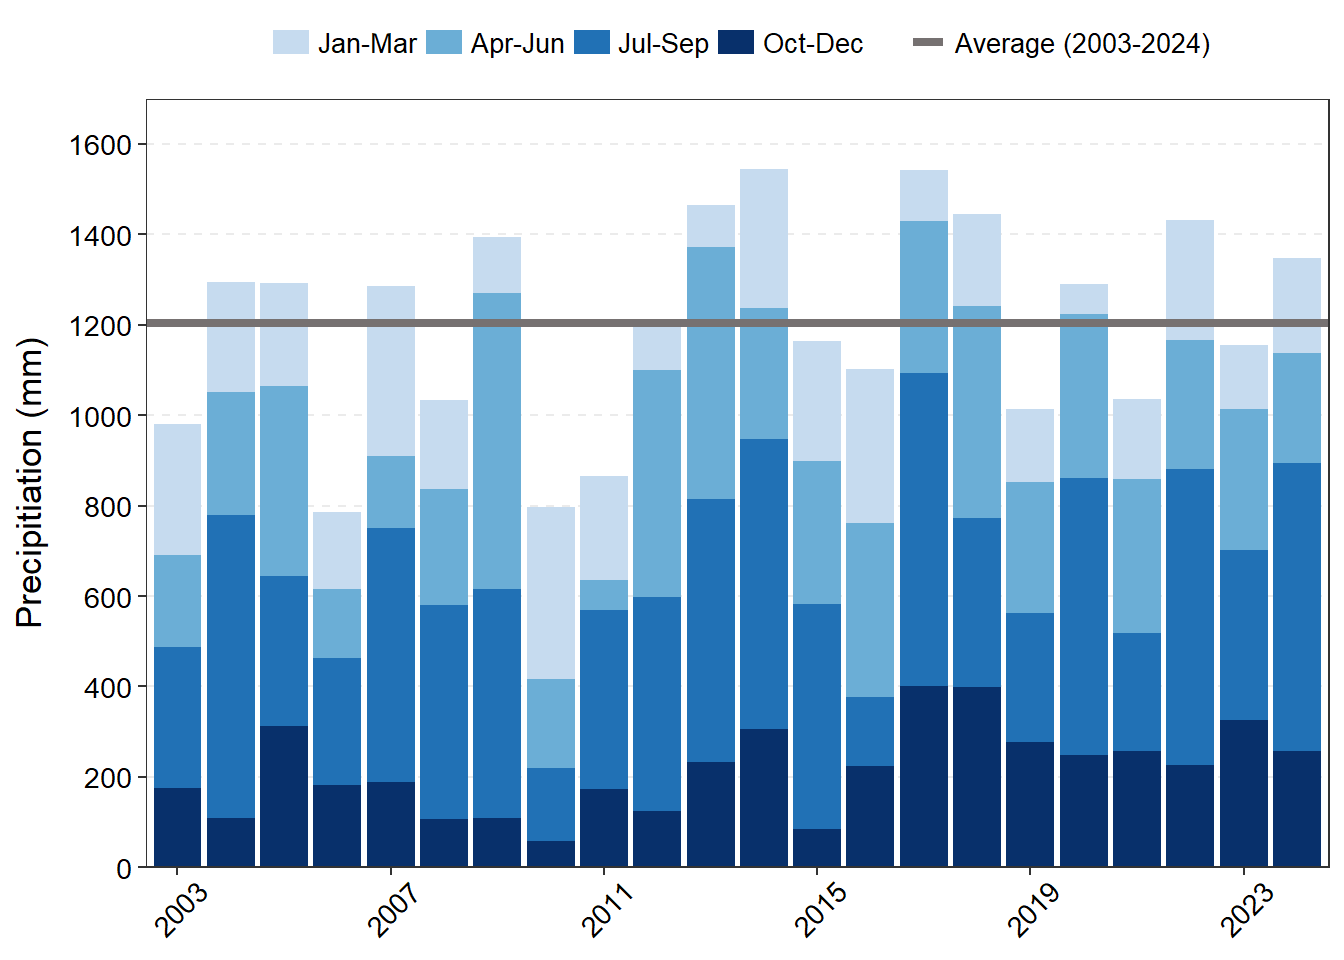
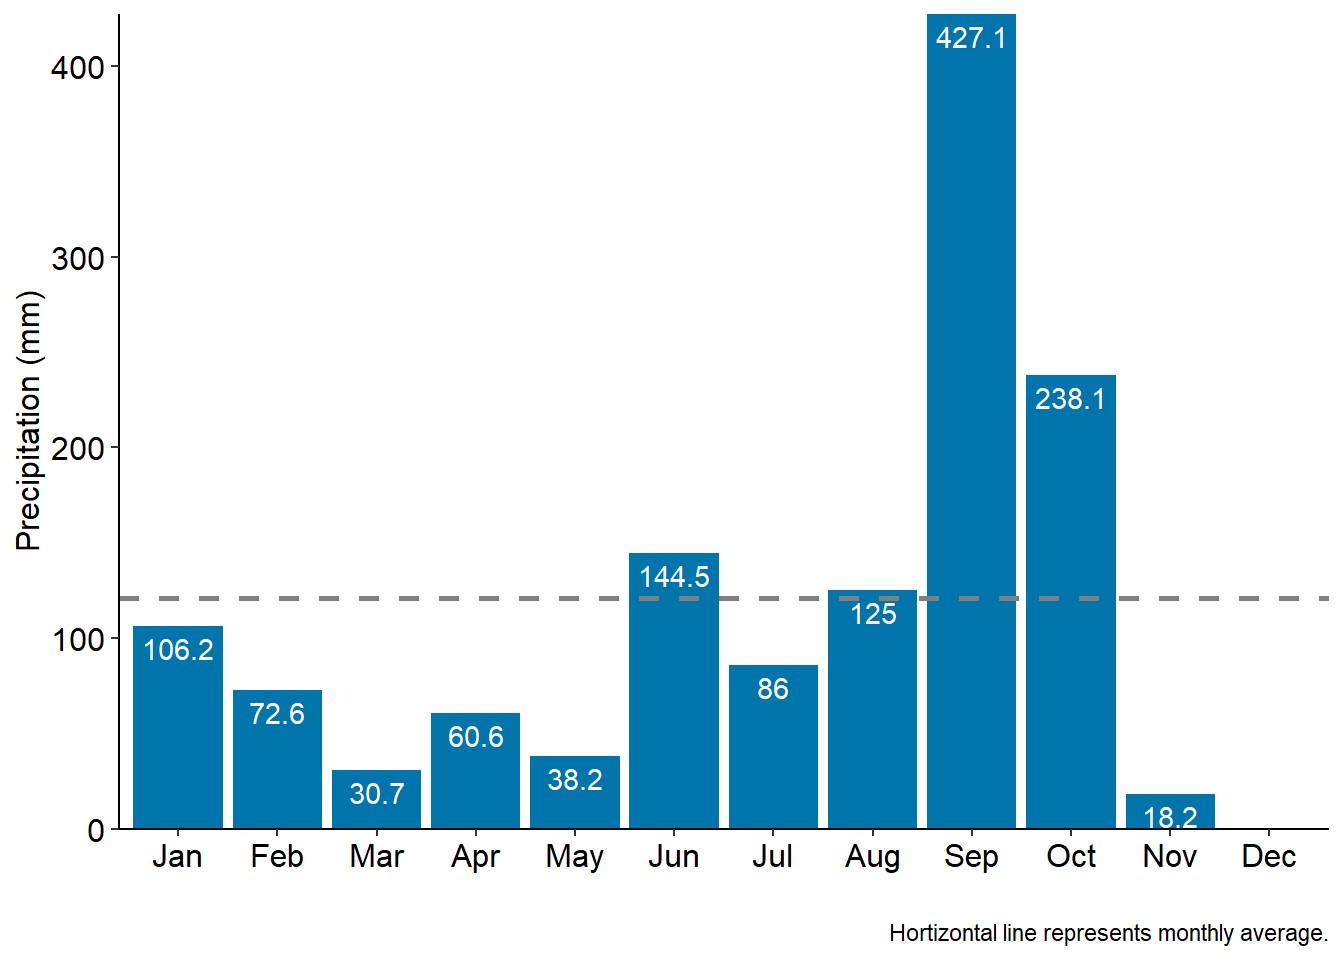
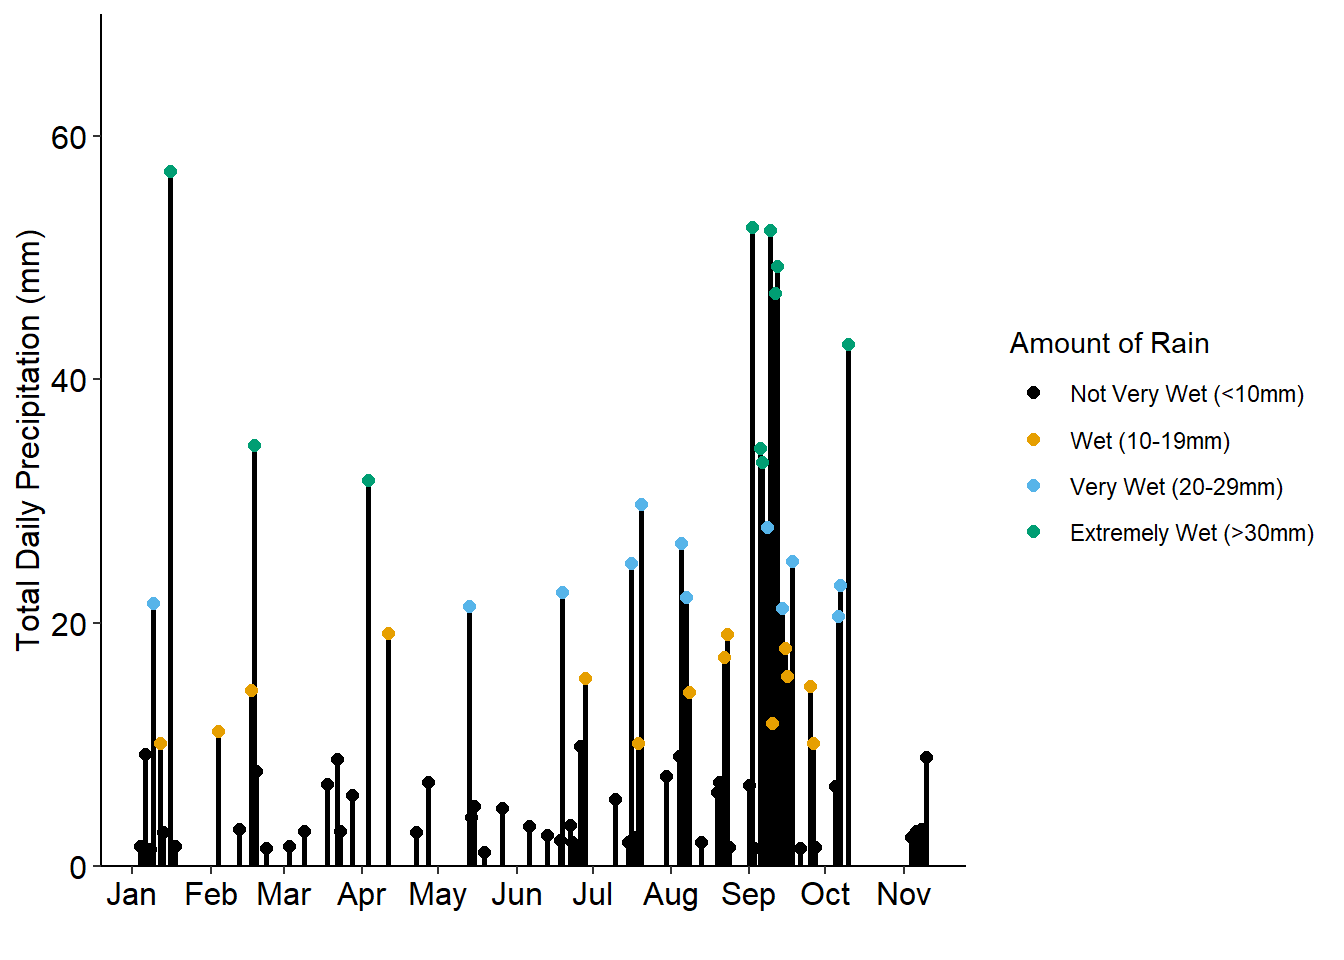
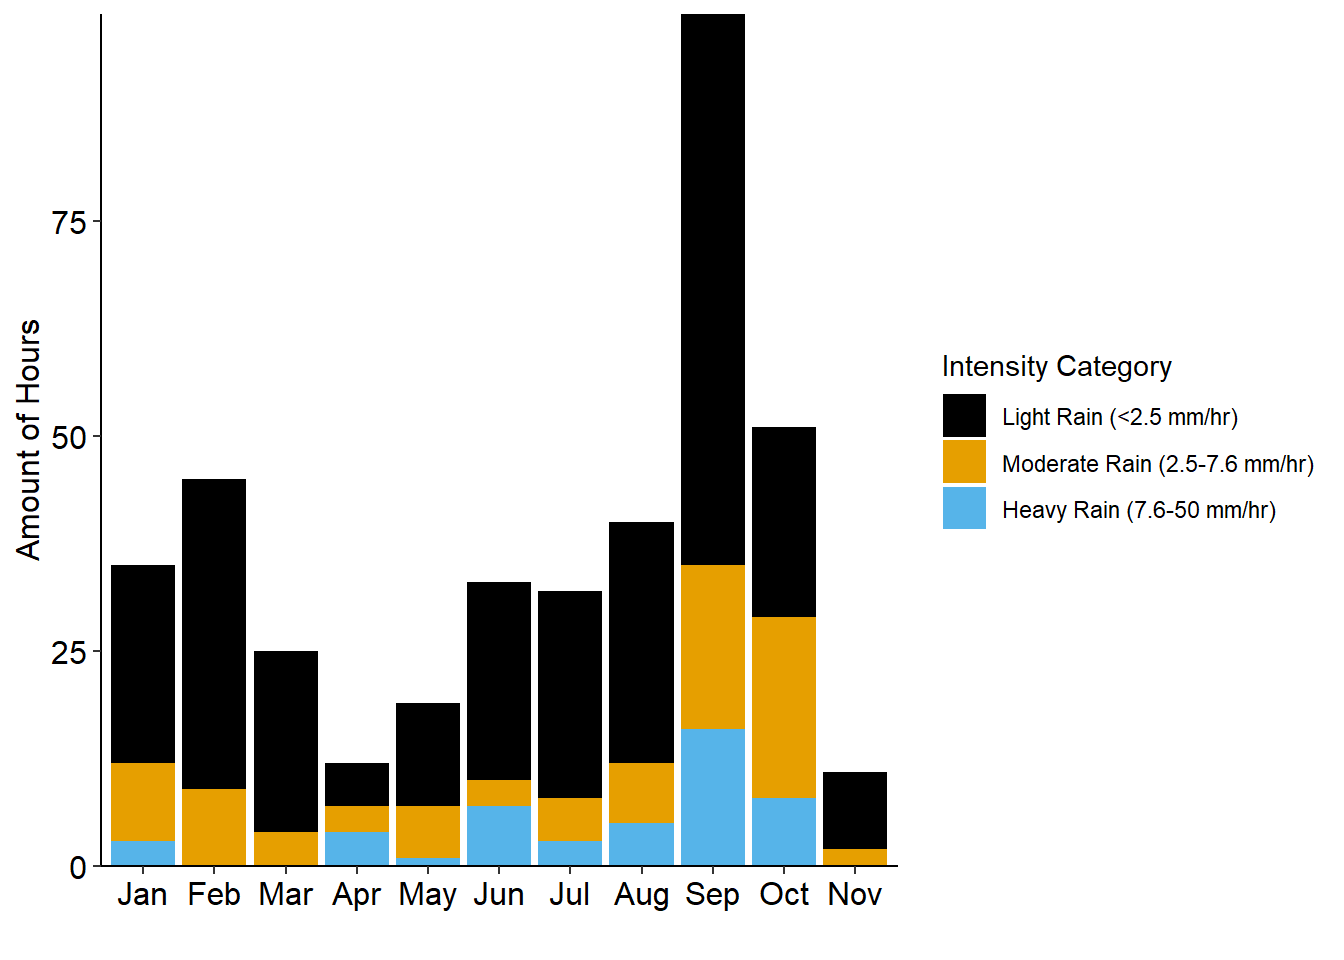
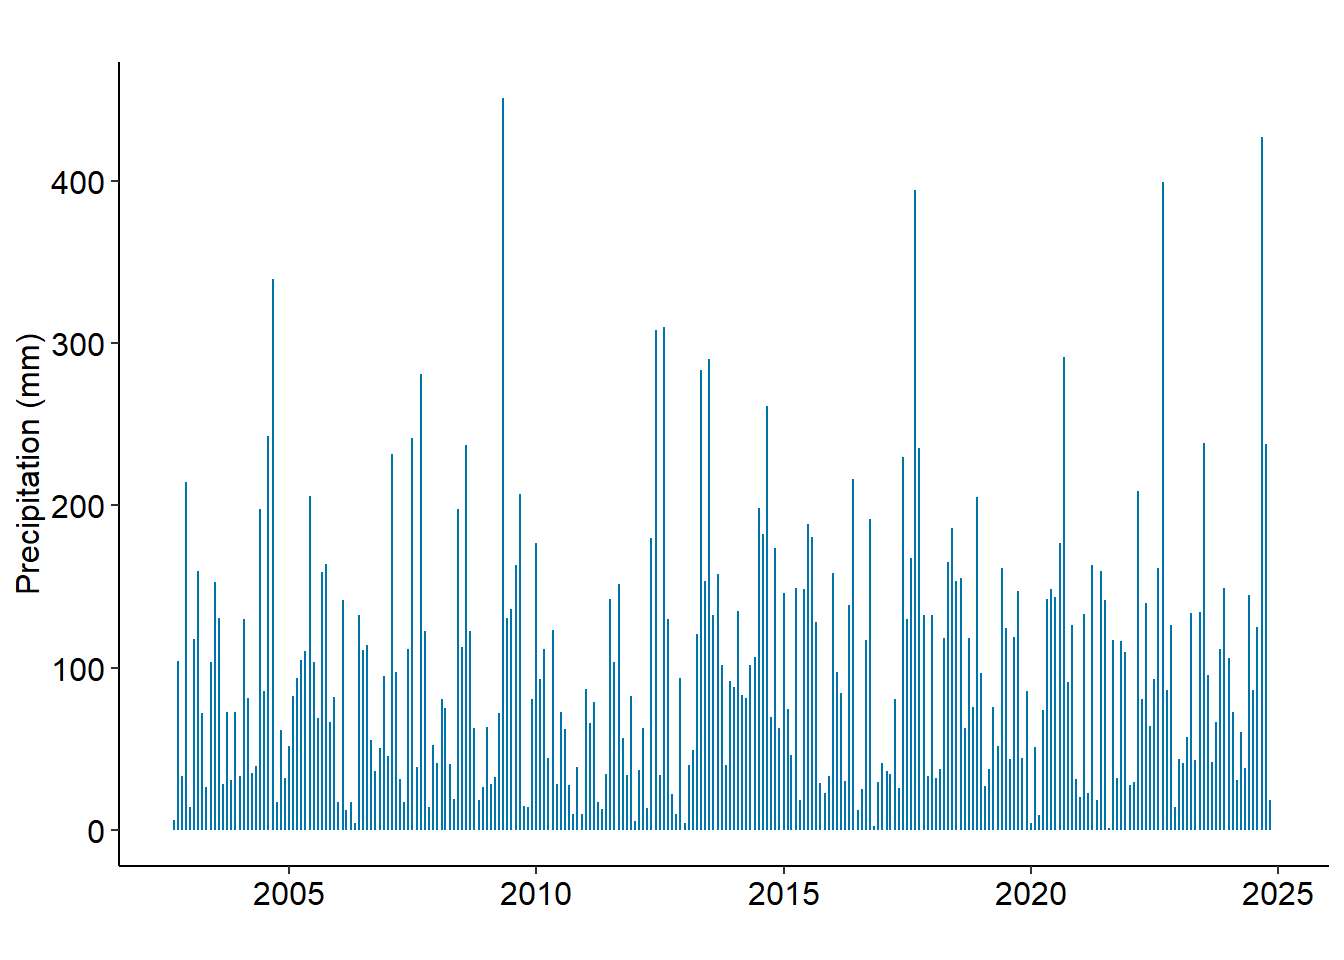
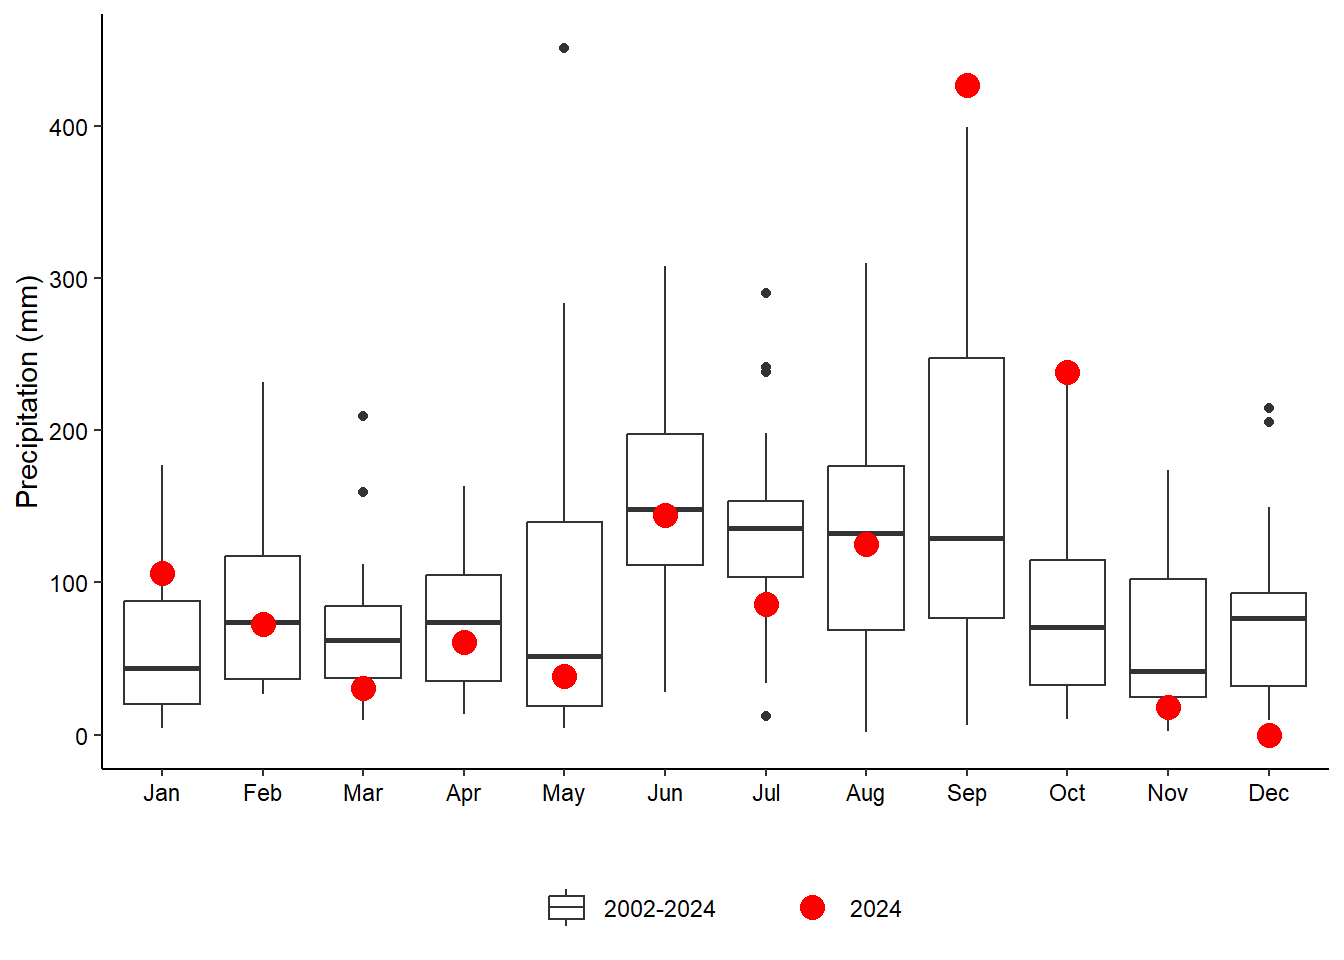
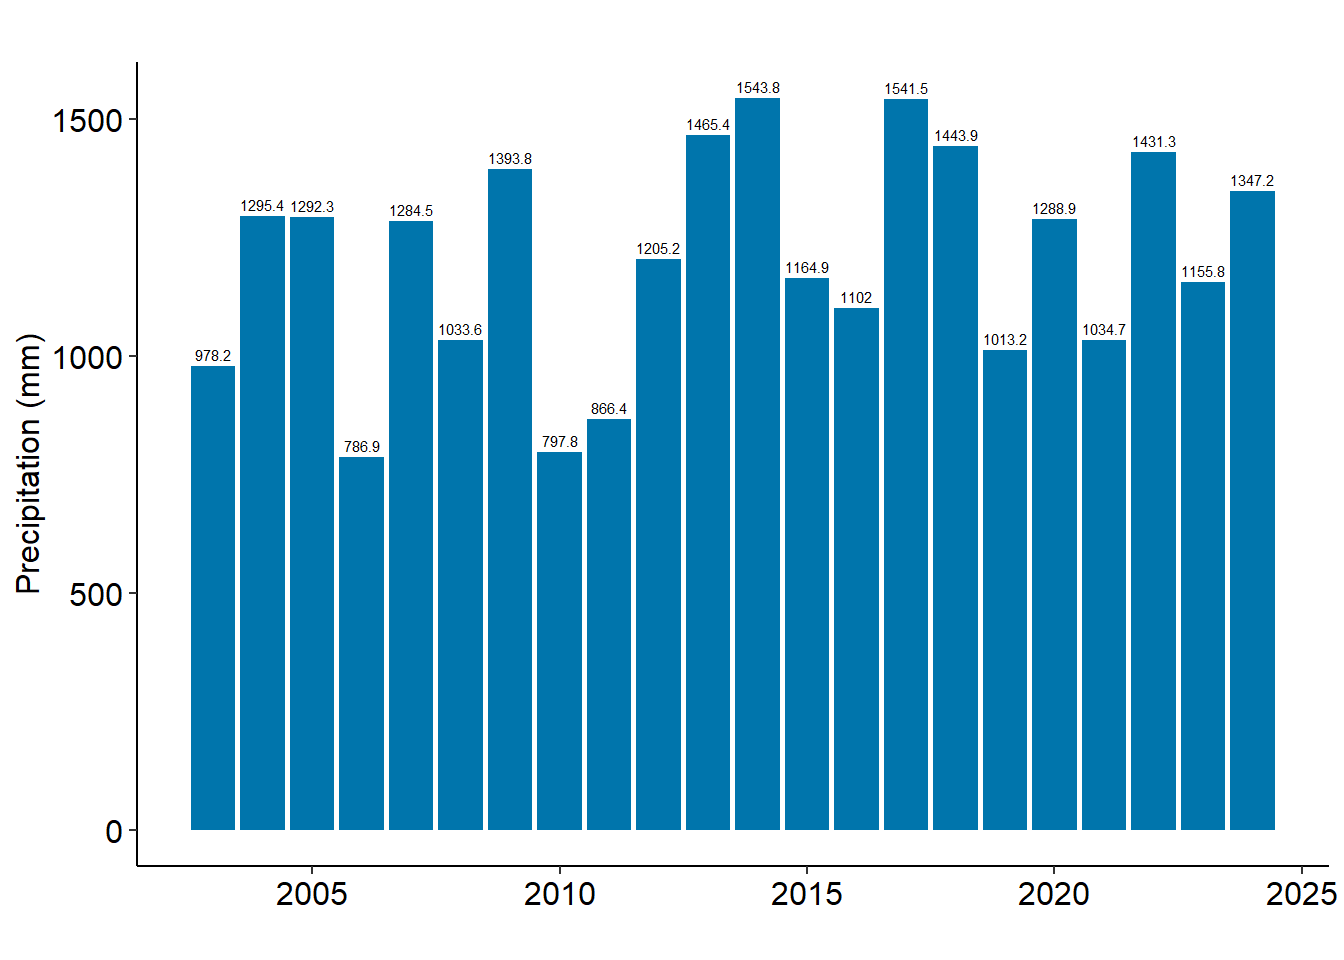
Total measured rainfall in 2024 was 1347.2 mm (Figure 4.2 (c)). The third quarter of the year had the greatest rainfall total (Figure 4.1) because of September, which had a record-setting high monthly total (Table 4.1; Figure 4.2 (a); Figure 4.2 (b)). September also had the greatest number of rain days exceeding 10 mm/day (Figure 4.1 (c)), and more storms producing heavy rainfall (Figure 4.1 (d)). Rainfall totals for the fourth quarter of 2024 are incomplete, resulting from a computer program error. Data are missing beginning November 13, 2024, and continuing through the end of the year (see Maintenance Notes Section 8.2.2; Figure 4.2 (d)).
Light intensity was highest from April to August. December had the lowest mid-day photosynthetically active radiation (PAR) (Figure 4.3).
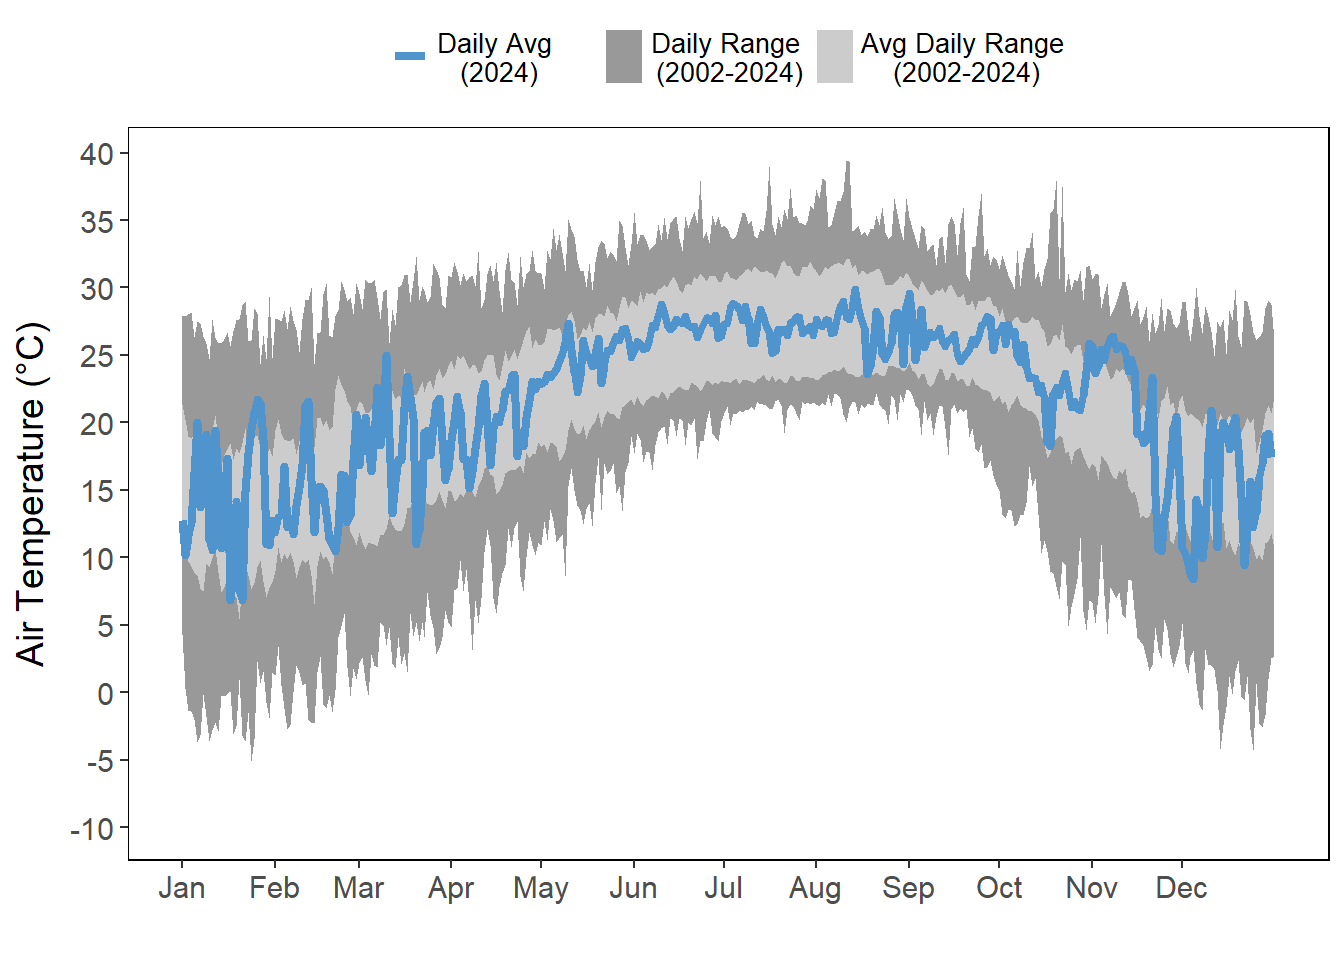
Daily average air temperatures were highest from June - August, and most variable during January – April and November – December (Figure 4.4).
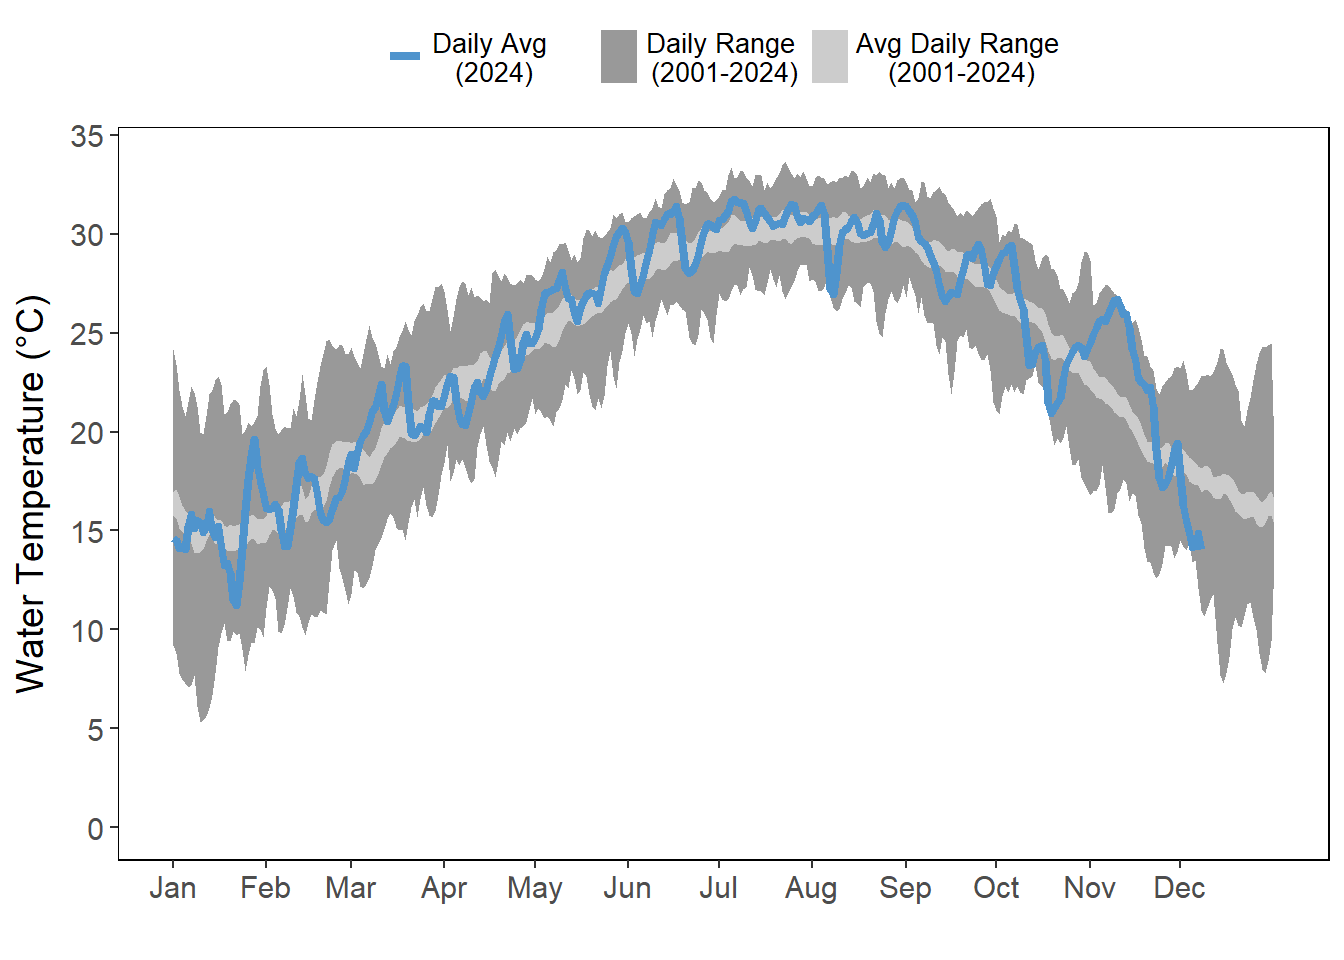
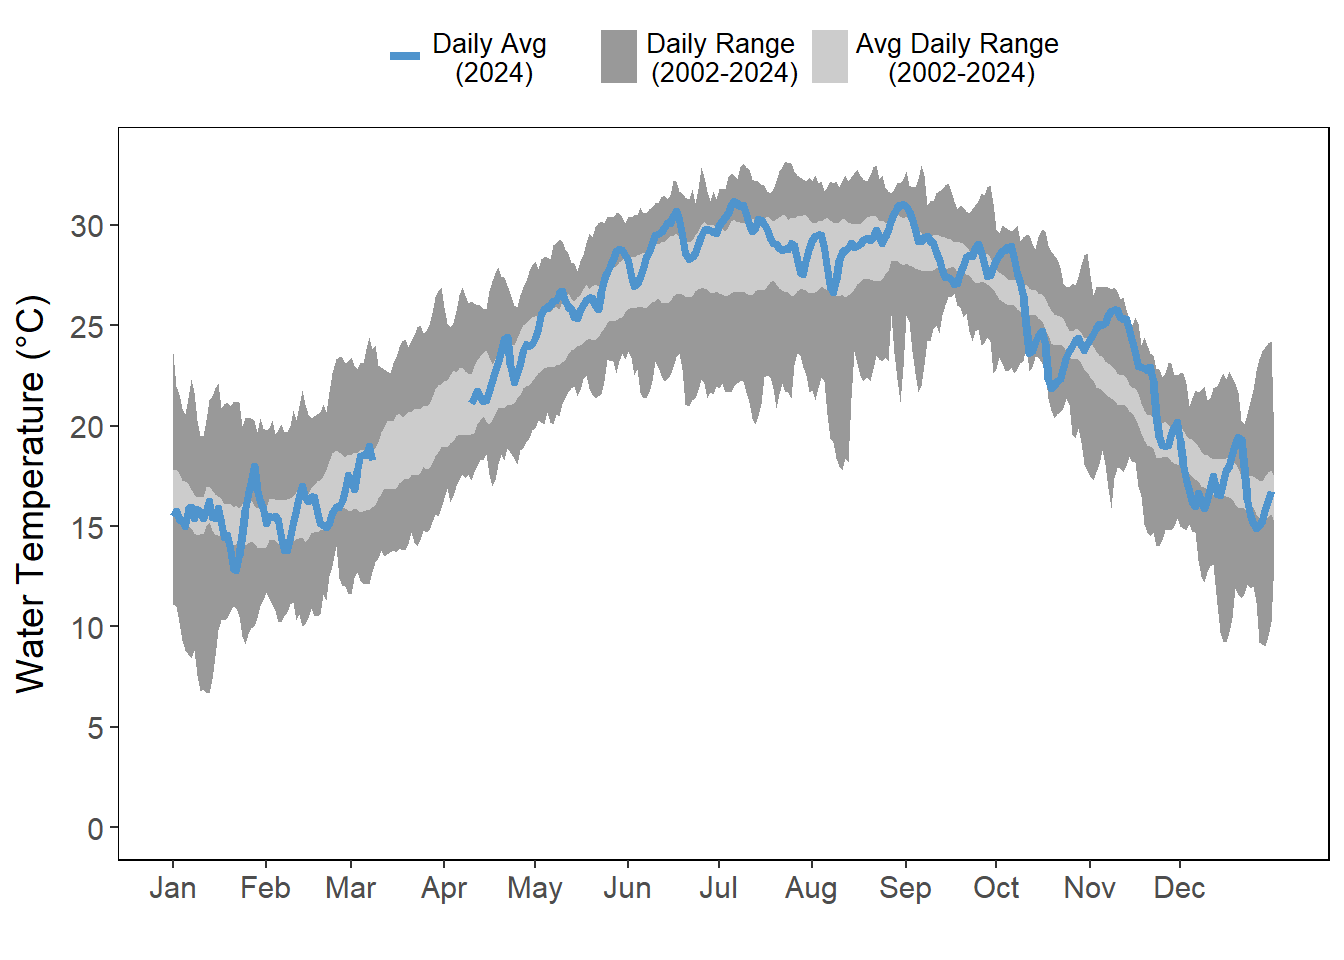
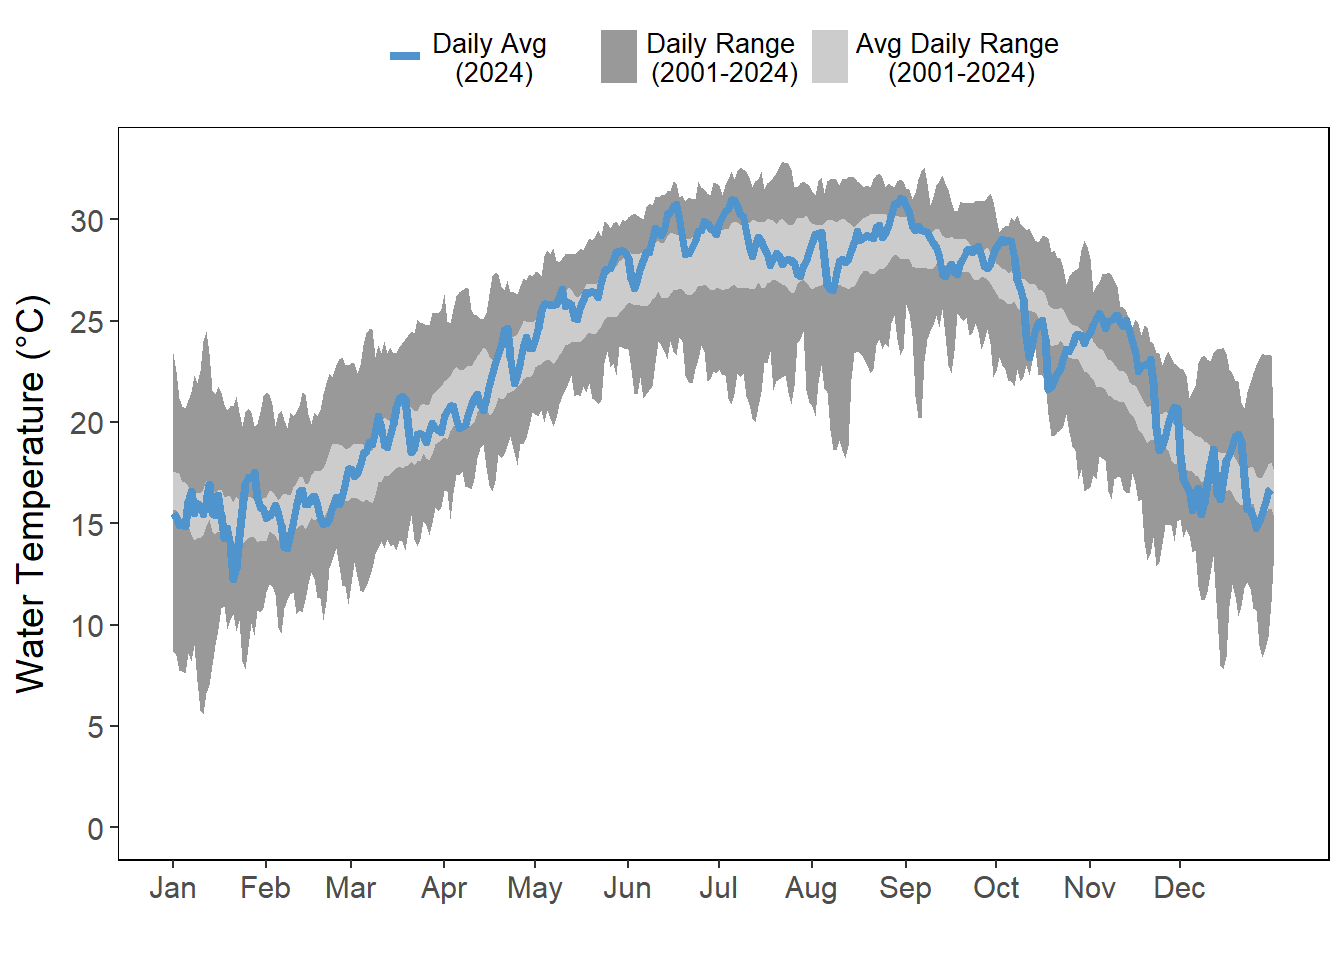
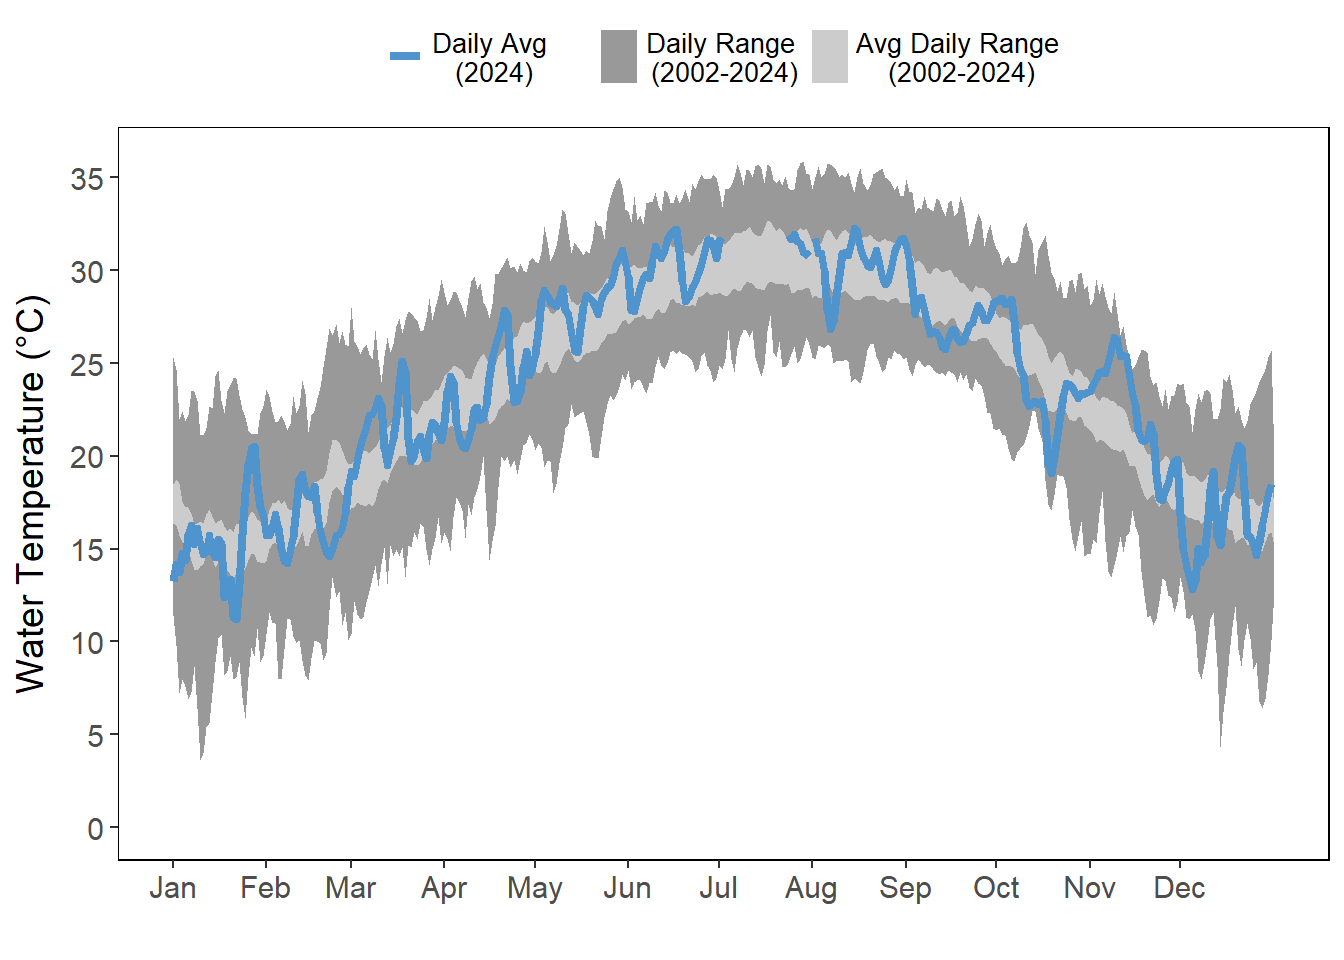
While there were some low water temperatures throughout the year, daily average water temperatures were generally higher than average (Figure 4.5). Water temperature decreased in August and September with the onset of the large rain events causing water temperatures to fall below the historic average daily range at all four stations (Figure 4.5 (b); Figure 4.5 (c)). Water temperatures increased at all four stations in November nearing the historic 2002-2024 maximum daily range (Figure 4.5).
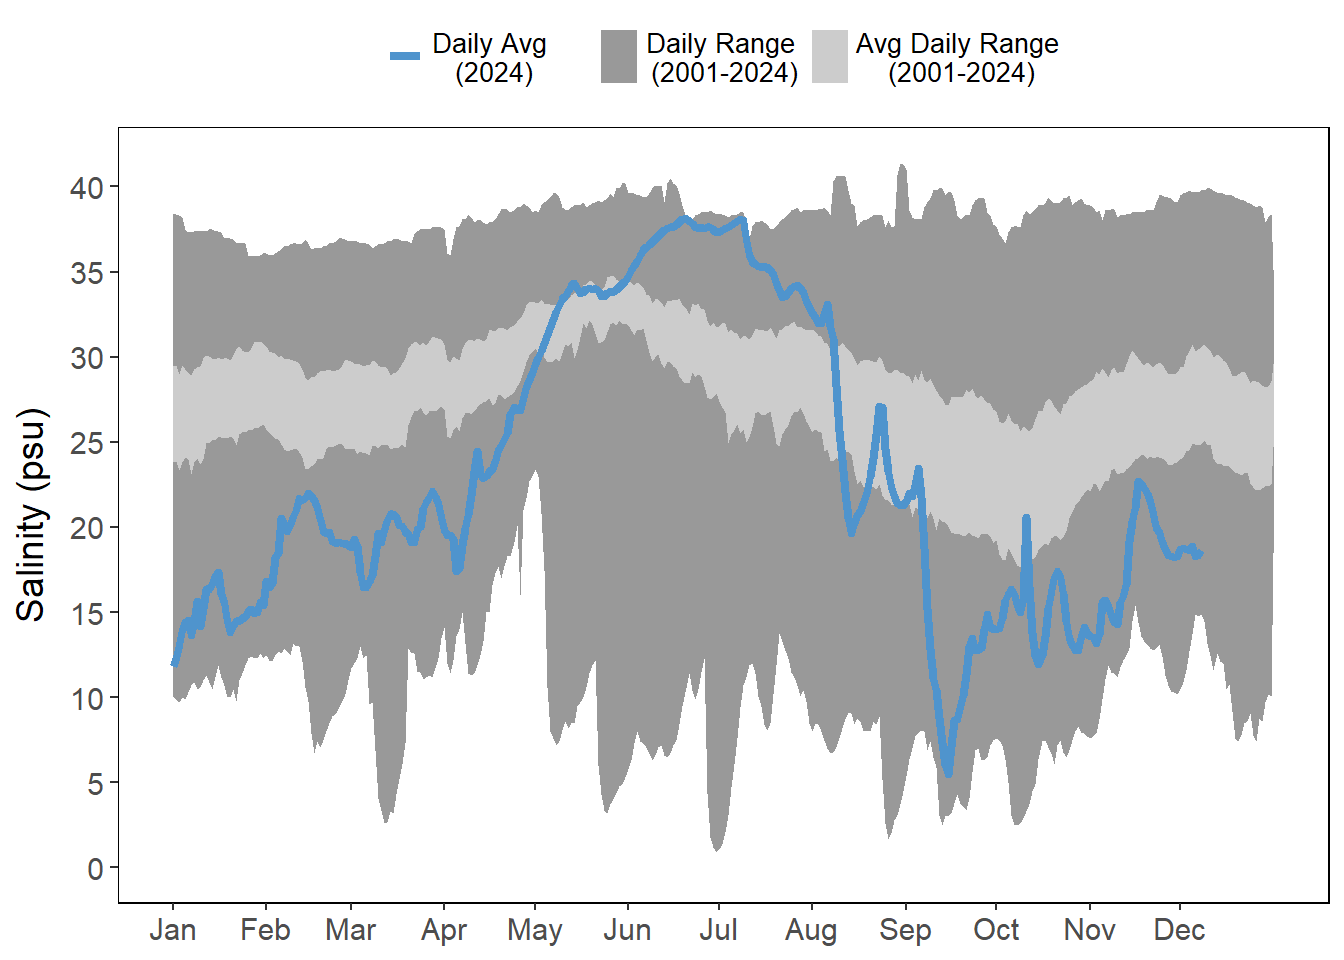
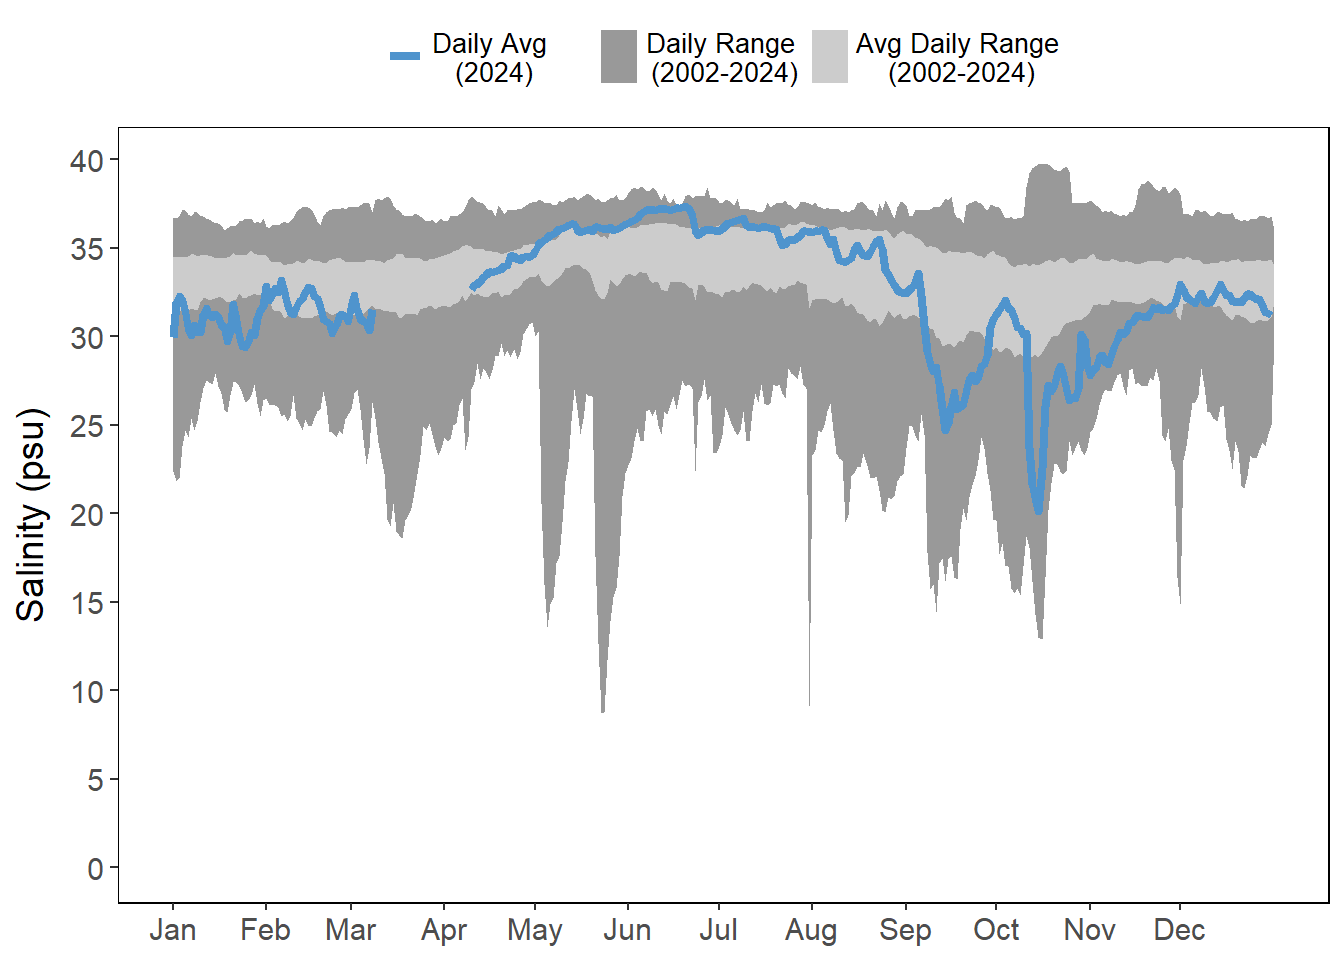
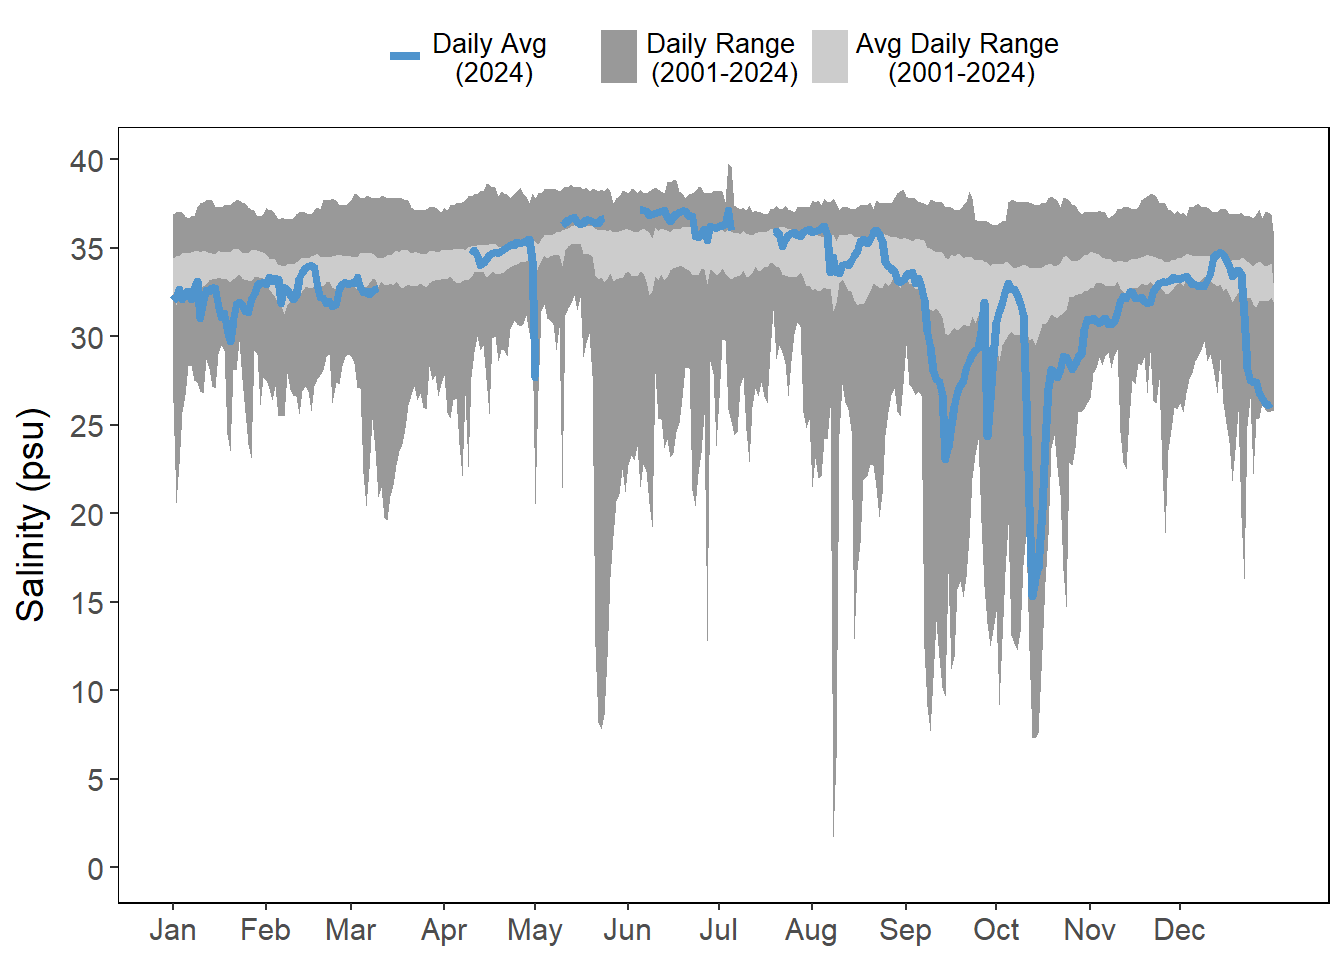
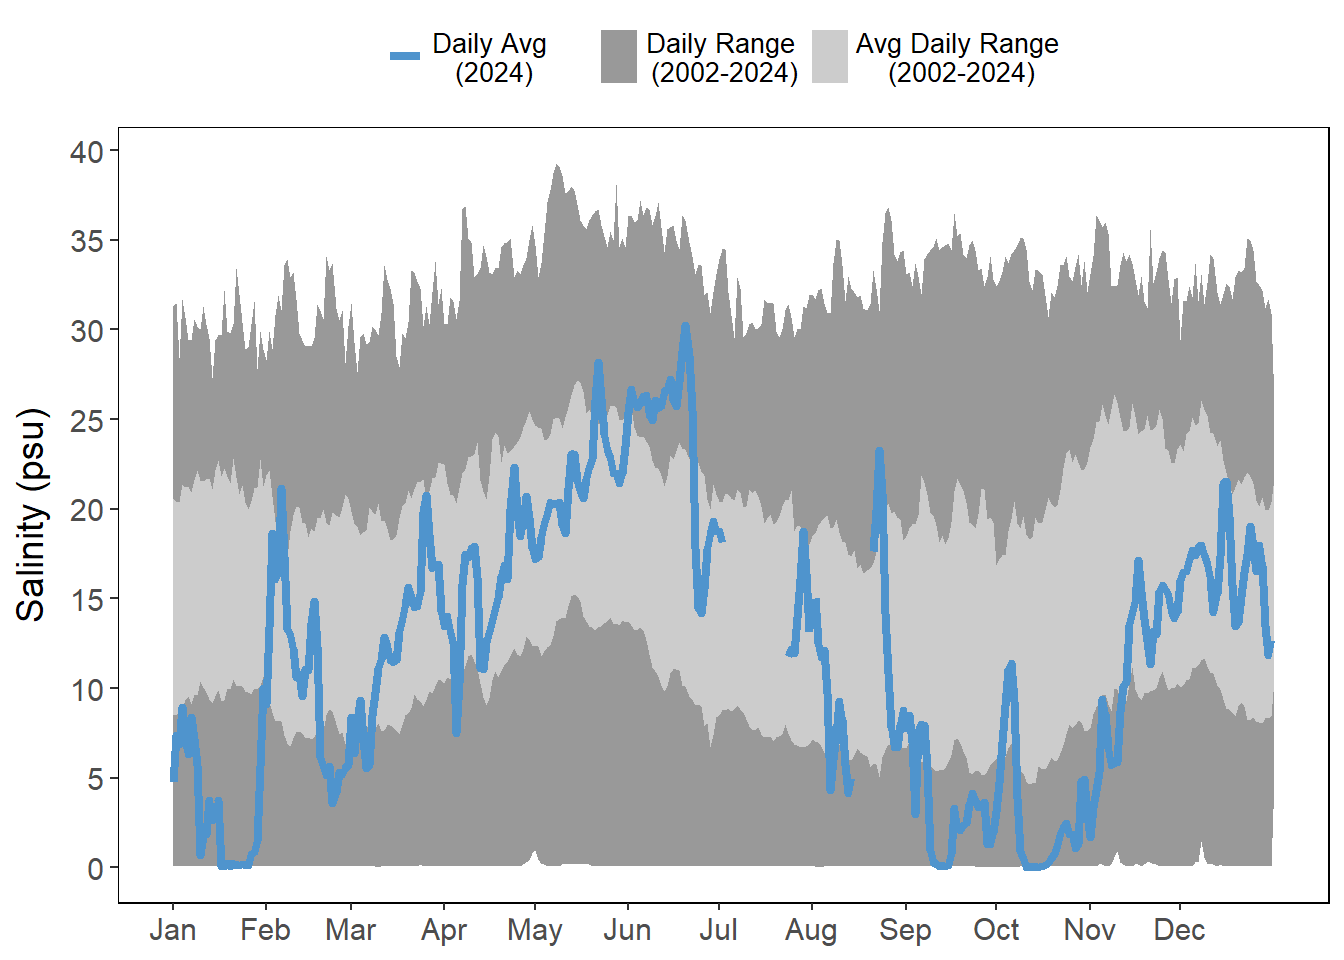
Rainfall in January and September – November brought salinity levels lower than their average daily ranges (Figure 4.6), particularly at the stations farthest from the inlets (Figure 4.6 (a); Figure 4.6 (d)). However, the drought conditions during spring increased salinity levels. Salinity stayed higher than the average daily range at all stations through July, but was most pronounced at Pine Island (Figure 4.6 (a)).
4.2 Data
4.2.1 Rainfall
4.2.2 Light Intensity
The plot below is interactive. Clicking on elements in the legend (months) will select or deselect months of interest. Additionally, the axis can be adjusted by selecting portions of the plot to isolate.
4.2.3 Temperature
Air and water temperatures are presented as daily averages (blue line) with historic ranges (daily range and average daily range) provided in shades of gray.
4.2.4 Salinity