| Year | Month/Day | Name | Total Rainfall (mm) | Ave Wind Speed (m/s) | Max Wind Speed (m/s) | Ave Wind Direction (Degrees) | Cardinal Direction |
|---|---|---|---|---|---|---|---|
| 2004 | 08/13 – 08/15 | H Charley* | 114.8 | 2.2 | 25.9 | 176.4 | S |
| 2004 | 09/04 – 09/08 | H Frances | 203.2 | 7.4 | 28.1 | 123.4 | ESE |
| 2004 | 09/19 – 09/21 | H Ivan | 35.1 | 7.2 | 14.4 | 46.5 | NE |
| 2004 | 09/26 | H Jeanne | 57.5 | 13.6 | 24.4 | 91.3 | E |
| 2005 | 09/05 – 09/09 | H Ophelia | 122.6 | 7.5 | 16.0 | 76.6 | ENE |
| 2005 | 10/04 – 10/06 | TS Tammy* | 40.1 | 4.2 | 18.5 | 121.2 | ESE |
| 2005 | 10/24 – 10/25 | H Wilma | 45.4 | 3.5 | 15.4 | 288.9 | WNW |
| 2006 | 08/24 – 09/04 | H Ernesto | 78.0 | 2.0 | 9.6 | 185.9 | S |
| 2007 | 05/31 – 06/05 | TS Barry | 88.6 | 3.2 | 14.7 | 176.8 | S |
| 2008 | 08/20 – 08/25 | TS Fay* | 200.9 | 5.9 | 20.6 | 117.3 | ESE |
| 2012 | 05/27 – 05/29 | TS Beryl* | 86.2 | 3.5 | 15.3 | 215.4 | SW |
| 2012 | 06/23 – 06/27 | TS Debby* | 141.0 | 3.4 | 14.6 | 172.1 | S |
| 2016 | 06/05 – 06/07 | TS Colin | 127.3 | 2.2 | 11.7 | 189.5 | S |
| 2016 | 08/28 – 09/06 | H Hermine | 66.0 | 2.7 | 12.8 | 130.8 | SE |
| 2016 | 09/14 – 09/19 | TS Julia* | 26.9 | 2.3 | 8.6 | 140.3 | SE |
| 2016 | 09/28 – 10/09 | H Matthew* | 193.2 | 3.6 | 28.9 | 142.6 | SE |
| 2017 | 09/10 – 09/12 | H Irma | 222.3 | 6.6 | 29.1 | 149.2 | SSE |
| 2019 | 09/03 – 09/05 | H Dorian | 83.8 | 5.1 | 19.1 | 178.0 | S |
| 2020 | 11/12 | H. Eta* | 12.4 | 3.7 | 13.4 | 211.0 | SSW |
| 2022 | 09/28 – 10/01 | H Ian | 238.0 | 5.6 | 21.5 | 182.1 | S |
| 2022 | 11/08 – 11/11 | H Nicole | 100.4 | 6.7 | 18.8 | 86.0 | E |
| 2023 | 08/29 – 08/30 | H Idalia | 17.7 | 3.1 | 16.6 | 176.8 | S |
| 2024 | 08/04 – 08/06 | H Debby | 35.7 | 3.8 | 13.7 | 174.2 | S |
| 2024 | 09/25 – 09/26 | H Helene | 24.9 | 4.9 | 17.4 | 142.0 | SE |
| 2024 | 10/09 – 10/10 | H Milton | 185.7 | 8.2 | 26.1 | 85.0 | E |
6 Environmental Drivers
This section includes drivers of environmental patterns such as significant weather events (e.g., tropical cyclones, Nor’easters, large rainfall events), anomalies, and other local events with impact.
6.1 Tropical Cyclones
There was one tropical cyclone, Hurricane Milton, that had direct impacts in the GTM estuary during the Q4 reporting period. This brings the yearly total to three tropical cyclones: Hurricane Debby, Hurricane Helene, and Hurricane Milton.
Northeast Florida felt the impacts of Hurricane Debby August 4-6, 2024, as Debby approached Steinhatchee, Florida as a Category 1 hurricane and moved across the state bringing heavy rain and strong winds. The area was impacted by another tropical cyclone, Hurricane Helene, in late September. Hurricane Helene made landfall in the Big Bend area of Florida as a Category 4 storm. Very strong winds and rain caused significant storm surges and flooding in Northeast Florida. The impacts of Hurricane Helene can be seen in our SWMP data from September 25–26, 2024; however, we did unfortunately experience intermittent battery and sensor malfunctions during the storm, leaving our data incomplete.
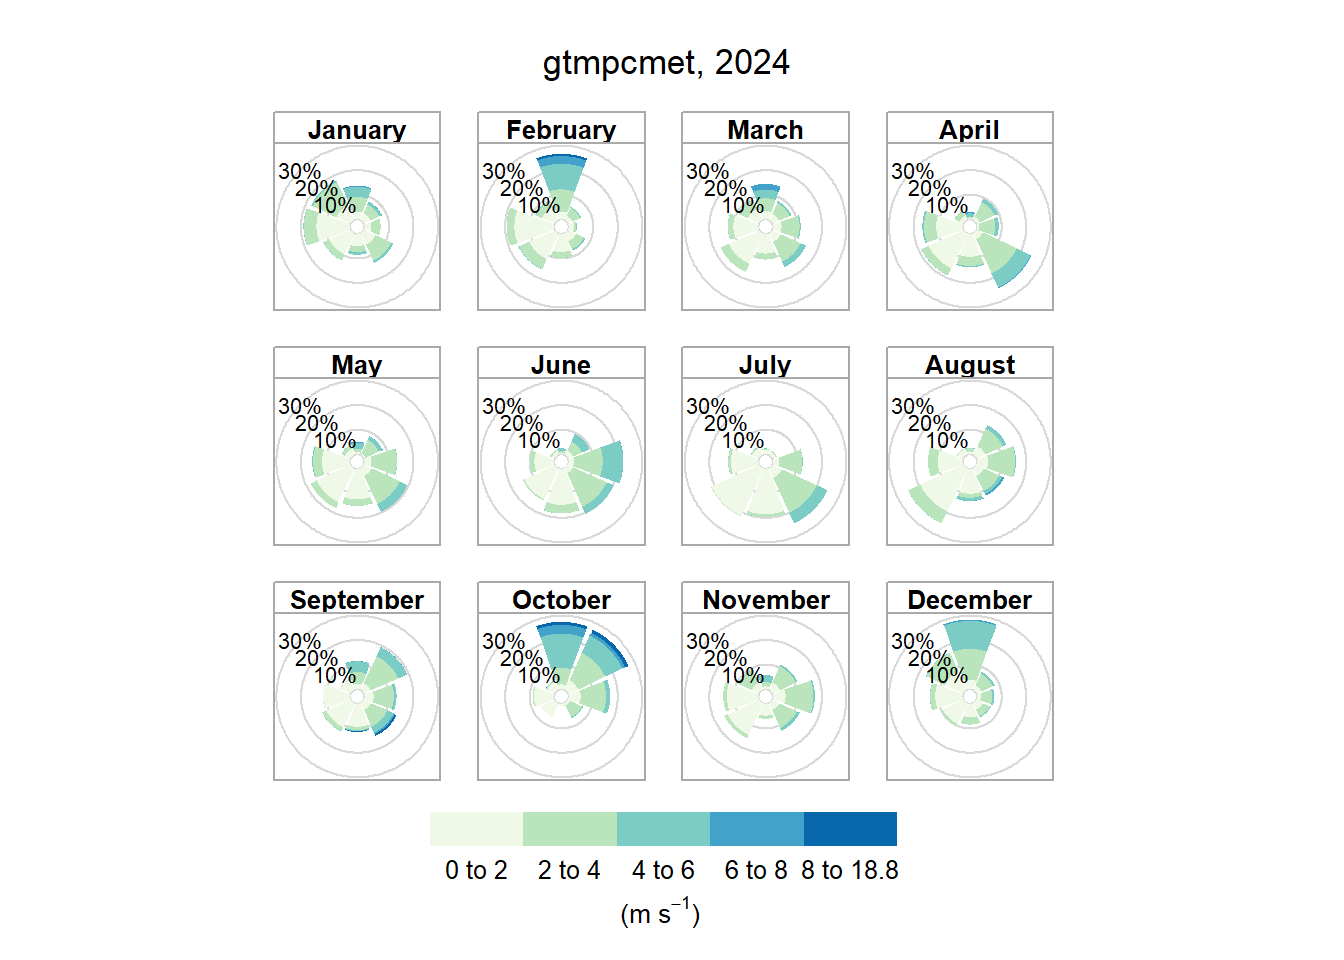
The third storm of the season, Hurricane Milton, impacted the area on October 9-10, 2024. The major hurricane made landfall near Siesta Key on Wednesday, October 9, 2024, as a Category 3 storm. St. Augustine and St. Johns County experienced strong winds, heavy rains, and flooding Wednesday evening into Thursday. The strongest winds recorded at the GTMNERR weather station in 2024 were during Hurricane Milton. The strong winds were predominately from the east and the maximum wind speed was 26.1 m/s (58.4 mph) (Figure 6.5). Strong winds initially raised salinity at all stations (Figure 4.6)at the onset of the storm, however; the rainfall during the storm drastically decreased salinity as it made its way to this estuary, which was especially pronounced at Pellicer Creek (Figure 4.6 (d)).
6.2 Nor’easters
Typically, a Nor’easter is a storm along the East Coast of the United States with predominating winds from the northeast. These storms can last anywhere from a single day (24 hours) to several days or weeks. Callahan, Leathers, and Callahan Callahan, Leathers, and Callahan (2022) found that these events can produce surges just as severe as tropical cyclone events and occur more frequently. These events are often in the news associated with blizzards in the New England area of the US; however, their impacts to Northeast Florida, including higher water levels, heavy prevailing winds, precipitation, and reduced tidal exchange, can be significant.
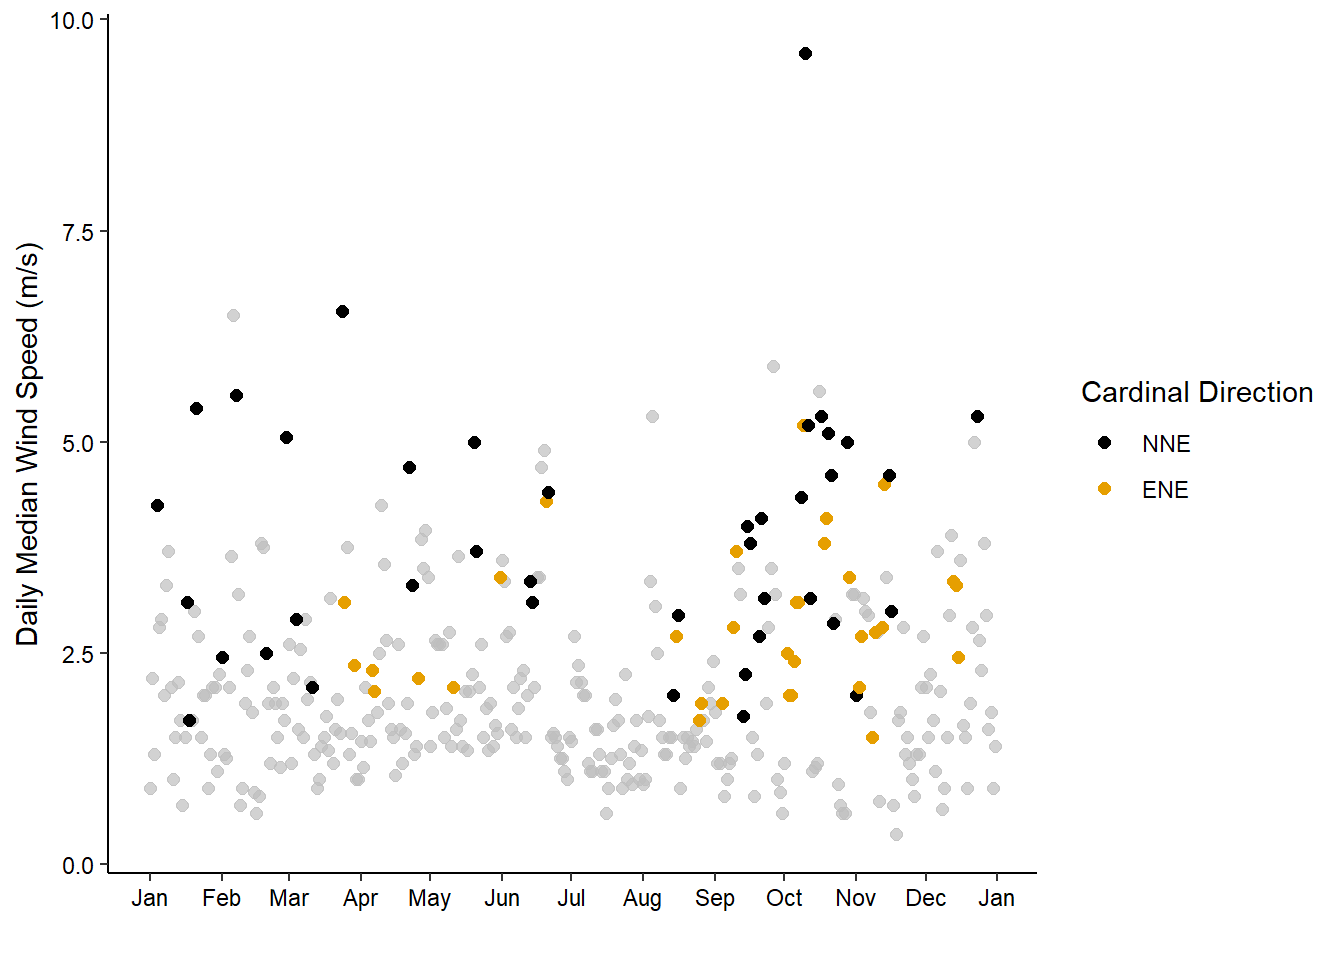
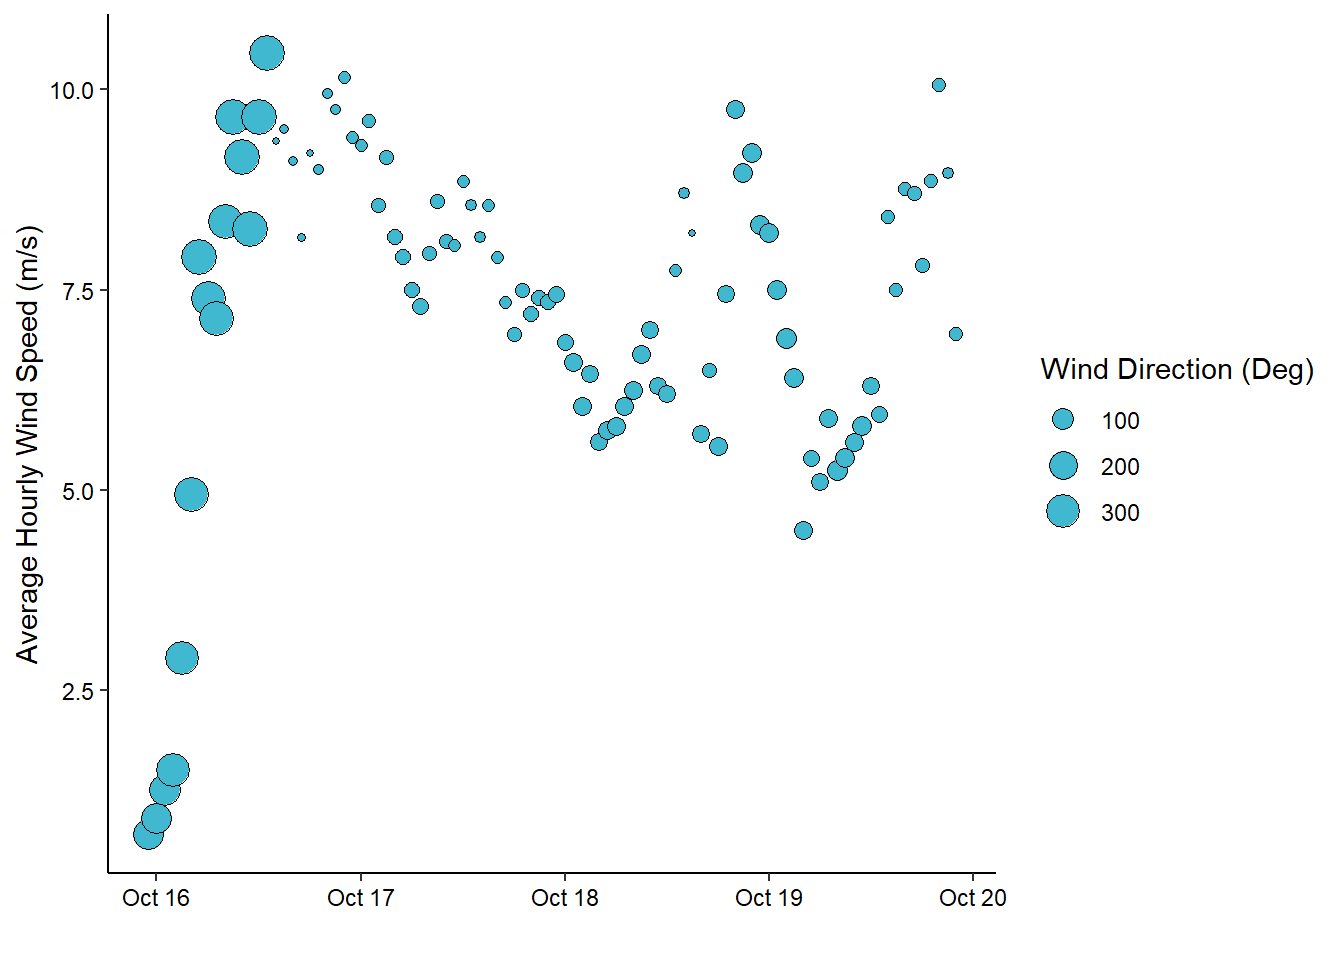
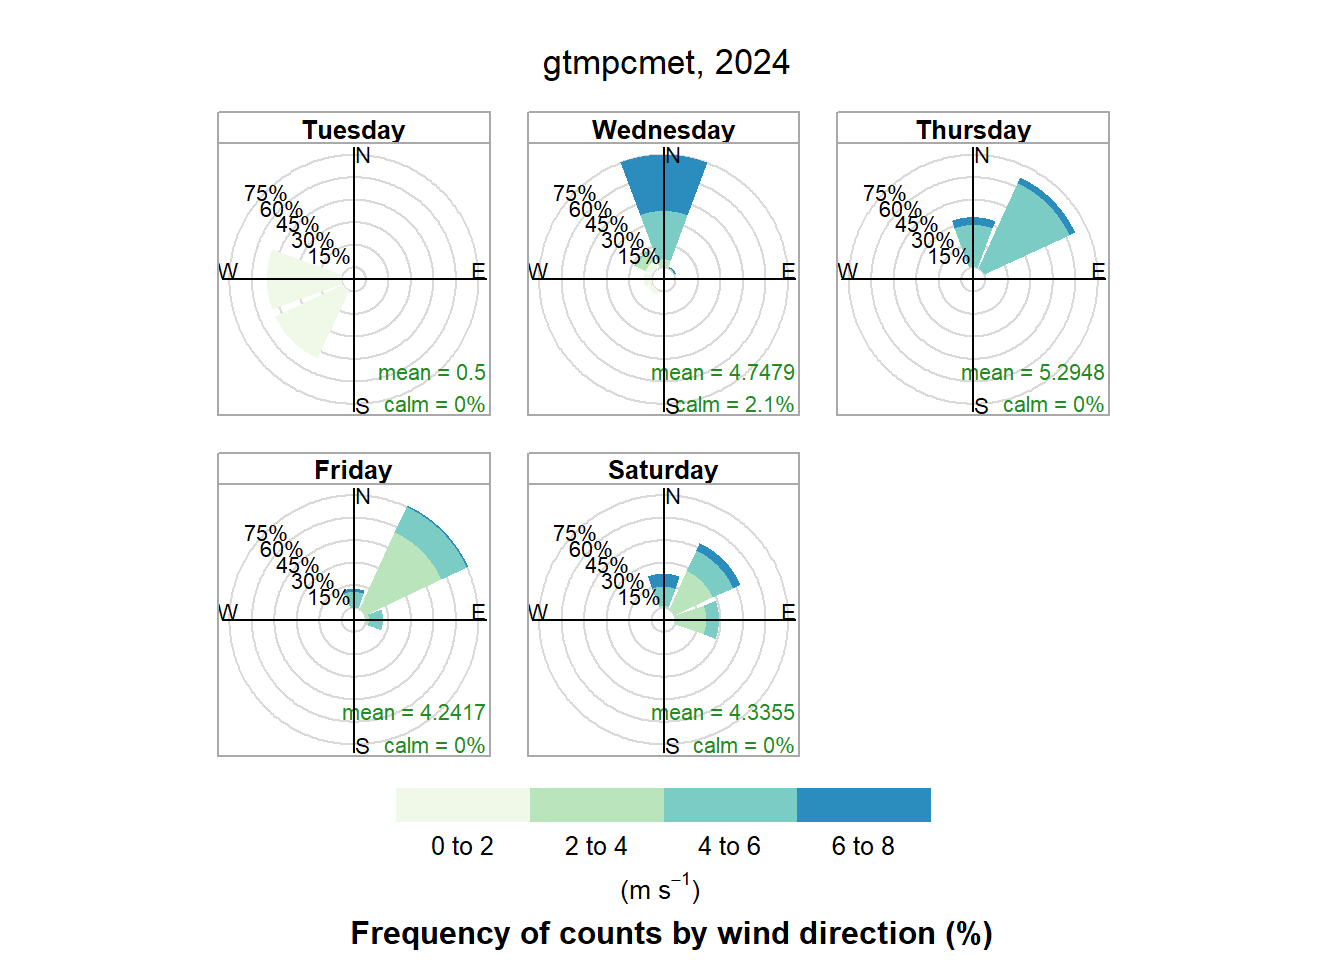
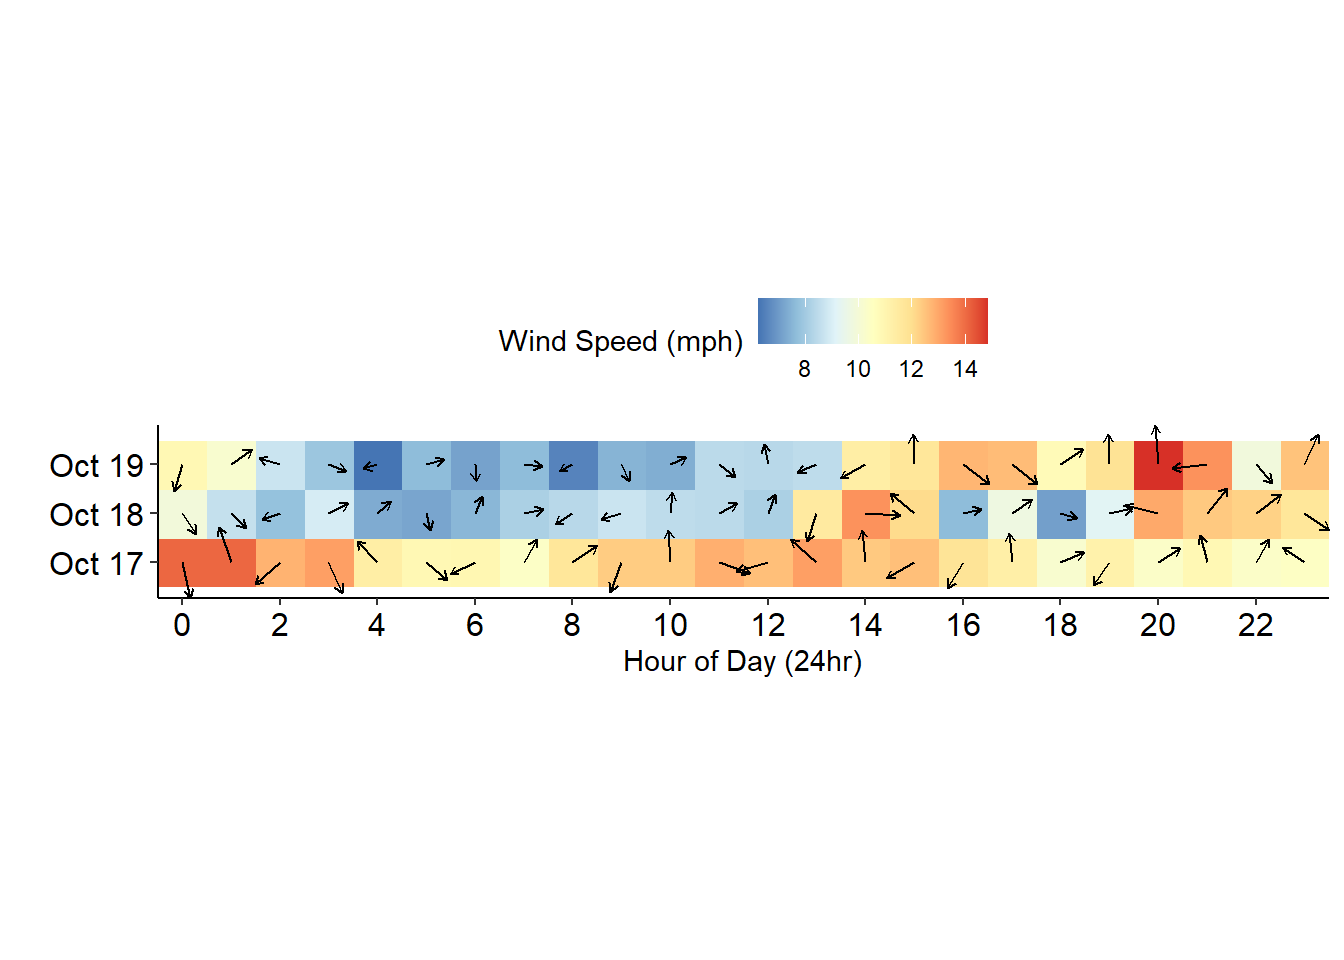
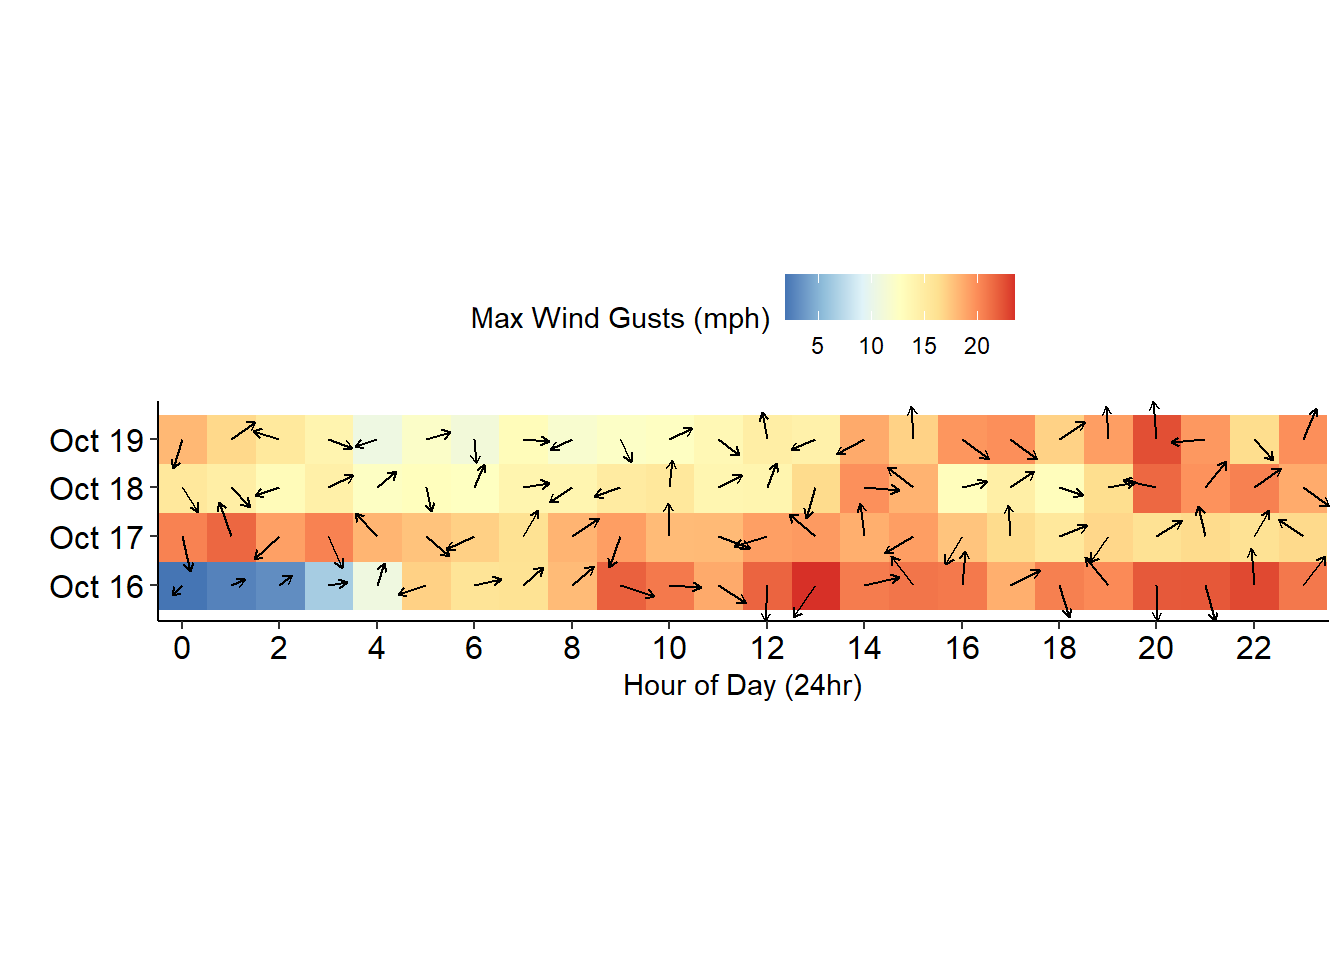
Using duration of wind directions between 0-100 degrees for greater than 24-hrs at the Pellicer Creek weather station, 13 “Nor’easter” events were identified in 2024 (Table 6.2). Occasionally, localized wind directions result in values outside of this 0-100 degree window. The longest Nor’easter event occurred October 16th - October 19th, lasting 74.5 hours (Figure 6.4). This table does not identify wind strength during these events, just the time frames in which winds were originating and prevailing in the 0-100 degree directions (Figure 6.1).
| Start Time | End Time | Duration (hrs) |
|---|---|---|
| 2024-03-24 01:00:00 | 2024-03-25 09:45:00 | 33.00 |
| 2024-04-22 10:45:00 | 2024-04-23 20:30:00 | 34.00 |
| 2024-05-20 07:45:00 | 2024-05-22 02:30:00 | 43.00 |
| 2024-06-20 03:15:00 | 2024-06-21 15:00:00 | 36.00 |
| 2024-08-15 04:45:00 | 2024-08-16 23:00:00 | 42.50 |
| 2024-09-09 09:30:00 | 2024-09-10 21:45:00 | 36.50 |
| 2024-10-02 08:45:00 | 2024-10-03 20:45:00 | 36.25 |
| 2024-10-06 04:30:00 | 2024-10-08 10:30:00 | 54.25 |
| 2024-10-08 11:00:00 | 2024-10-09 13:45:00 | 27.00 |
| 2024-10-10 16:00:00 | 2024-10-12 05:15:00 | 37.50 |
| 2024-10-16 19:15:00 | 2024-10-19 21:30:00 | 74.50 |
| 2024-11-12 09:30:00 | 2024-11-13 10:15:00 | 25.00 |
| 2024-12-12 14:15:00 | 2024-12-13 18:45:00 | 28.75 |
6.3 King Tides
“King Tides” are the highest predicted tides of the year and in Northeast Florida, these typically occur during the fall and winter months. For the city of St. Augustine, these events often bring nuisance flooding in coastal and low-lying areas. For the estuary, this typically also means reduced tidal exchange, a lack of low tide events, and more and prolonged flooding in the intertidal wetlands. The city reports these events on their website.
Predicted King Tide events in 2024 were:
- January 11th-13th
- September 16th-22nd
- October 14th-23rd
- November 13th-20th
- December 12th-17th
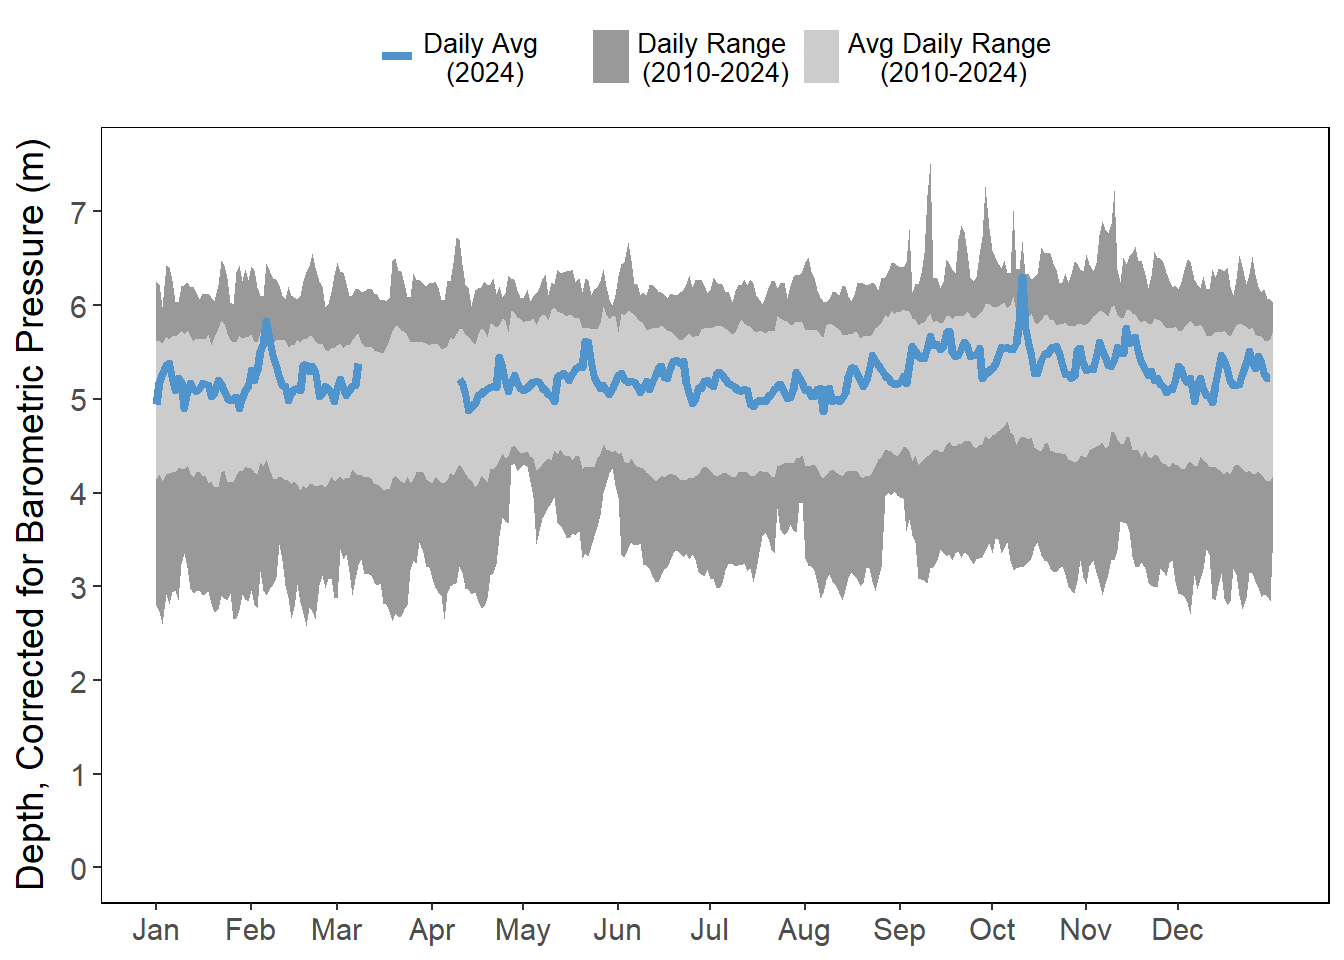
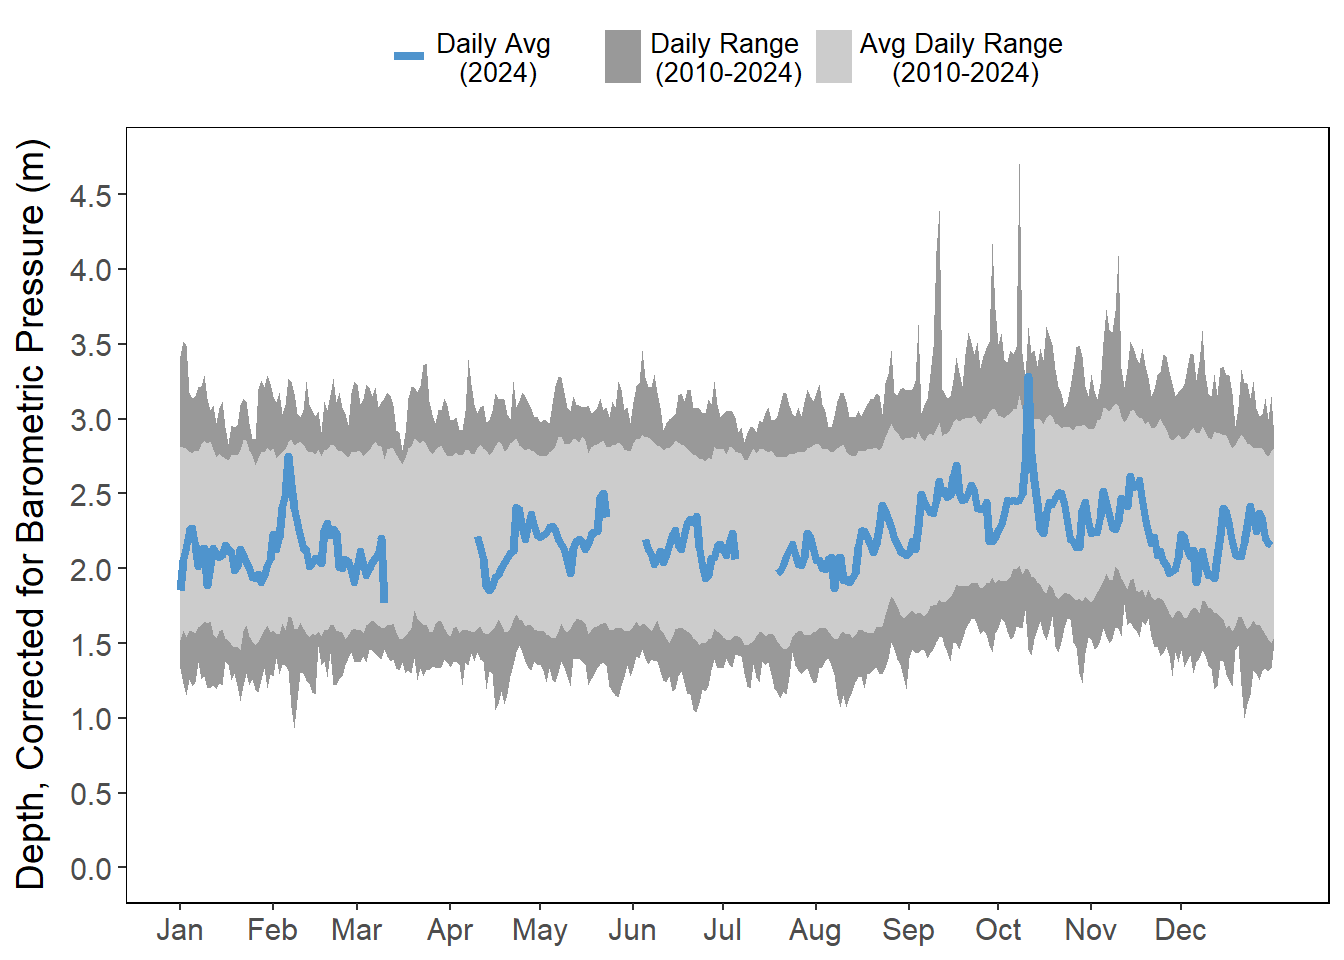
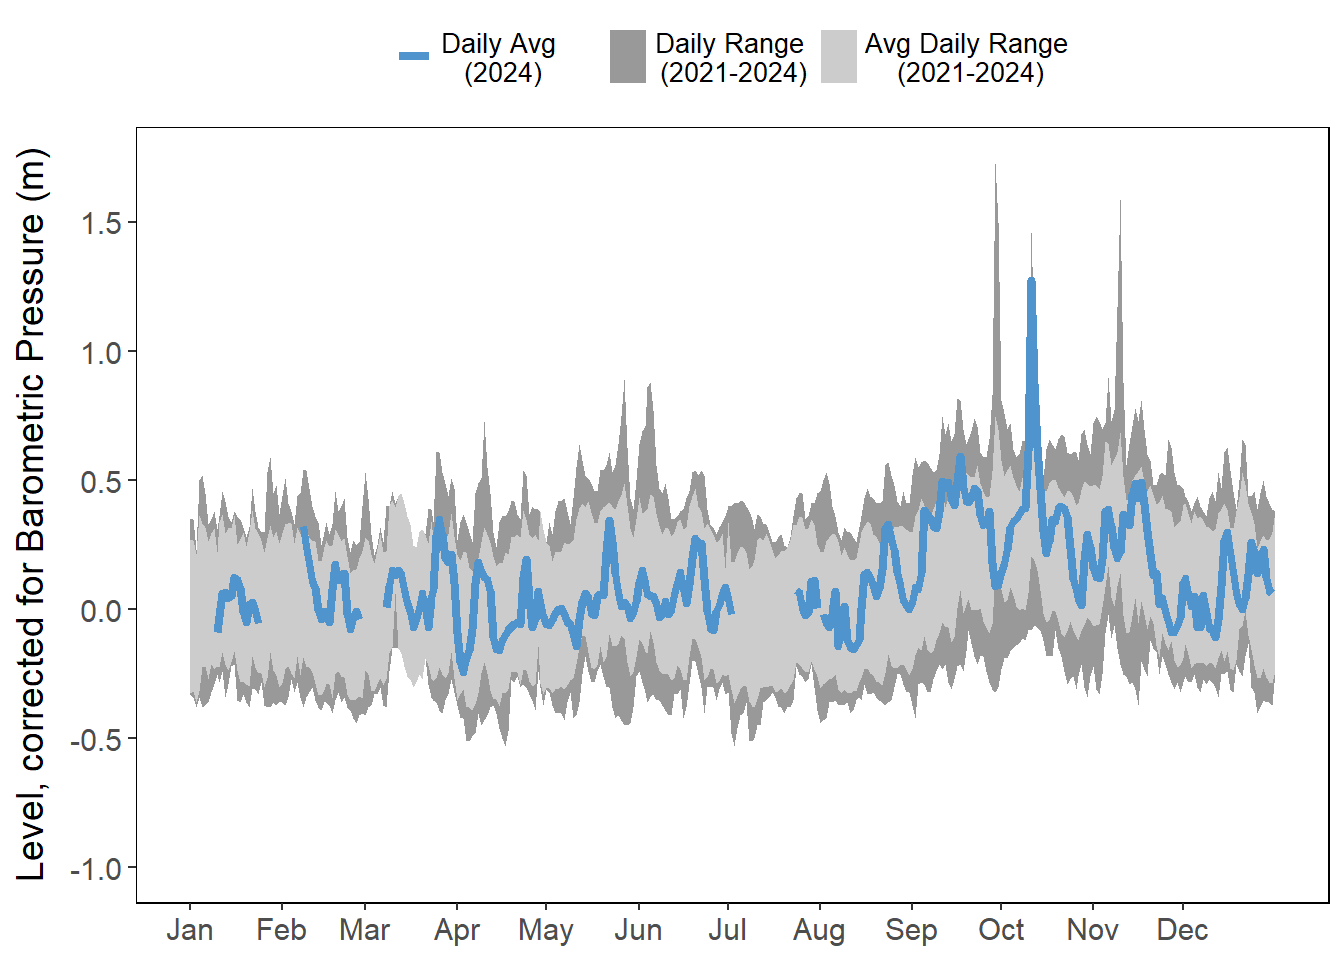
The effects of the King Tides on daily average water depths were not observable in January, but there was a spike in water depths at all stations in February (Figure 6.6).
6.3.1 Water Depth
Note that the water level data at Pellicer Creek only includes data from 2021–2024, which is due to this station switching from reporting depth to reporting level (NAVD88) in 2021 (Figure 6.6 (d)).

6.4 Temperature anomalies
Extreme temperatures, both high and low, have drastic impacts on environmental processes. For black mangroves (Avicennia germinans), temperatures under -4°C have been found to reduce mangrove cover (Cavanaugh et al. 2013). Extreme high temperatures are often health risks as they result in many heat-related illnesses.
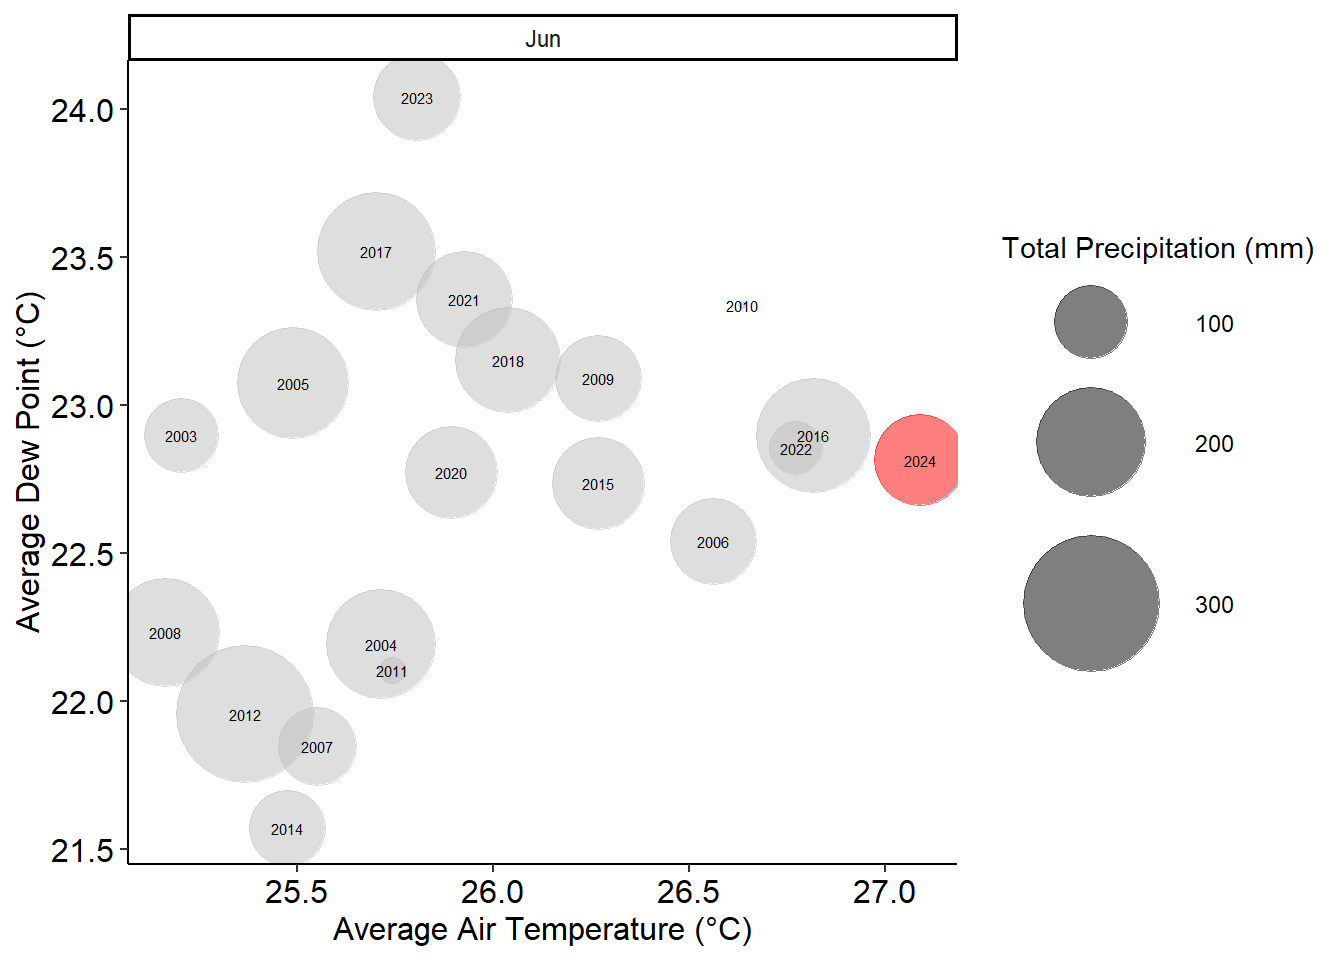
Overall, mean monthly temperatures in January, March, May, June, and November were higher than average (Figure 6.7), with November having the highest anomalies recorded in that month. February, April, September, and December of this year were cooler than average. . The highest average air temperature ever recorded at the GTMNERR weather station was recorded in June 2024 (Figure 6.8).
No freeze events were recorded this year.
| Date | Duration (hrs) |
|---|---|
| 2024-05-09 | 5.50 |
| 2024-06-09 | 2.25 |
| 2024-06-10 | 3.25 |
| 2024-07-11 | 3.25 |
| 2024-07-12 | 3.25 |
| 2024-08-08 | 4.00 |
| 2024-08-09 | 2.50 |
| 2024-08-10 | 2.75 |
| 2024-08-11 | 2.75 |
| 2024-08-12 | 2.25 |
| 2024-08-20 | 3.00 |
Callahan, John A, Daniel J Leathers, and Christina L Callahan. 2022. “Comparison of Extreme Coastal Flooding Events Between Tropical and Midlatitude Weather Systems in the Delaware and Chesapeake Bays for 19802019.” JOURNAL OF APPLIED METEOROLOGY AND CLIMATOLOGY 61.
Cavanaugh, Kyle C., James R. Kellner, Alexander J. Forde, Daniel S. Gruner, John D. Parker, Wilfrid Rodriguez, and Ilka C. Feller. 2013. “Poleward Expansion of Mangroves Is a Threshold Response to Decreased Frequency of Extreme Cold Events.” Proceedings of the National Academy of Sciences 111 (2): 723–27. https://doi.org/10.1073/pnas.1315800111.