The state thresholds used in chlorophyll a, total nitrogen, and total phosphorus visualizations come from Chapters 62-302 (Surface Water Quality Standards) and 62-303 (Identification of Impaired Surface Waters) of the Florida Administrative Code (F. A. C.).
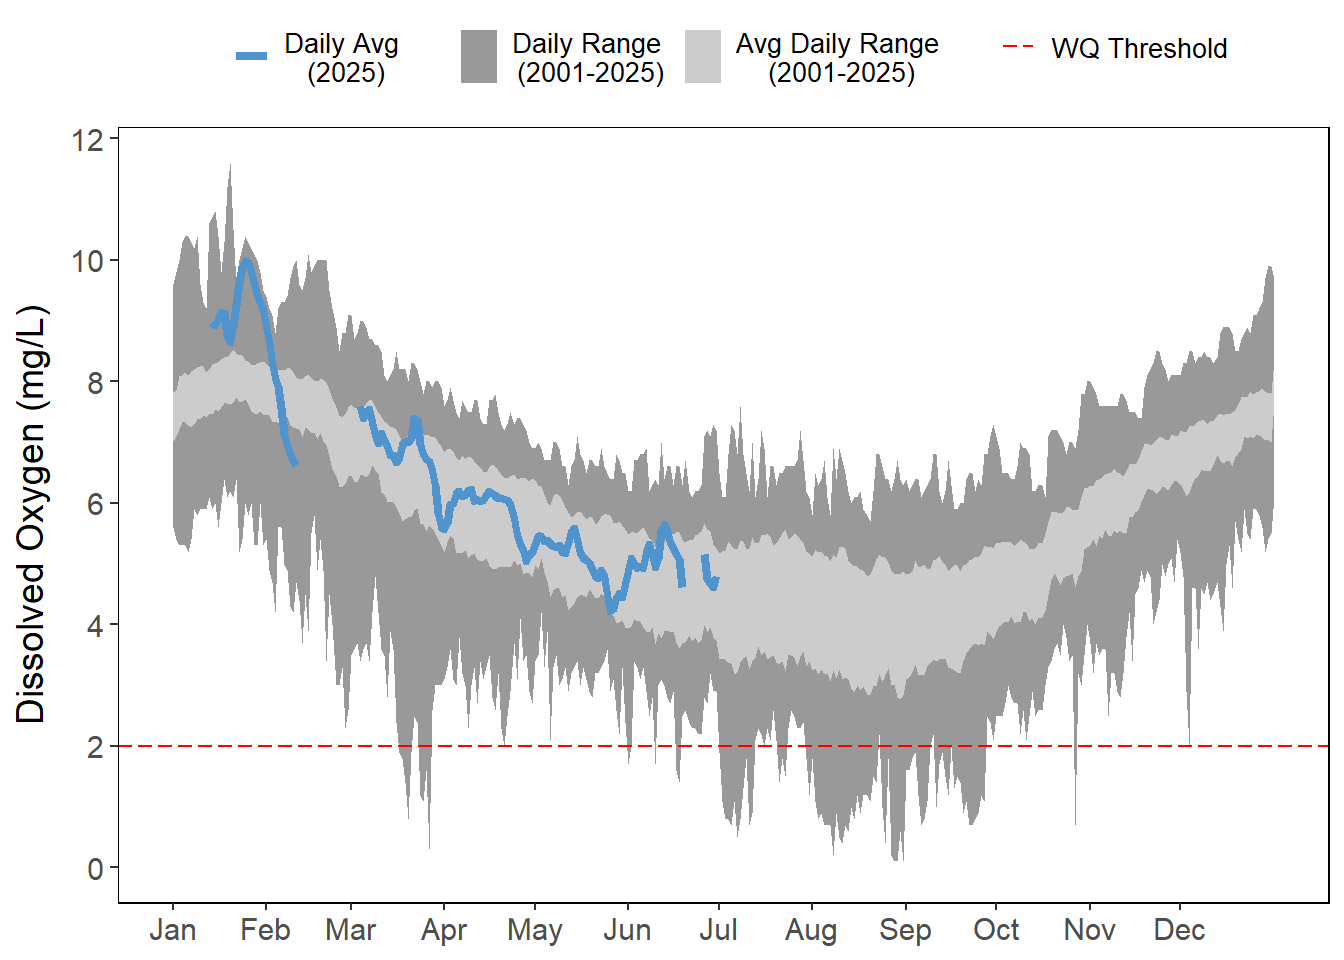
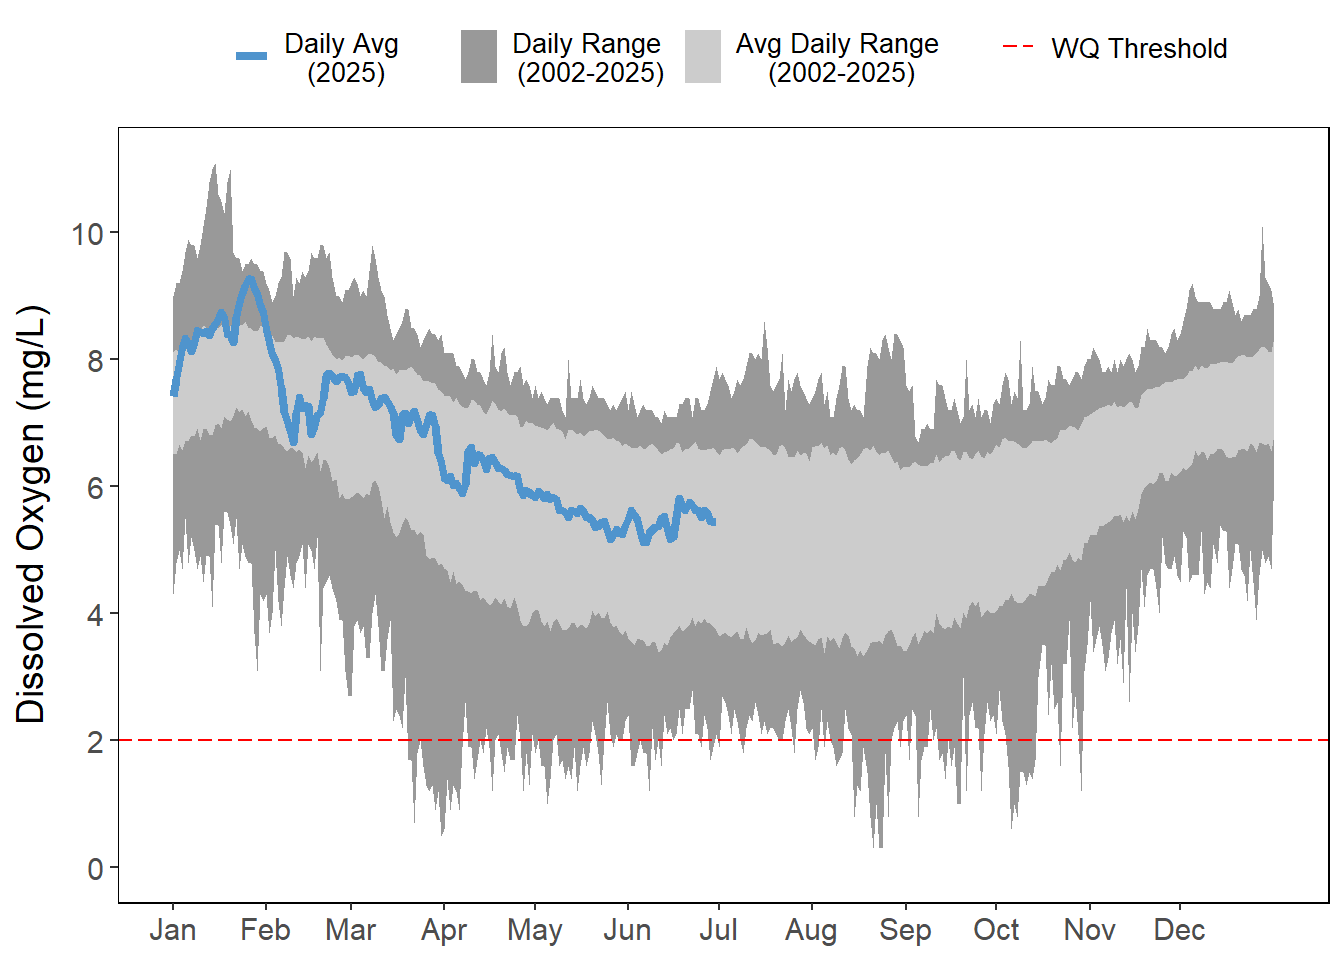
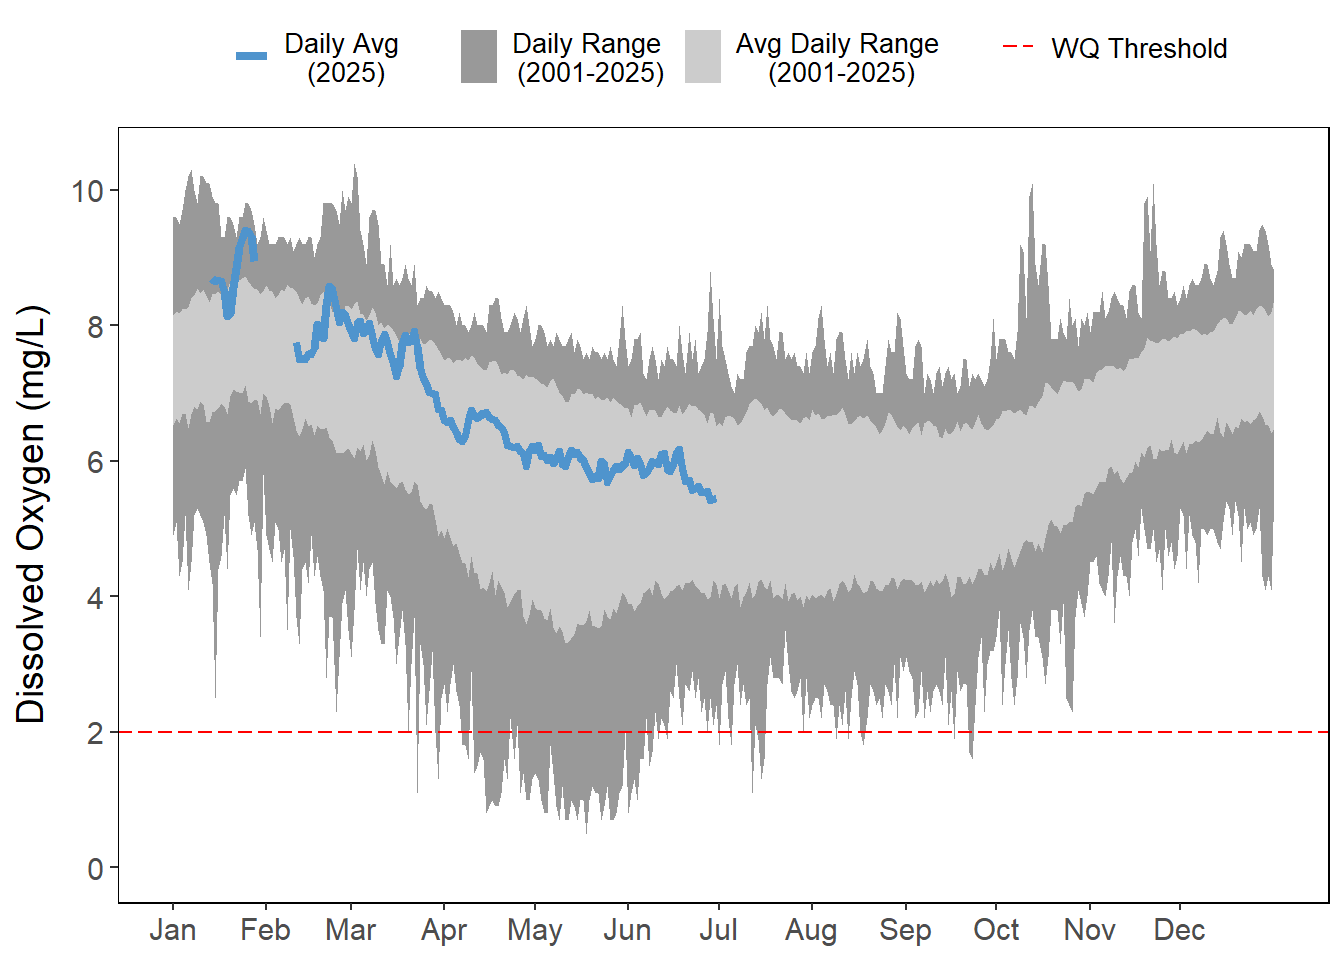
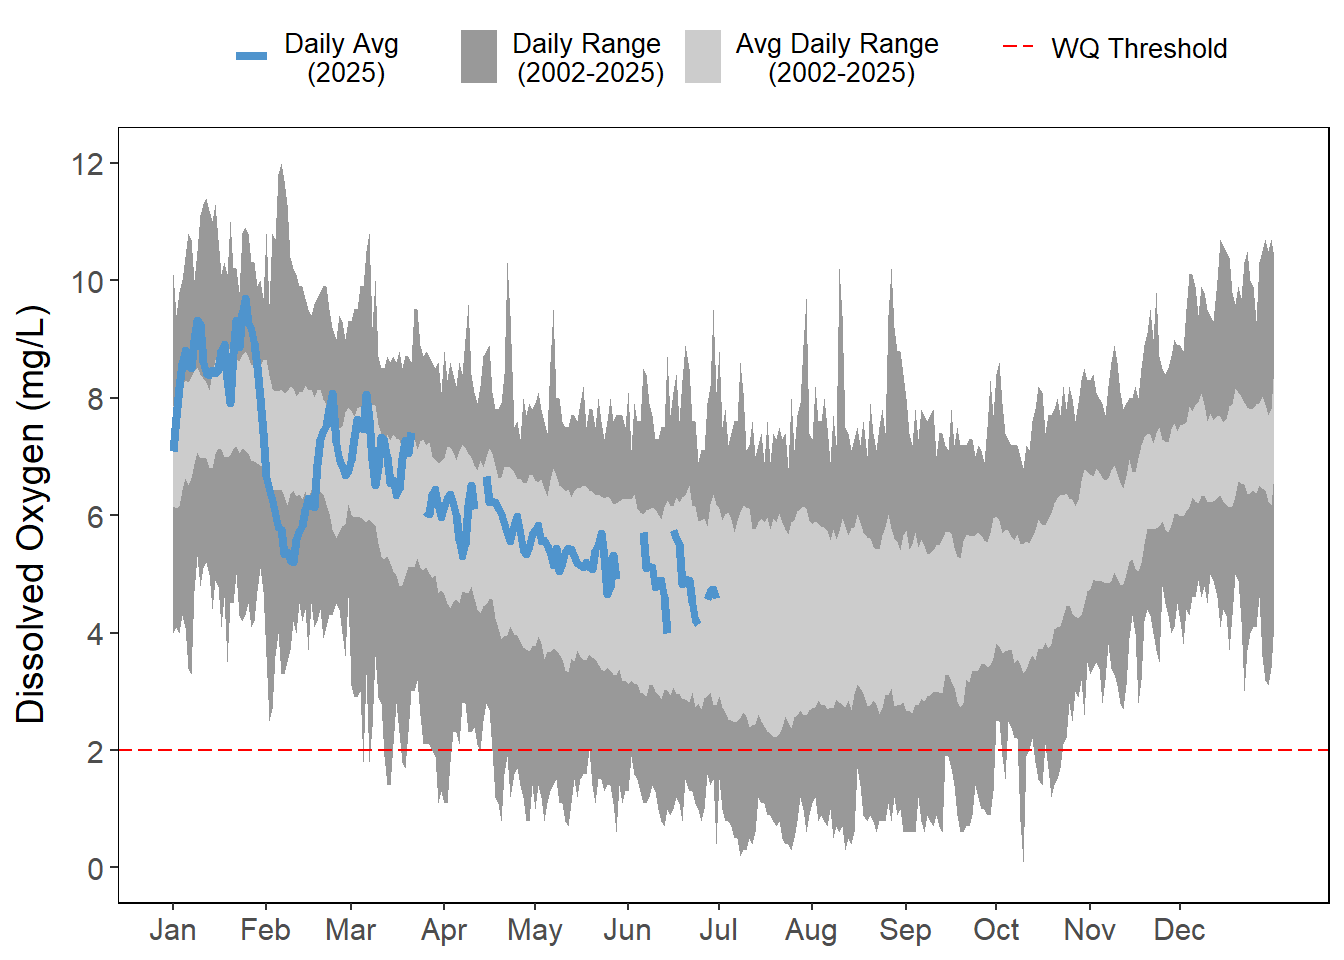
Figure 5.1: Historical daily range of dissolved oxygen at each SWMP water quality station with current year daily average overlaid in blue. Horizontal dashed red line indicates 2mg/L hypoxia threshold.
(a) For the past five years
(b) For the current 2025 year
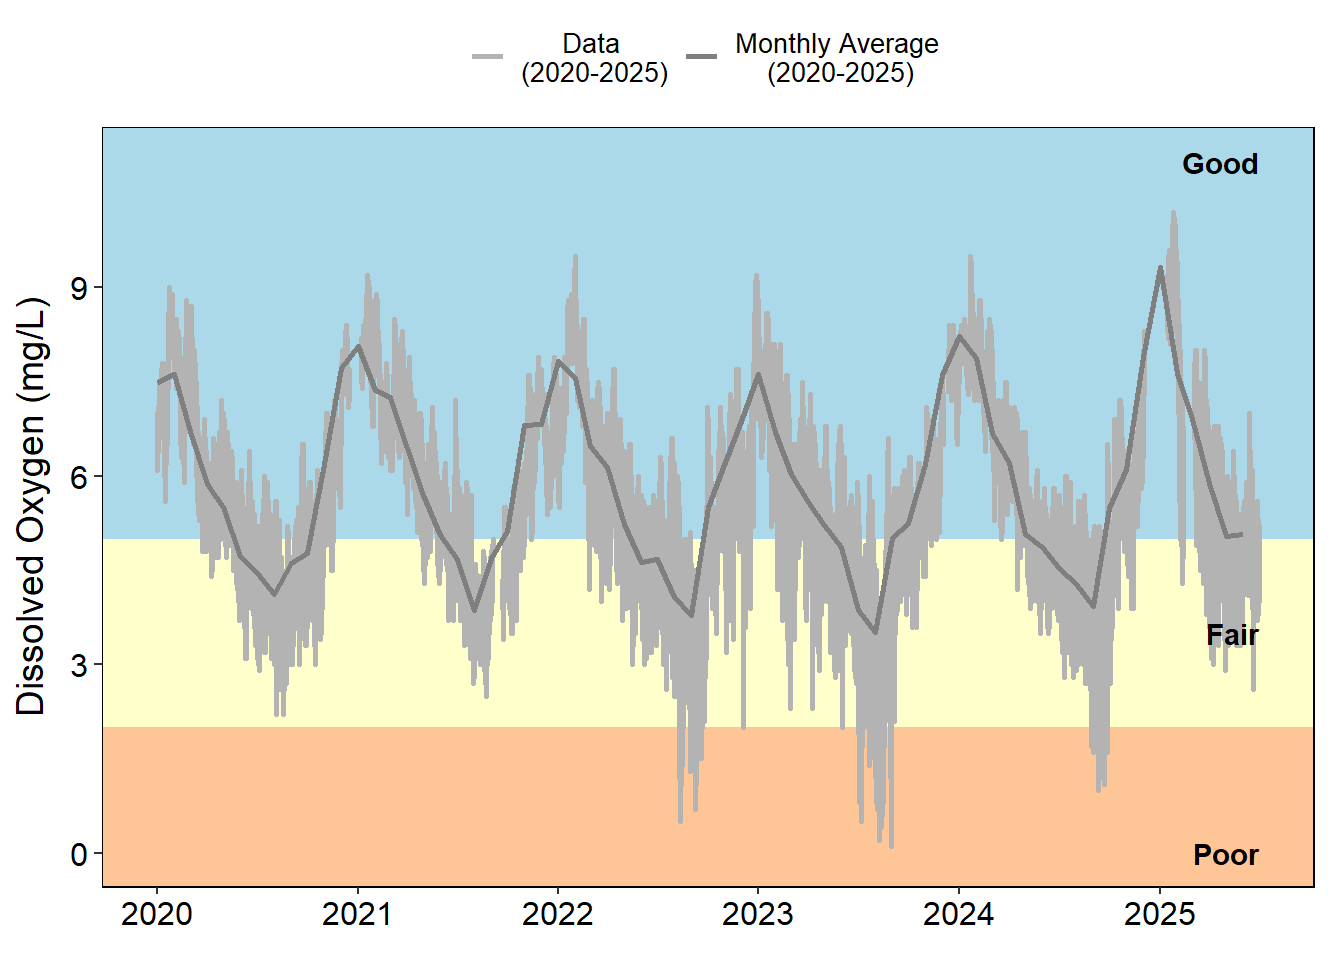
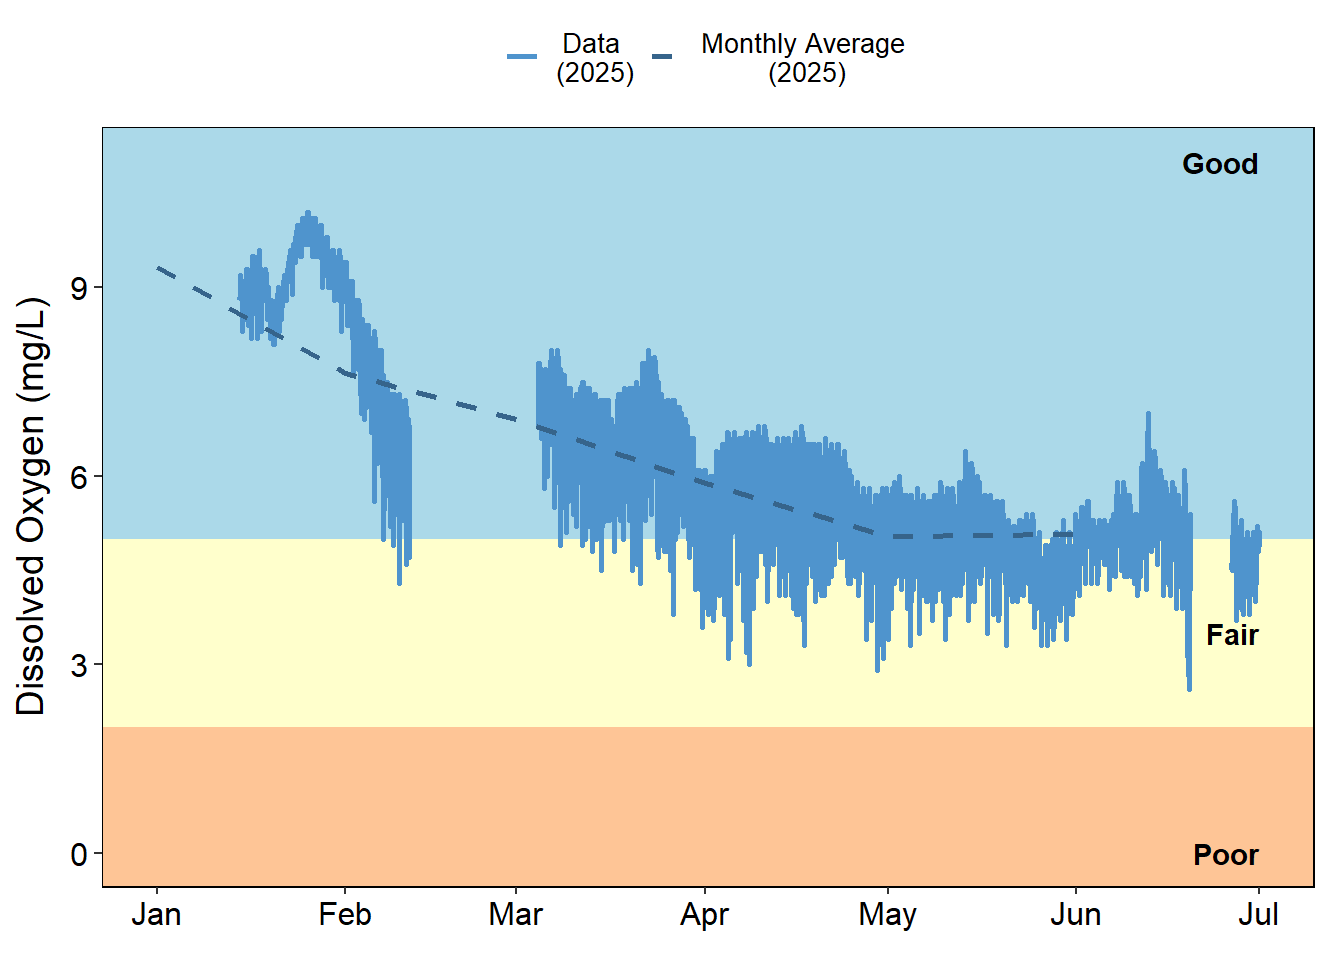
Figure 5.2: Continuous dissolved oxygen at Pine Island with monthly average overlaid in solid gray line. Conditions are indicated as good when above 5 mg/L, fair between 2 and 5 mg/L, and poor if less than 2 mg/L.
(a) For the past five years
(b) For the current 2025 year
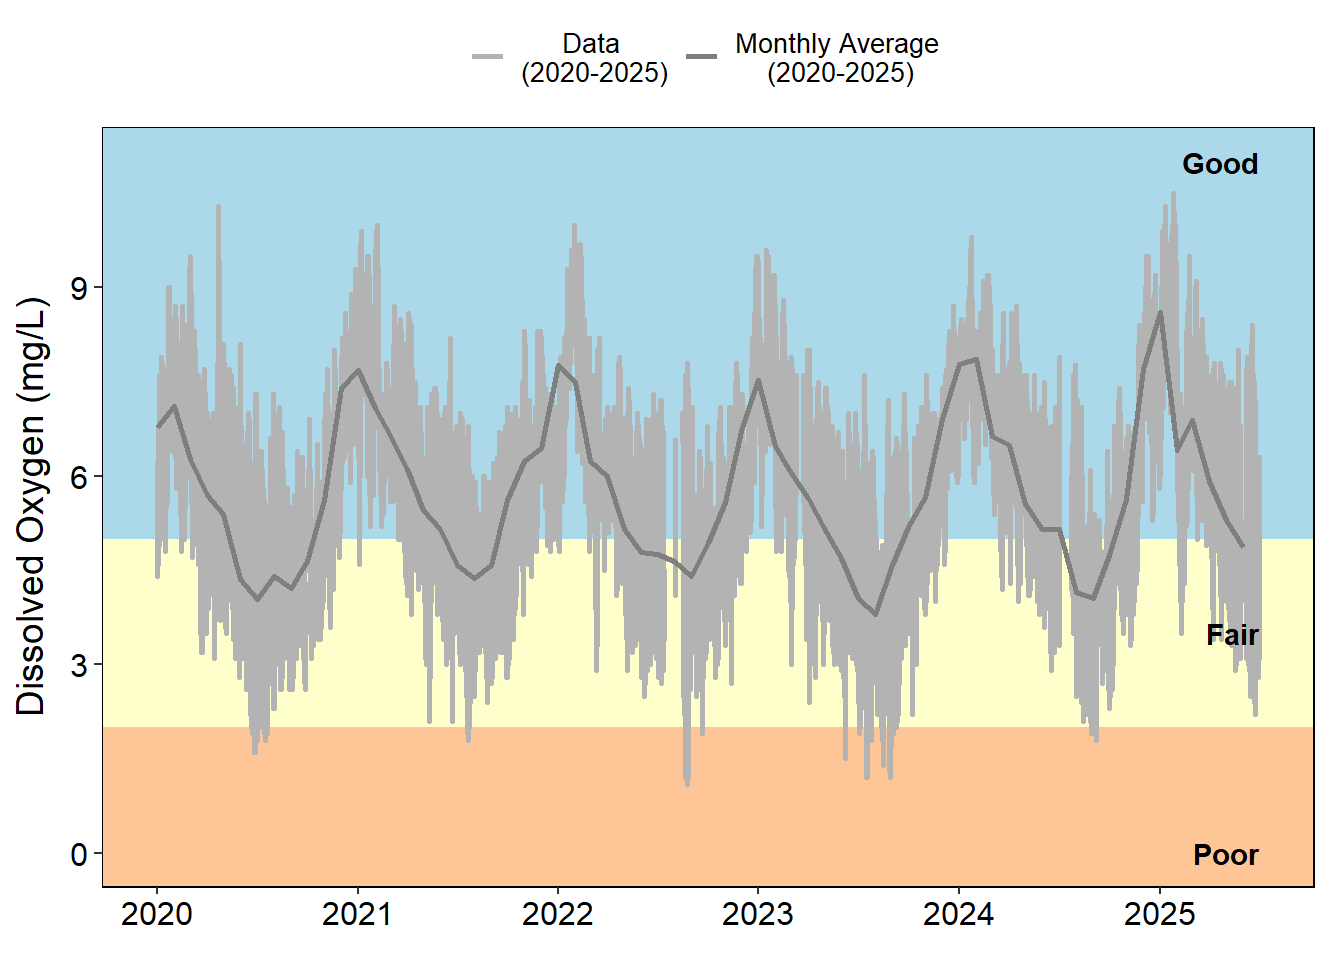
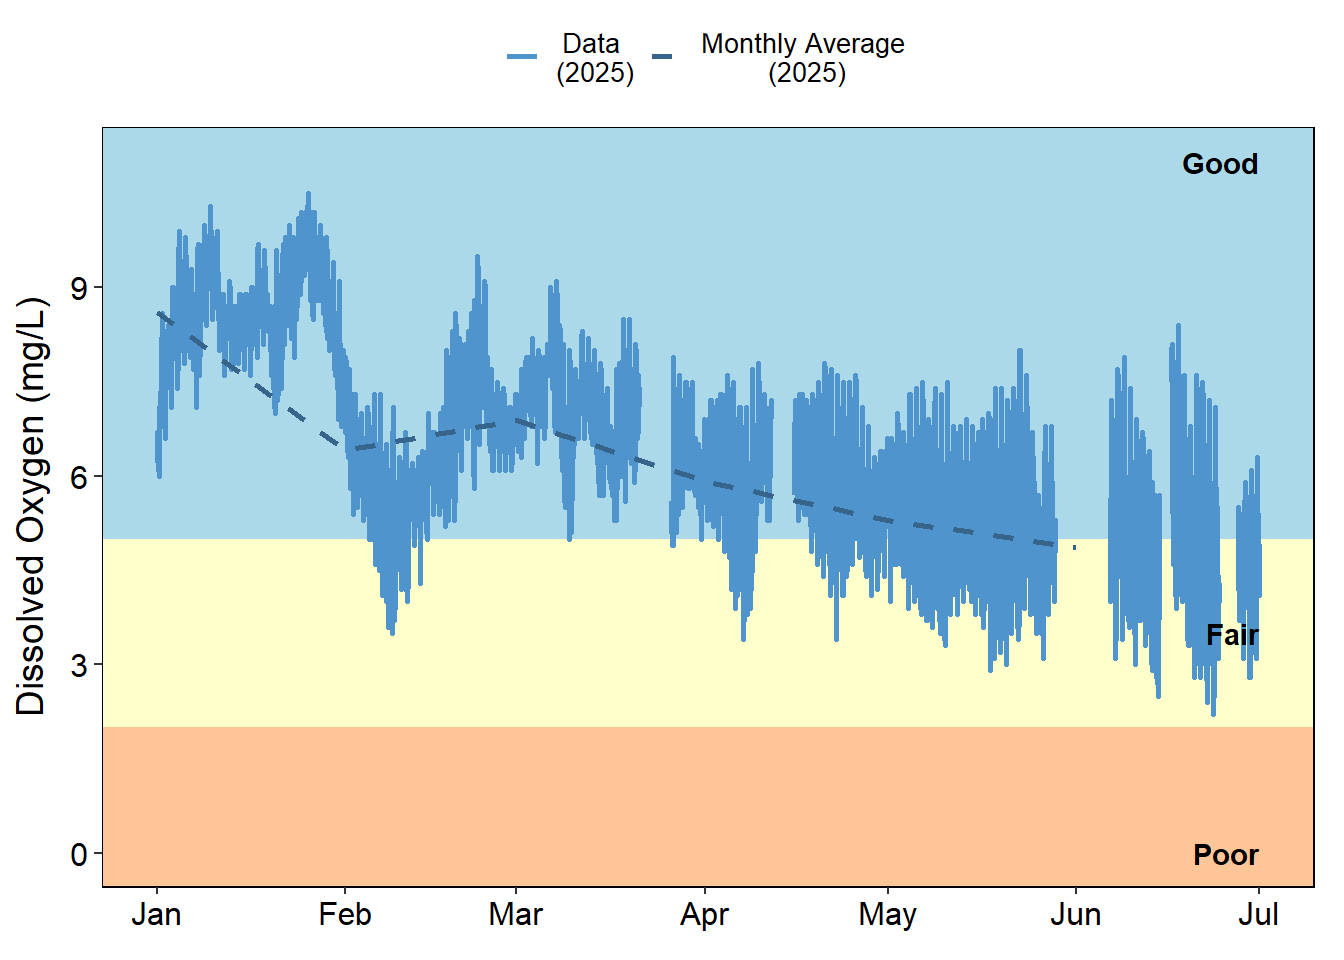
Figure 5.3: Continuous dissolved oxygen at Pellicer Creek with monthly average overlaid in solid gray line. Conditions are indicated as good when above 5 mg/L, fair between 2 and 5 mg/L, and poor if less than 2 mg/L.
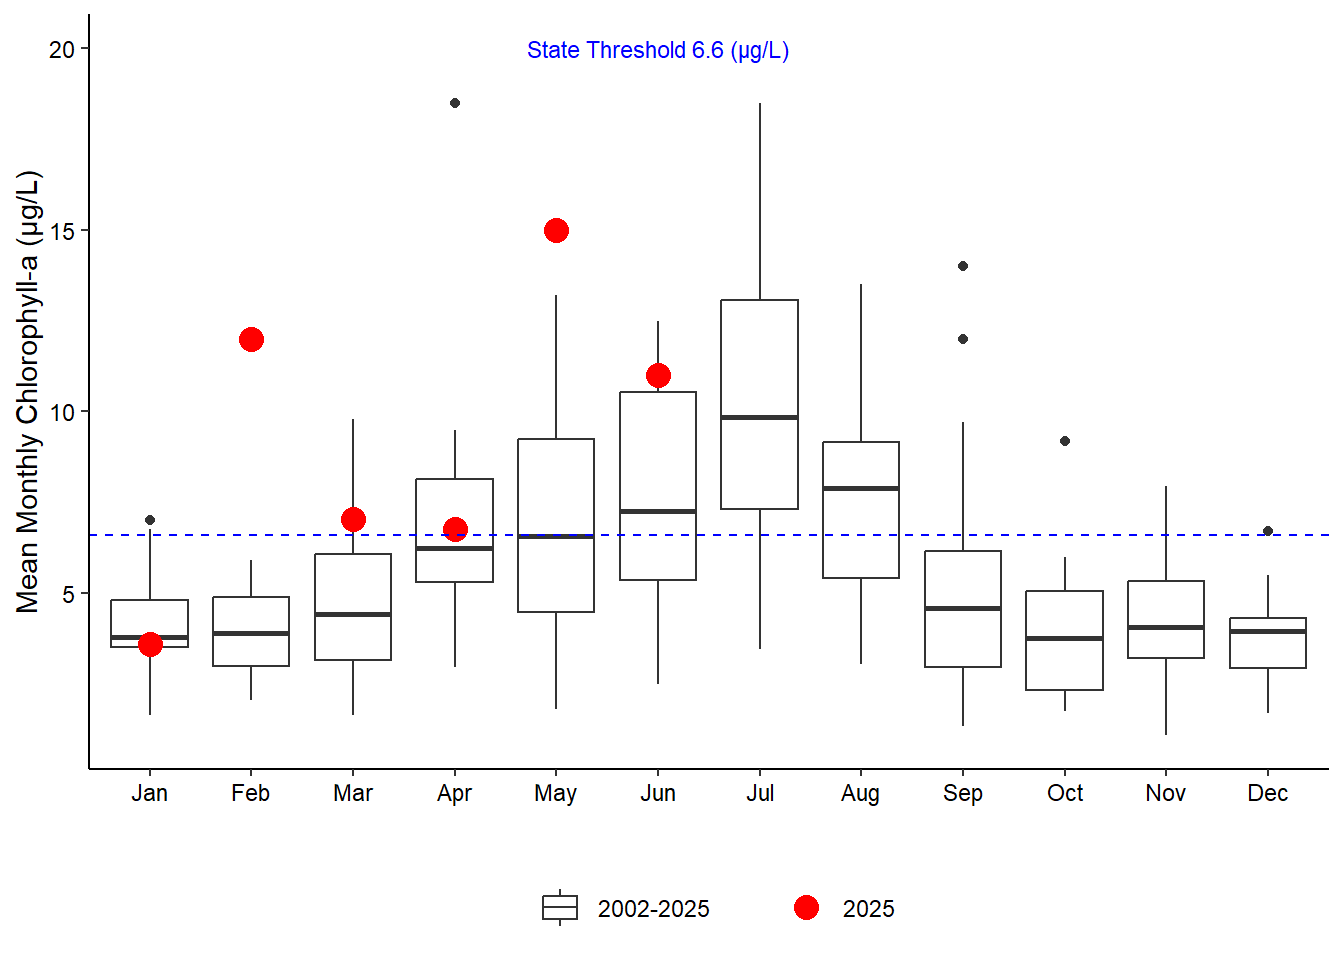
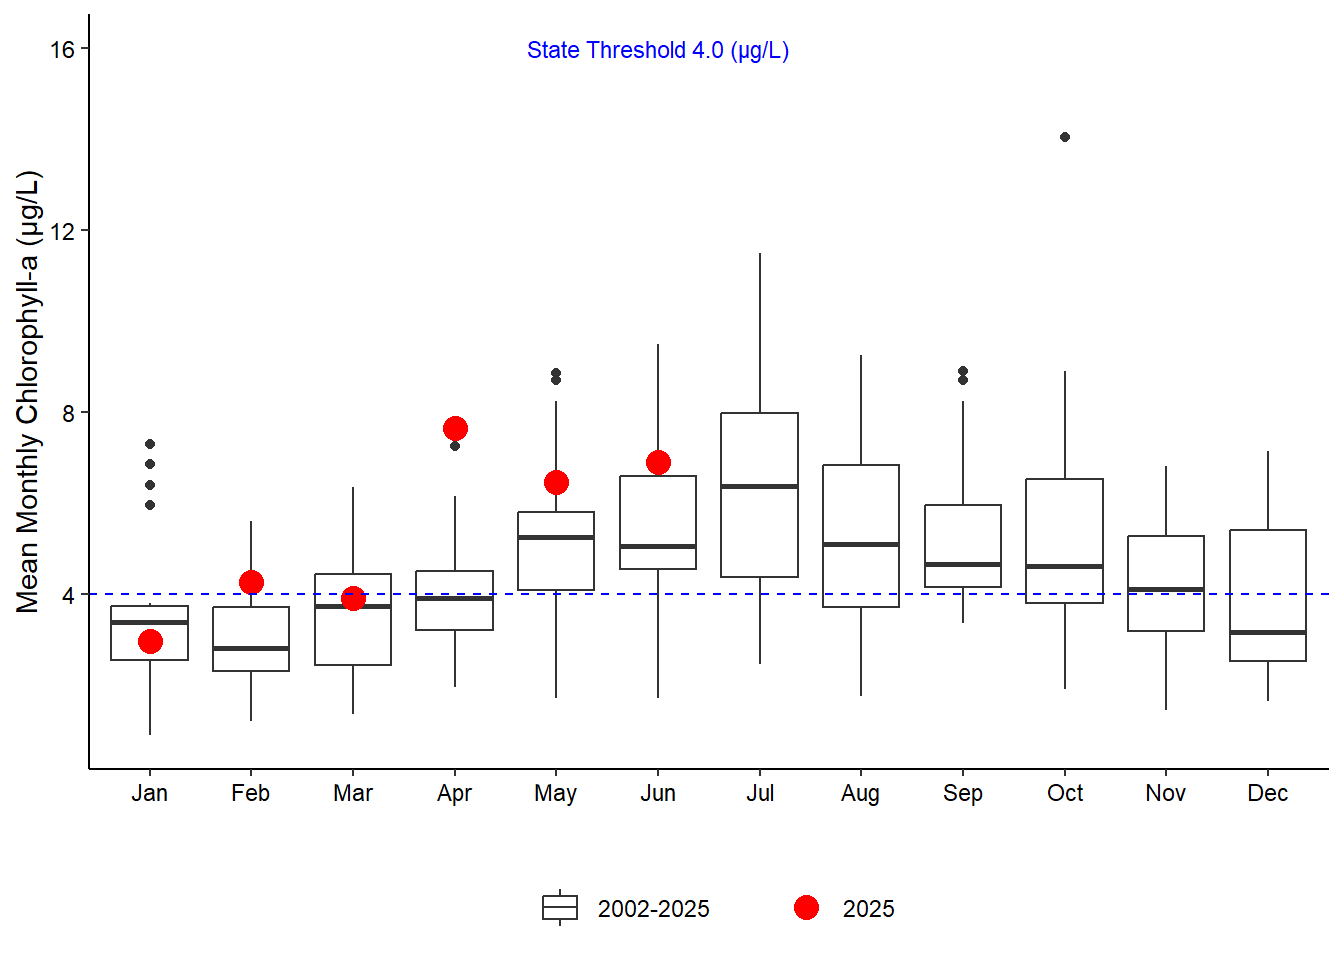
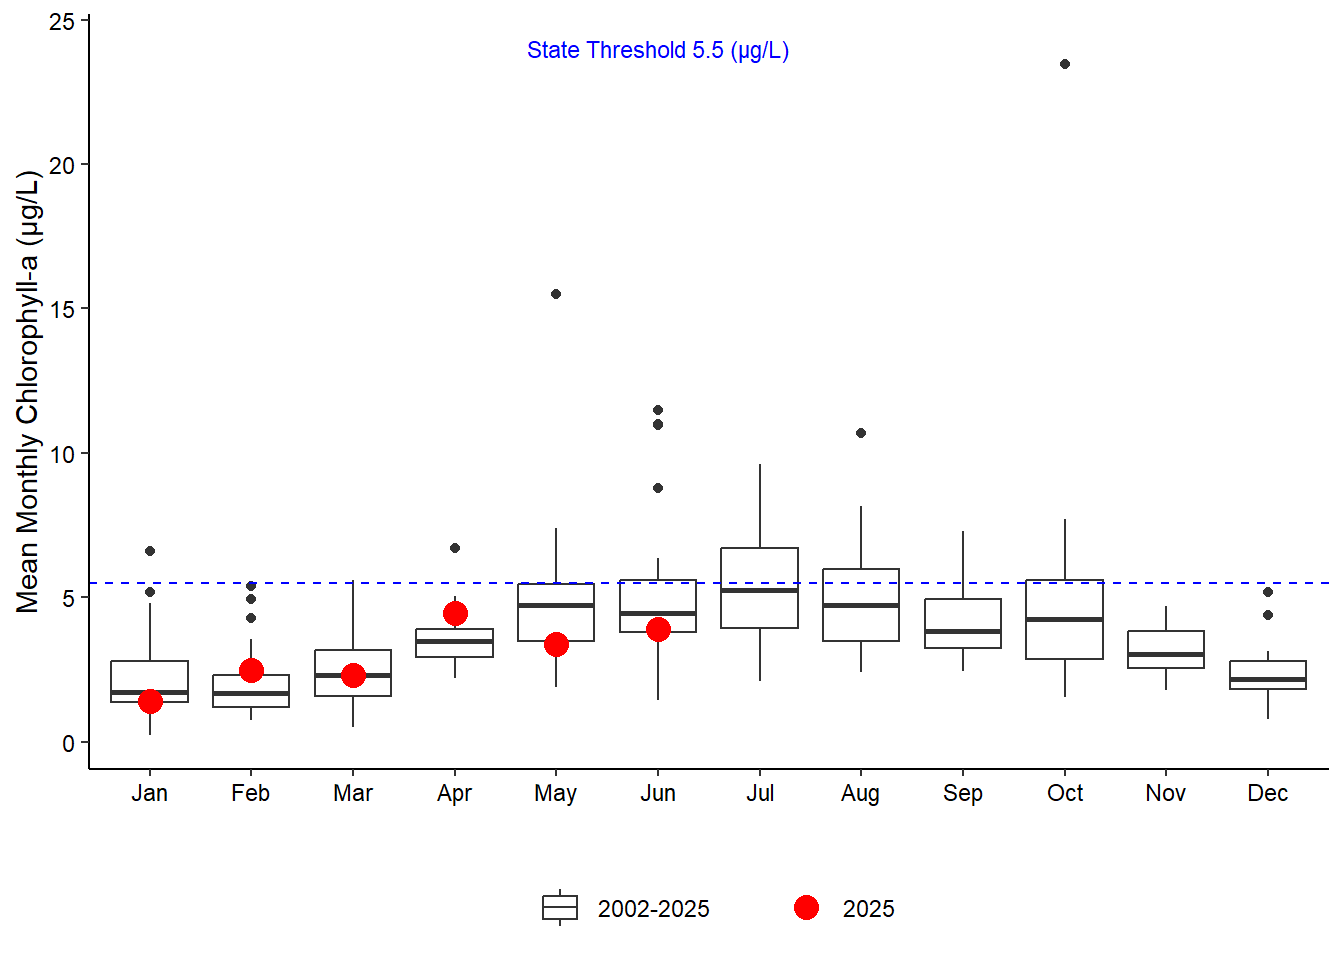
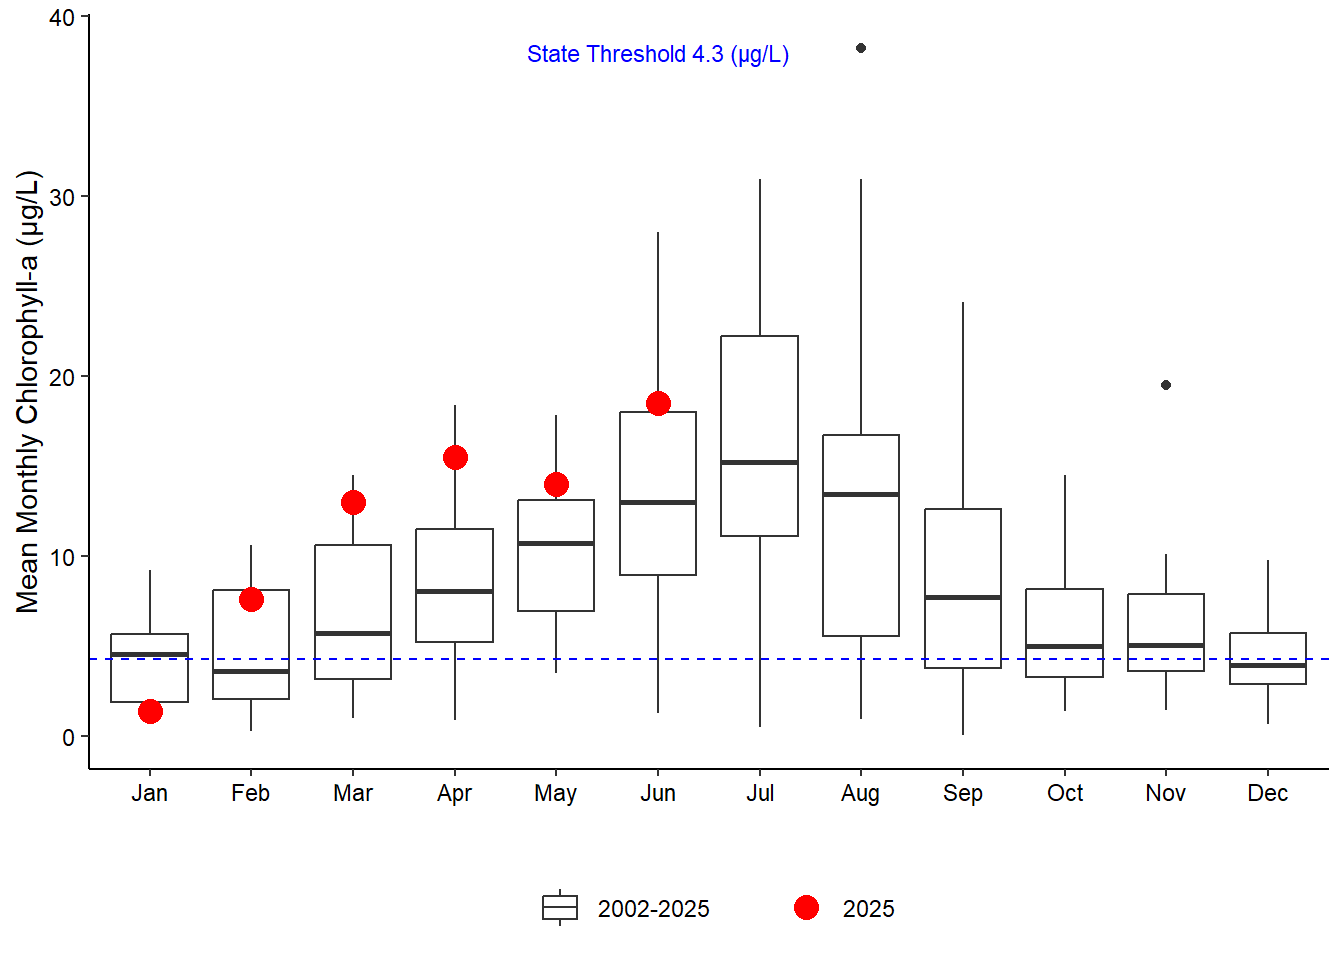
5.2.2 Chlorophyll a
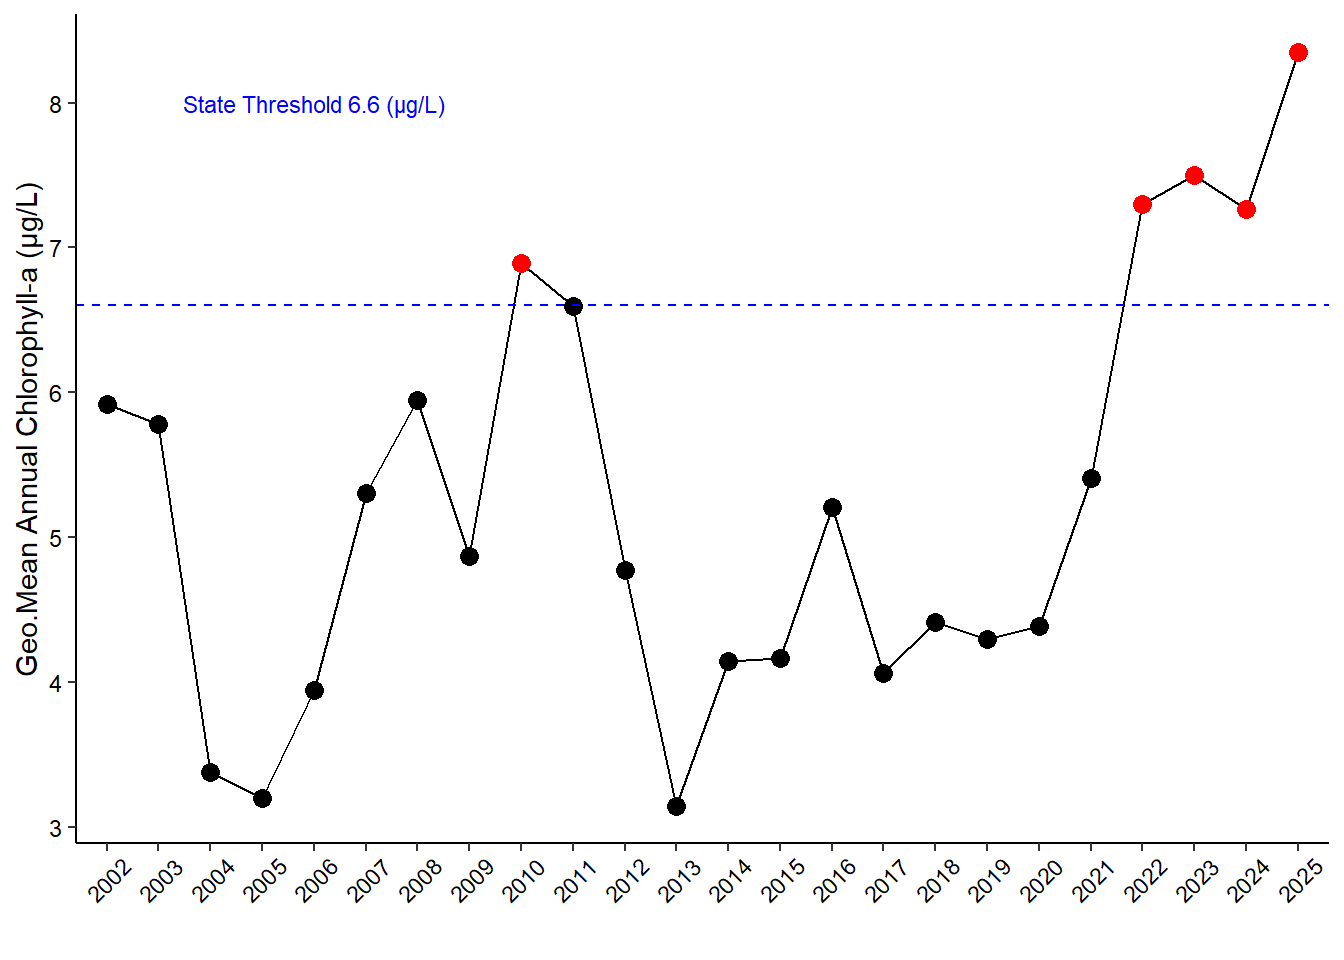
(a) Pine Island
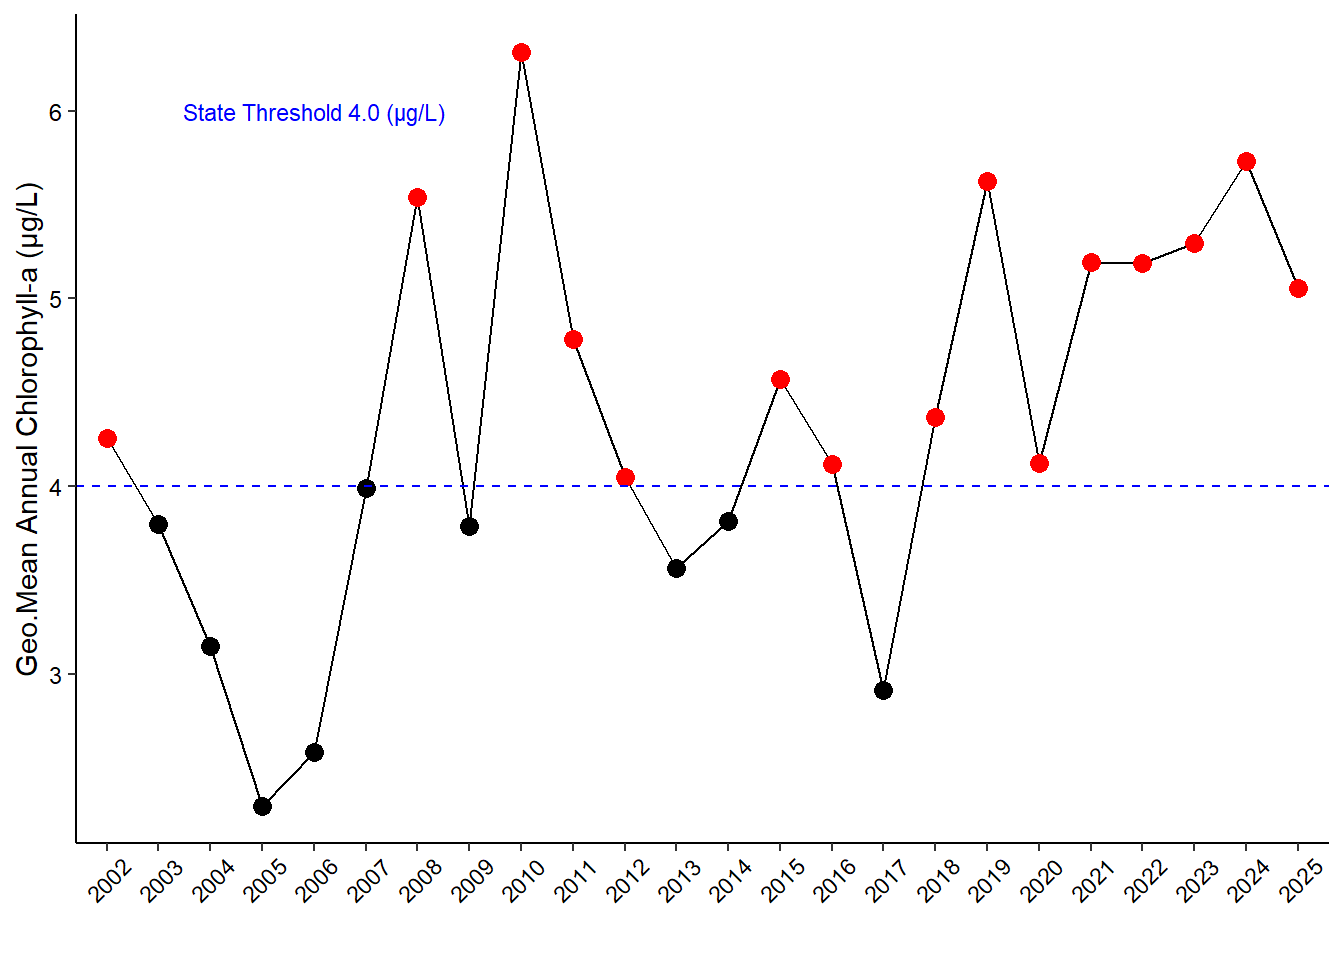
(b) San Sebastian
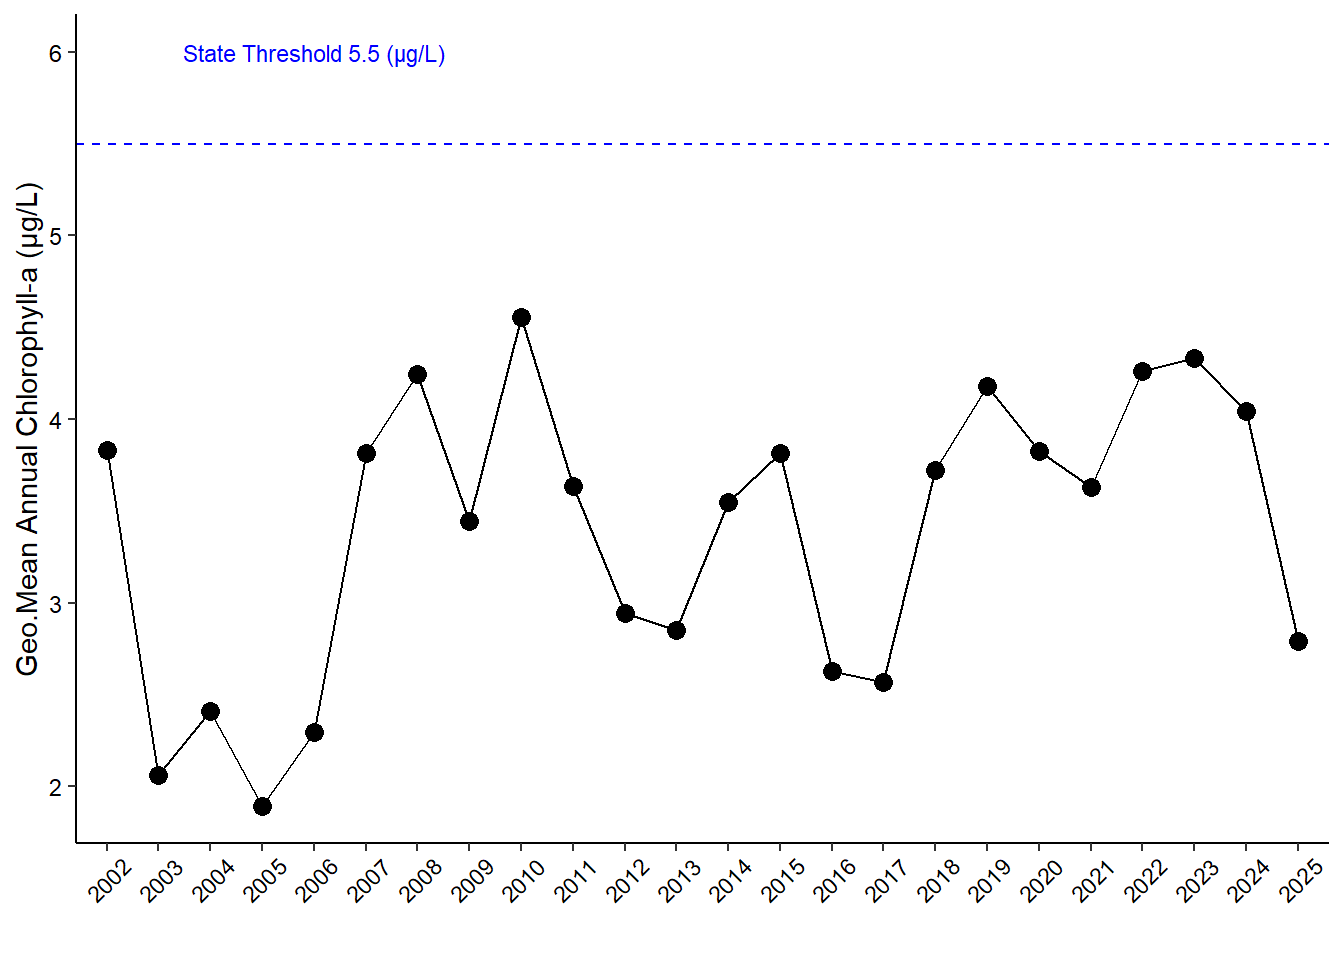
(c) Fort Matanzas
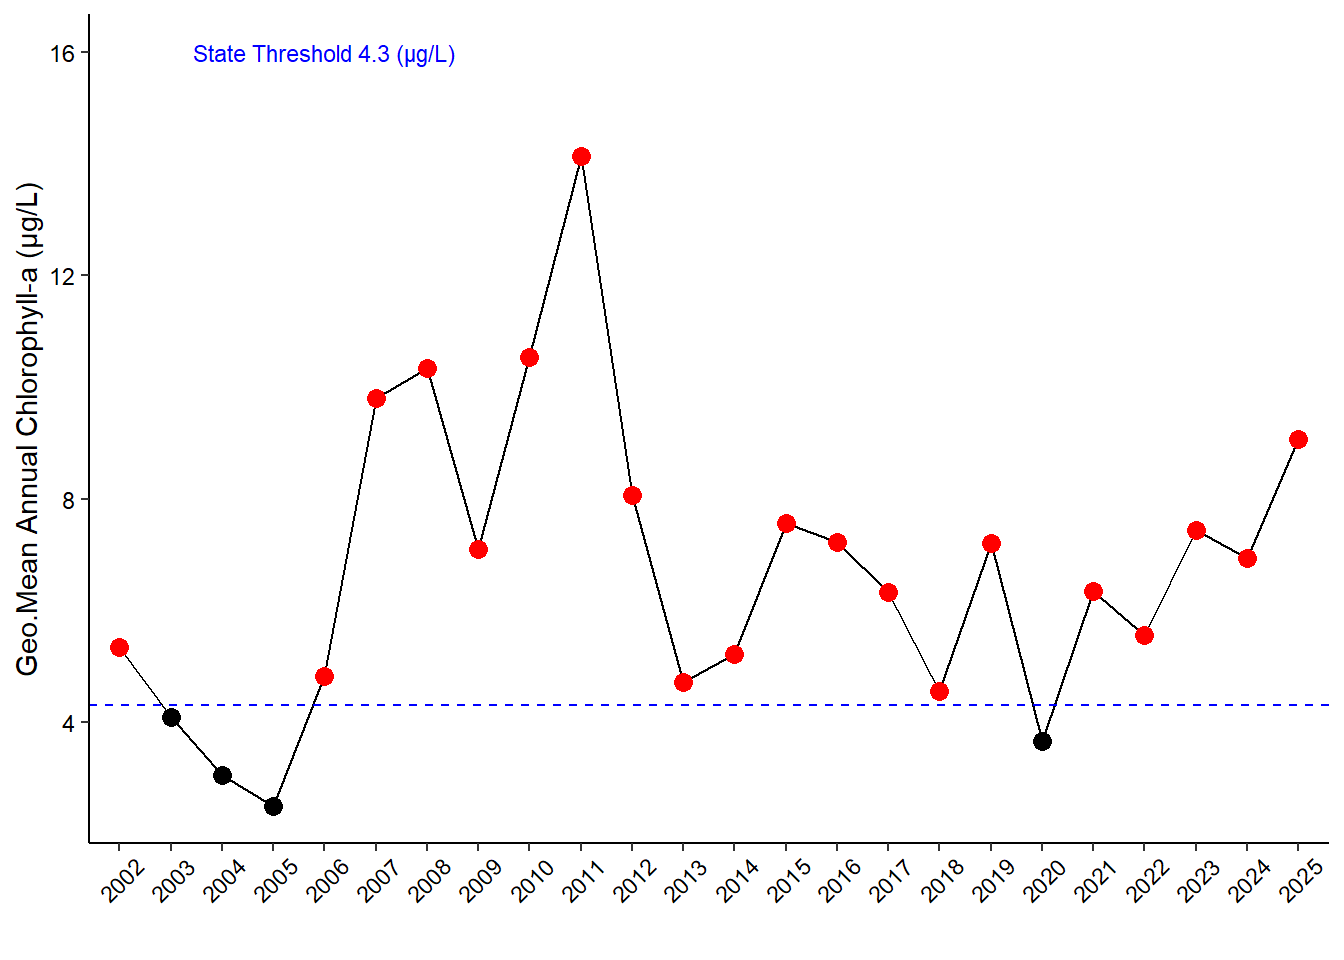
(d) Pellicer Creek
Figure 5.4: Historical monthly chlorophyll a at each SWMP water quality station with current year monthly value overlaid in red. Horizontal dashed blue line indicates the state threshold, as found in F.A.C 62-302.530.
(a) Pine Island
(b) San Sebastian
(c) Fort Matanzas
(d) Pellicer Creek
Figure 5.5: Annual geometric means of monthly chlorophyll a at each SWMP water quality station. Horizontal dashed blue line indicates the state threshold, as found in F.A.C 62-302.530. Values exceeding the threshold are indicated in red. The 2025 value is based upon data to date and does not equal an entire year of data.
5.2.3 Nitrogen
5.2.3.1 Total Nitrogen
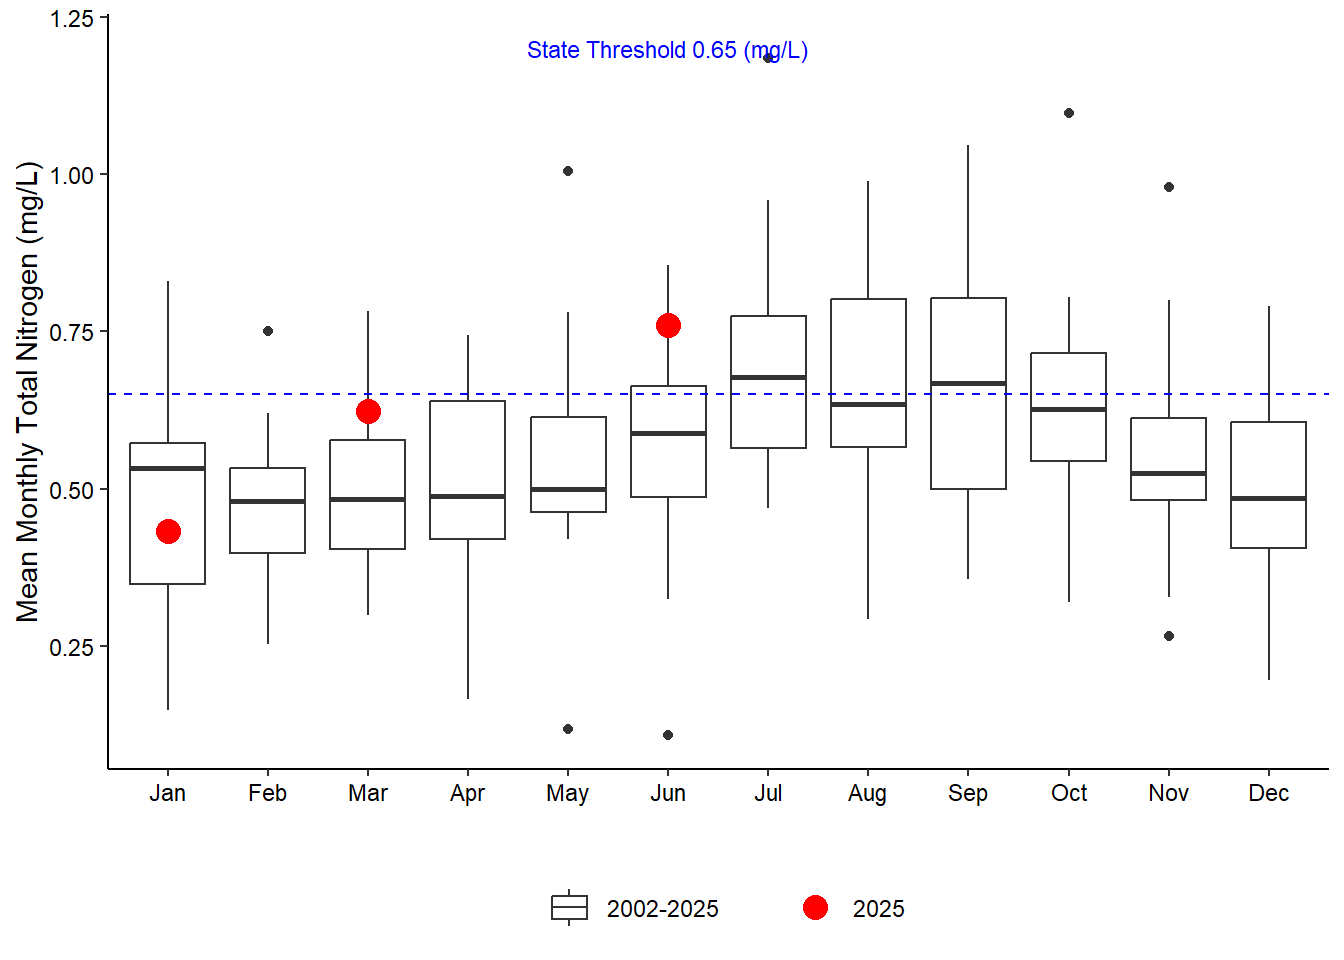
(a) Pine Island
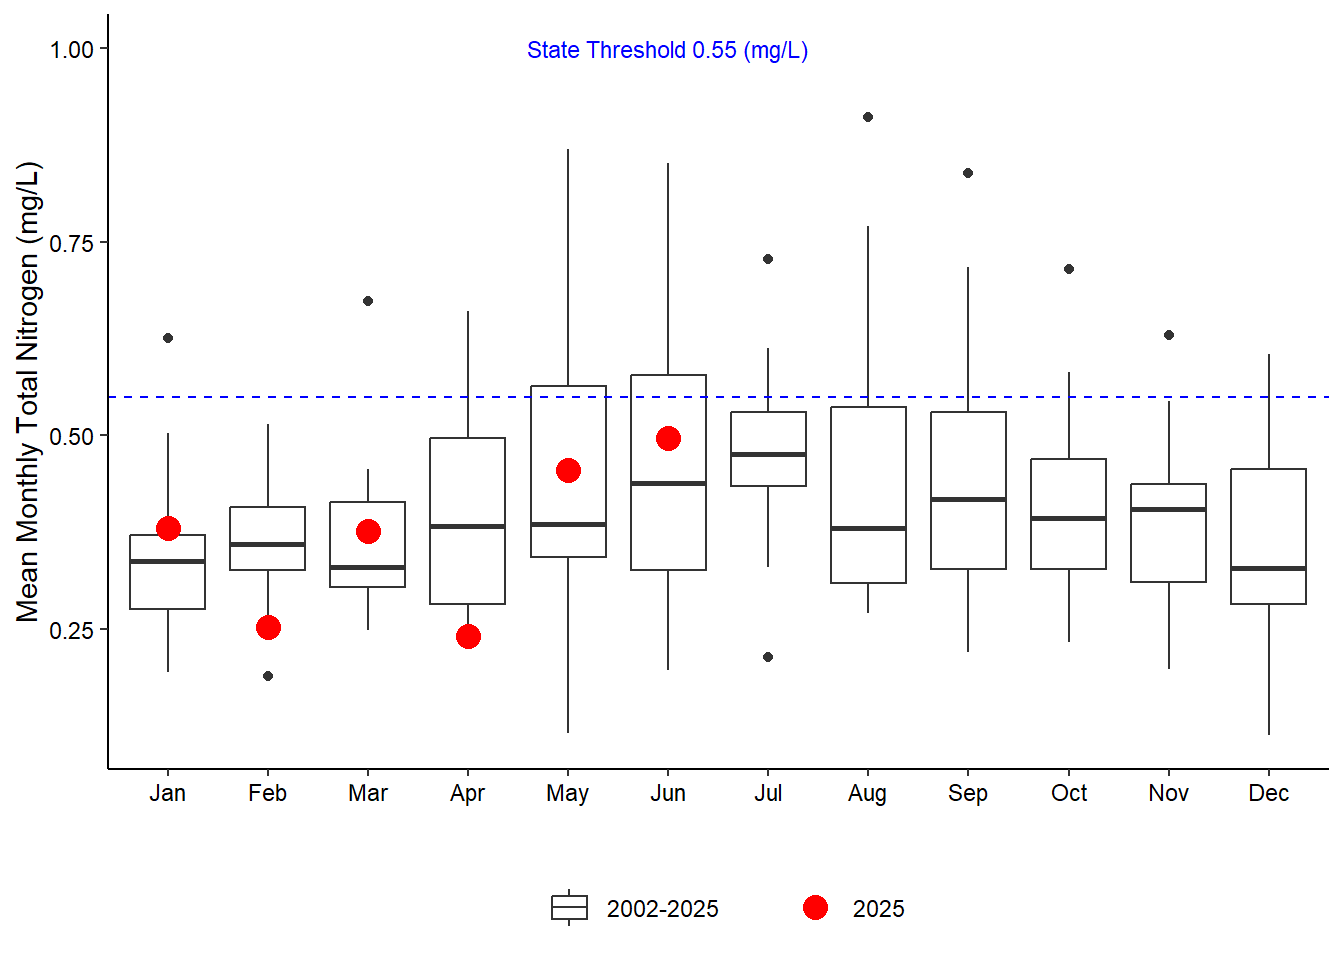
(b) San Sebastian
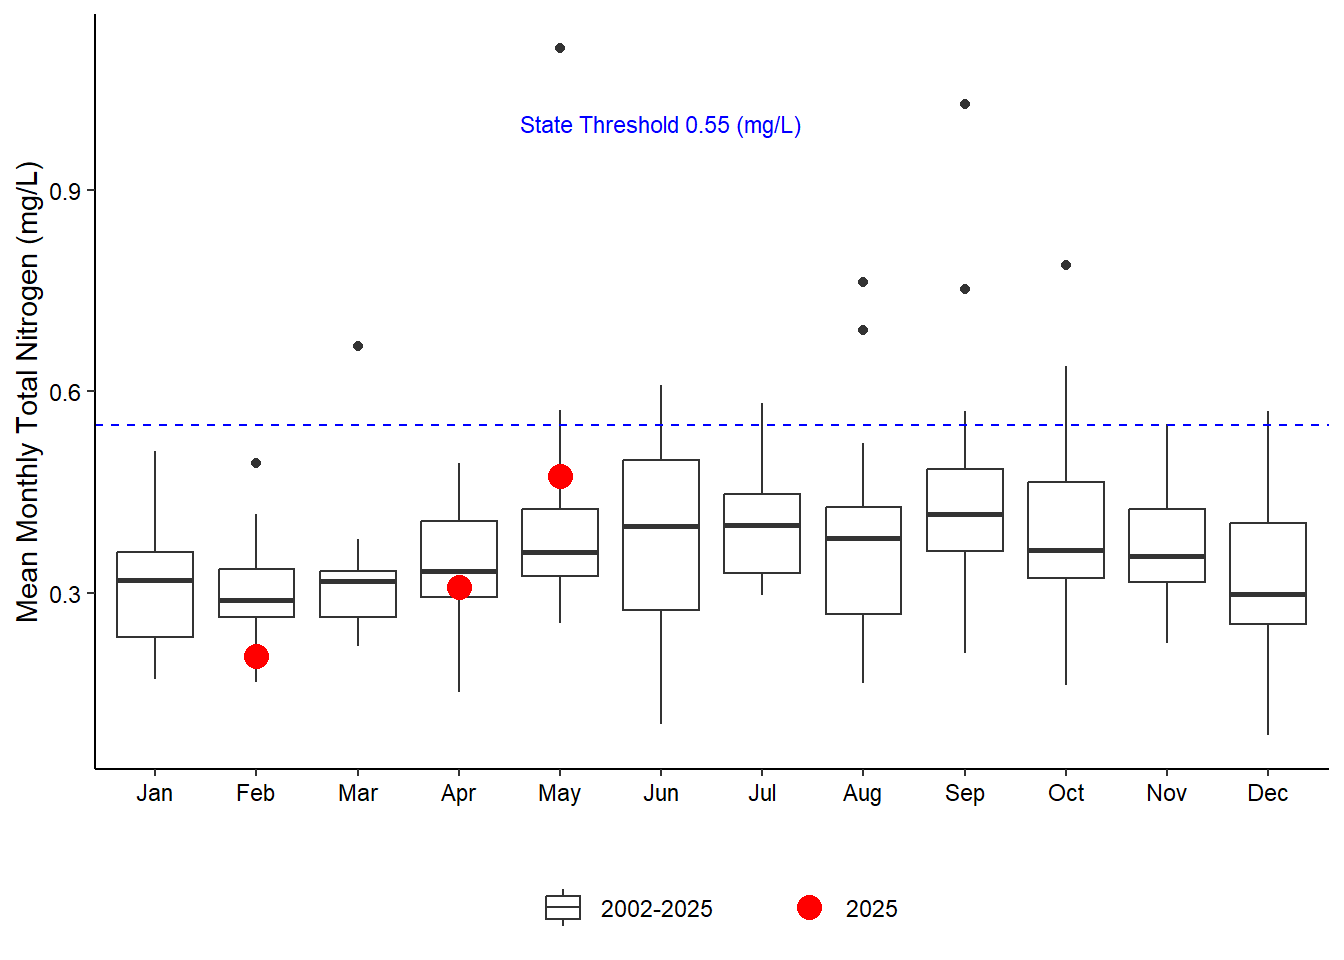
(c) Fort Matanzas
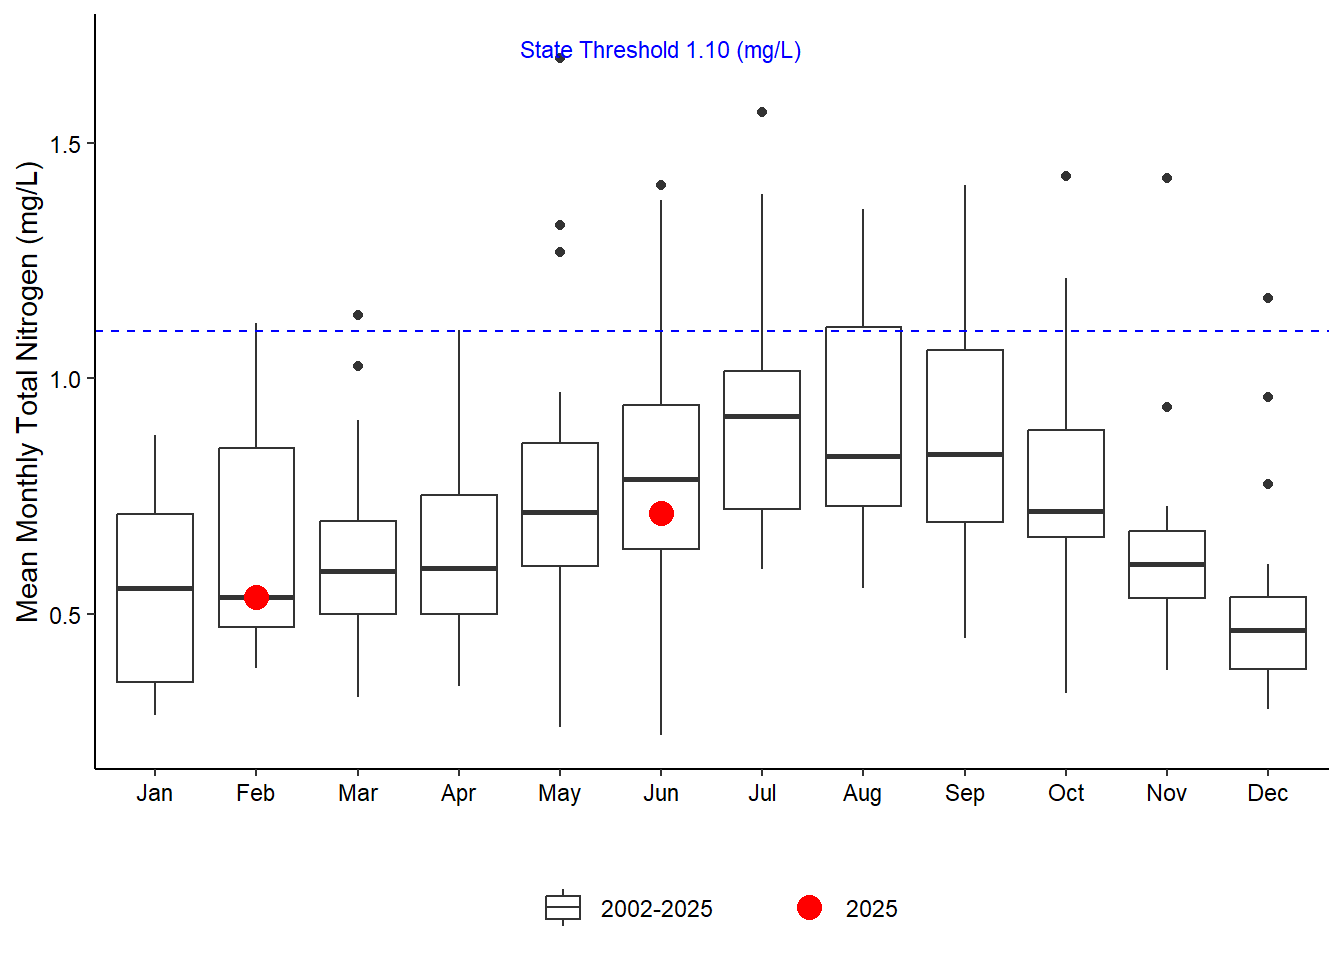
(d) Pellicer Creek
Figure 5.6: Historical monthly total nitrogen at each SWMP water quality station with current year monthly value overlaid in red. Horizontal dashed blue line indicates the state threshold, as found in F.A.C 62-302.530.
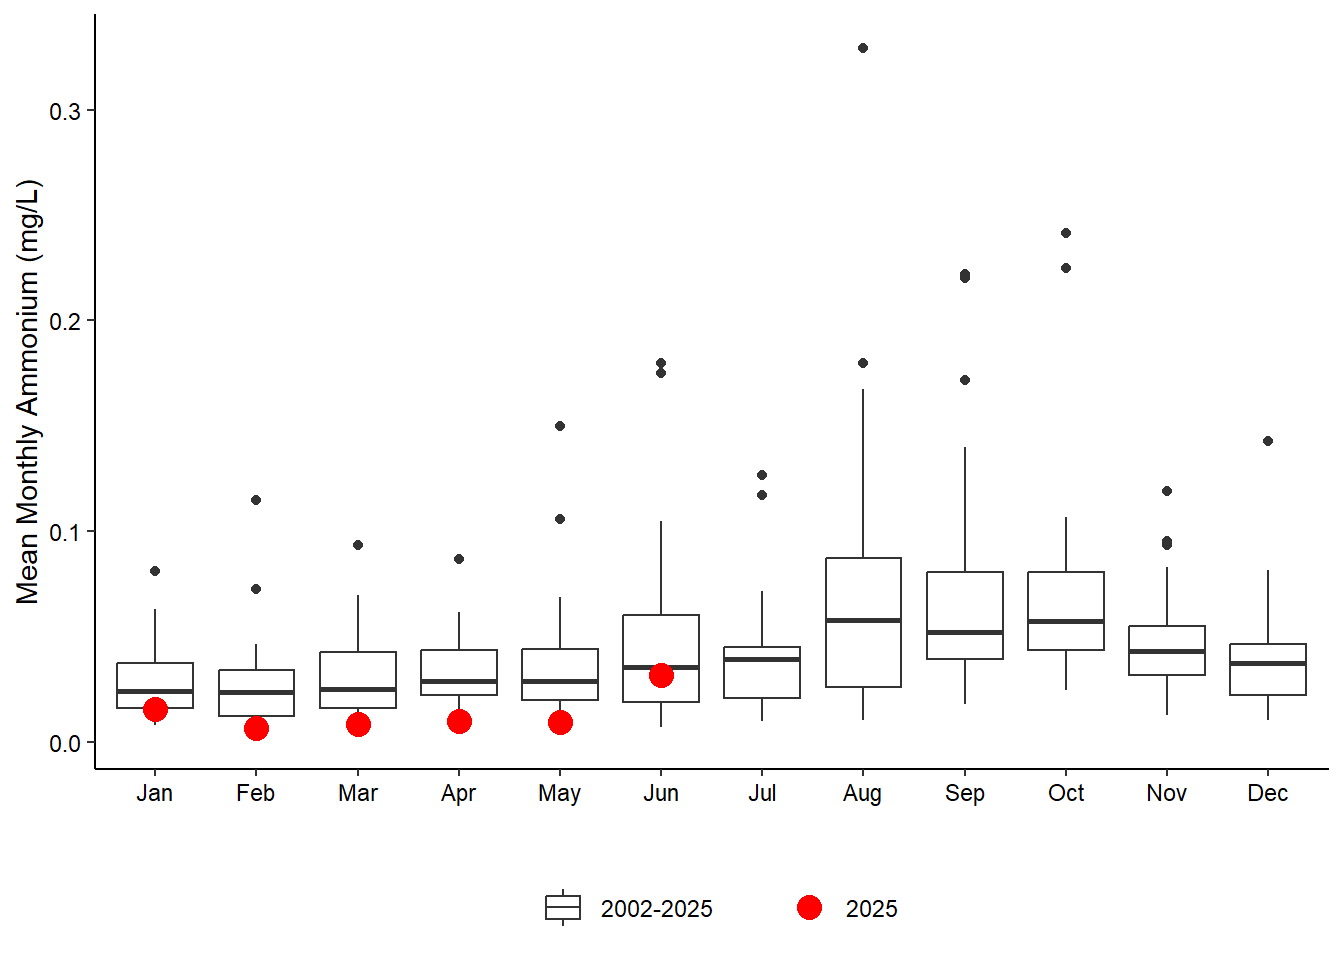
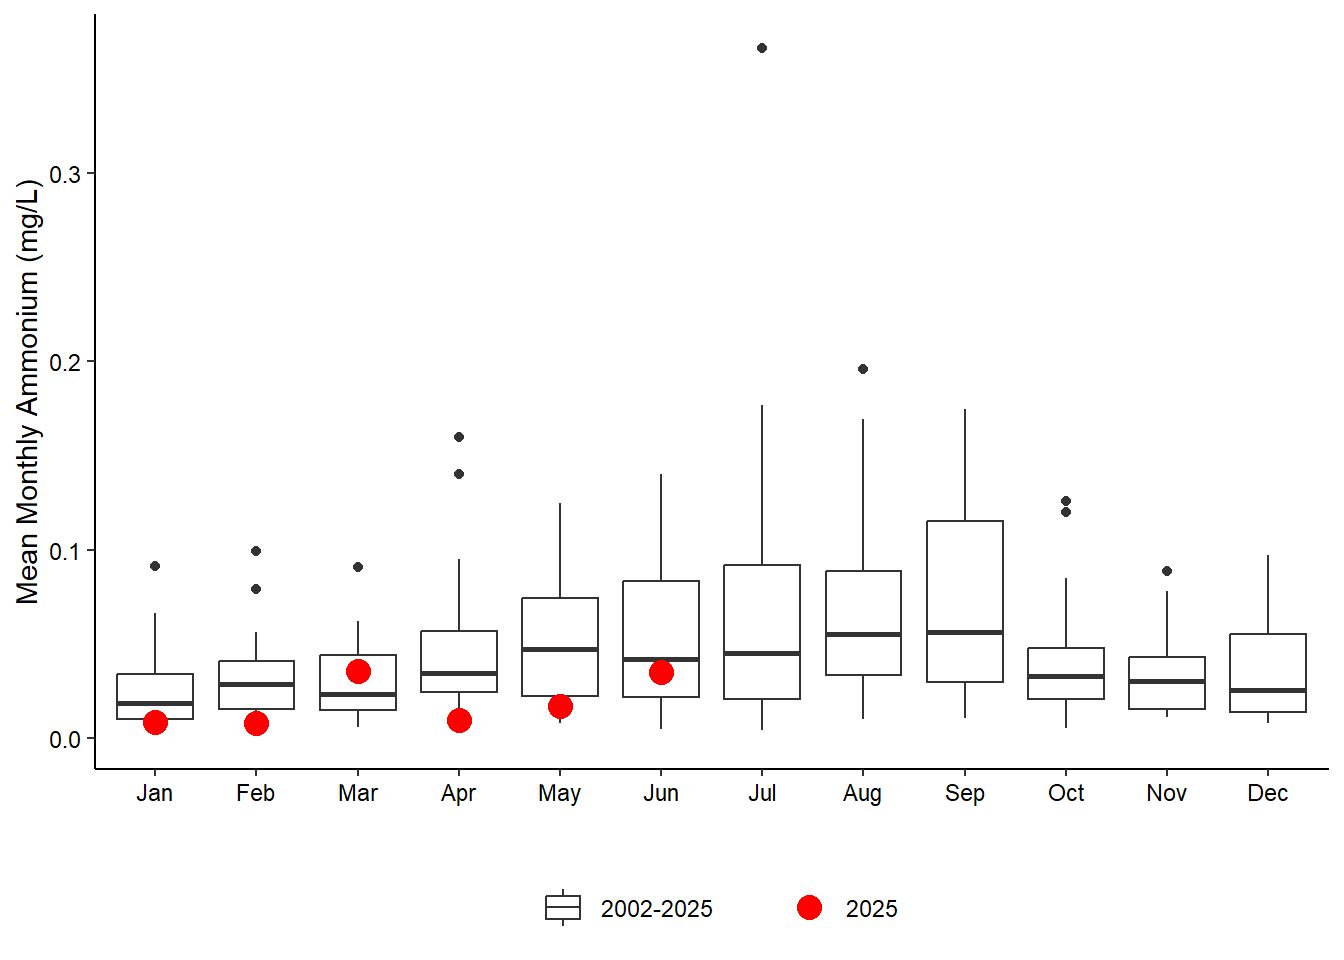
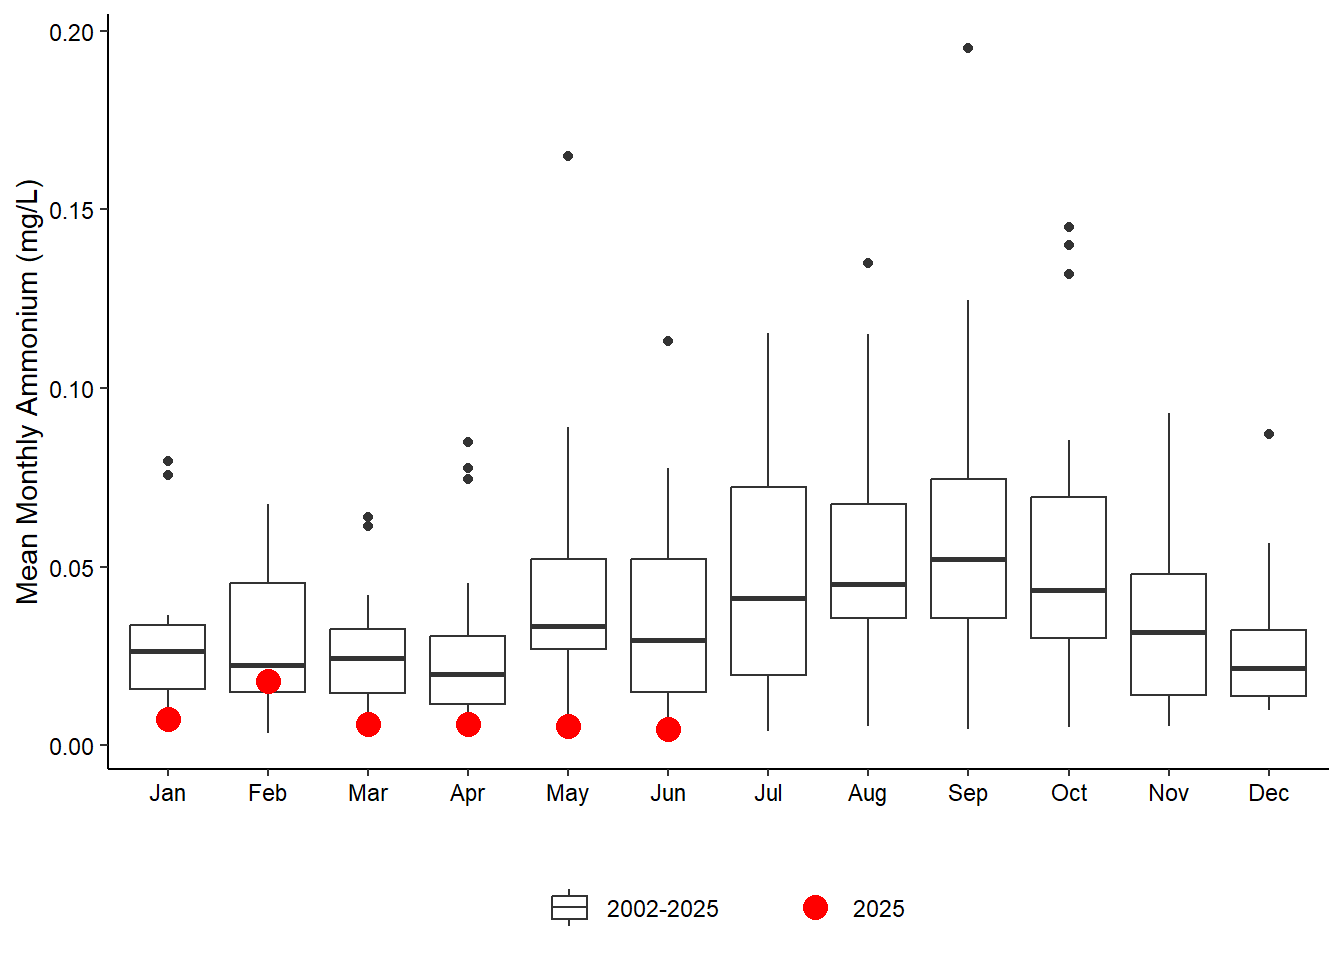
5.2.3.2 Ammonium
(a) Pine Island
(b) San Sebastian
(c) Fort Matanzas
(d) Pellicer Creek
Figure 5.7: Historical monthly ammonium at each SWMP water quality station with current year monthly value overlaid in red.
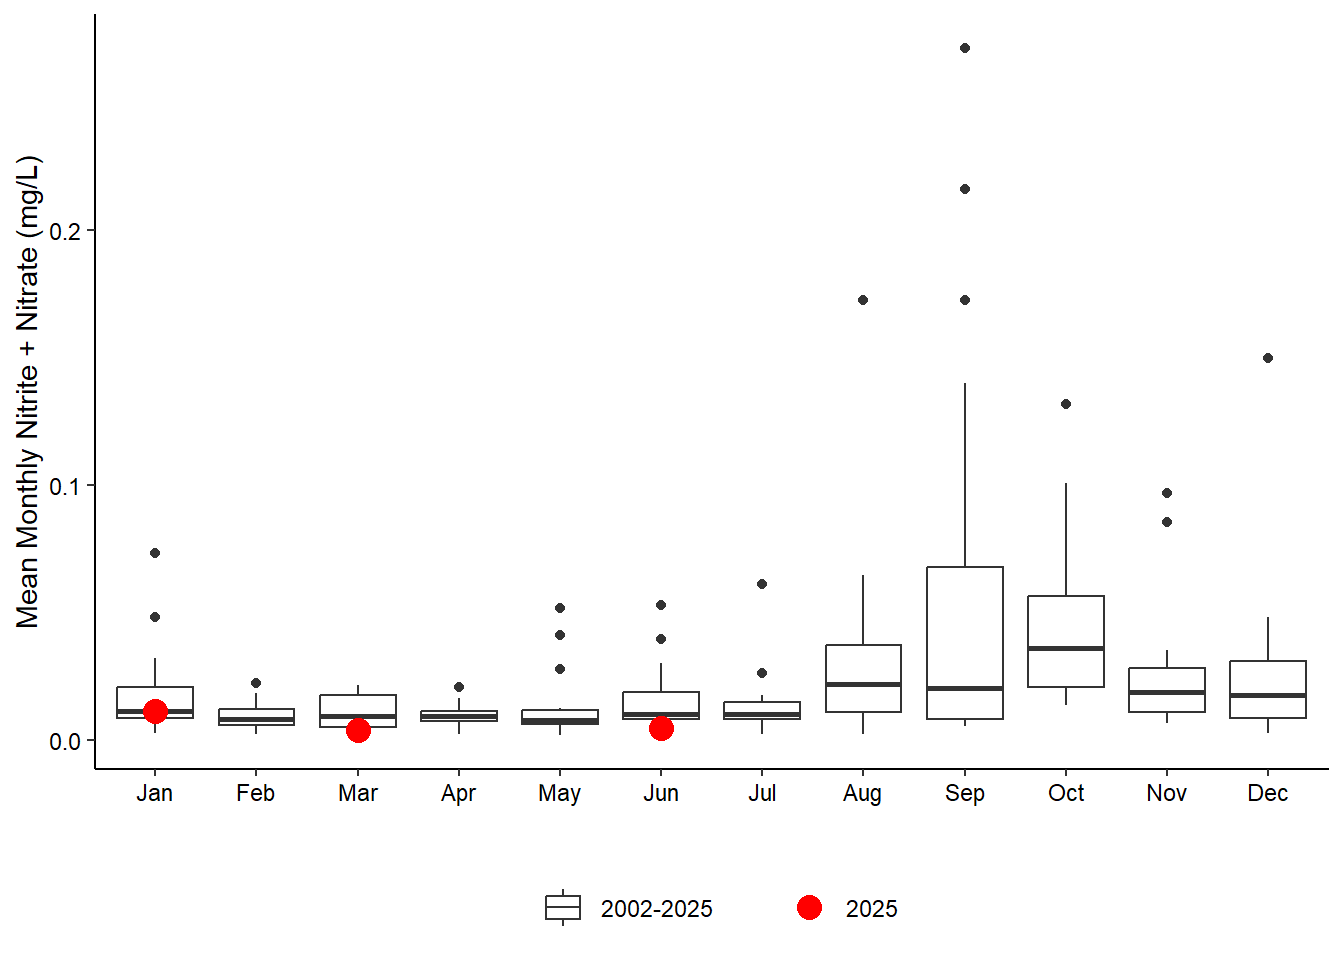
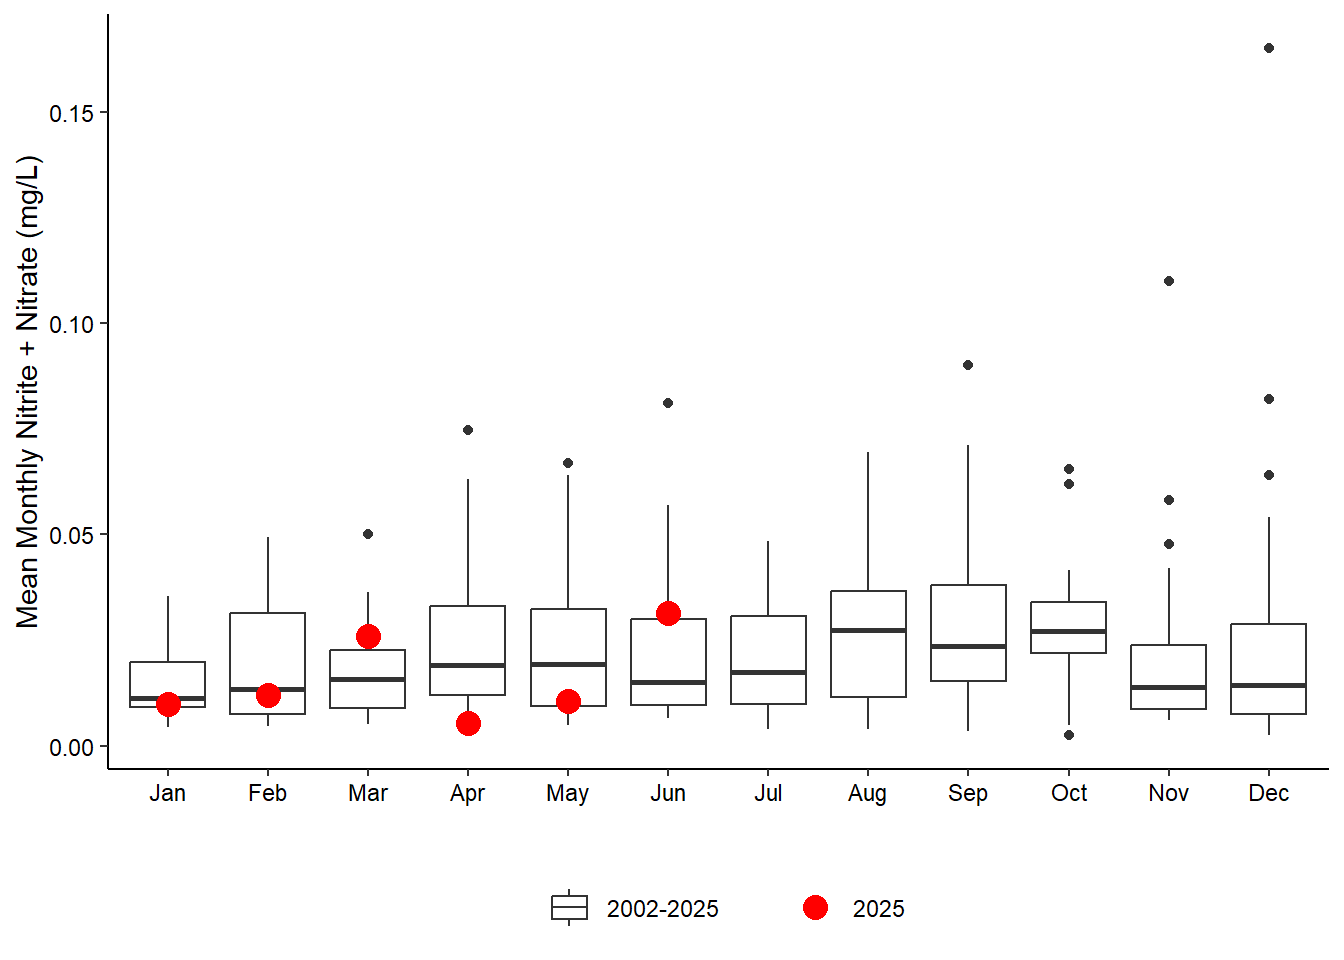
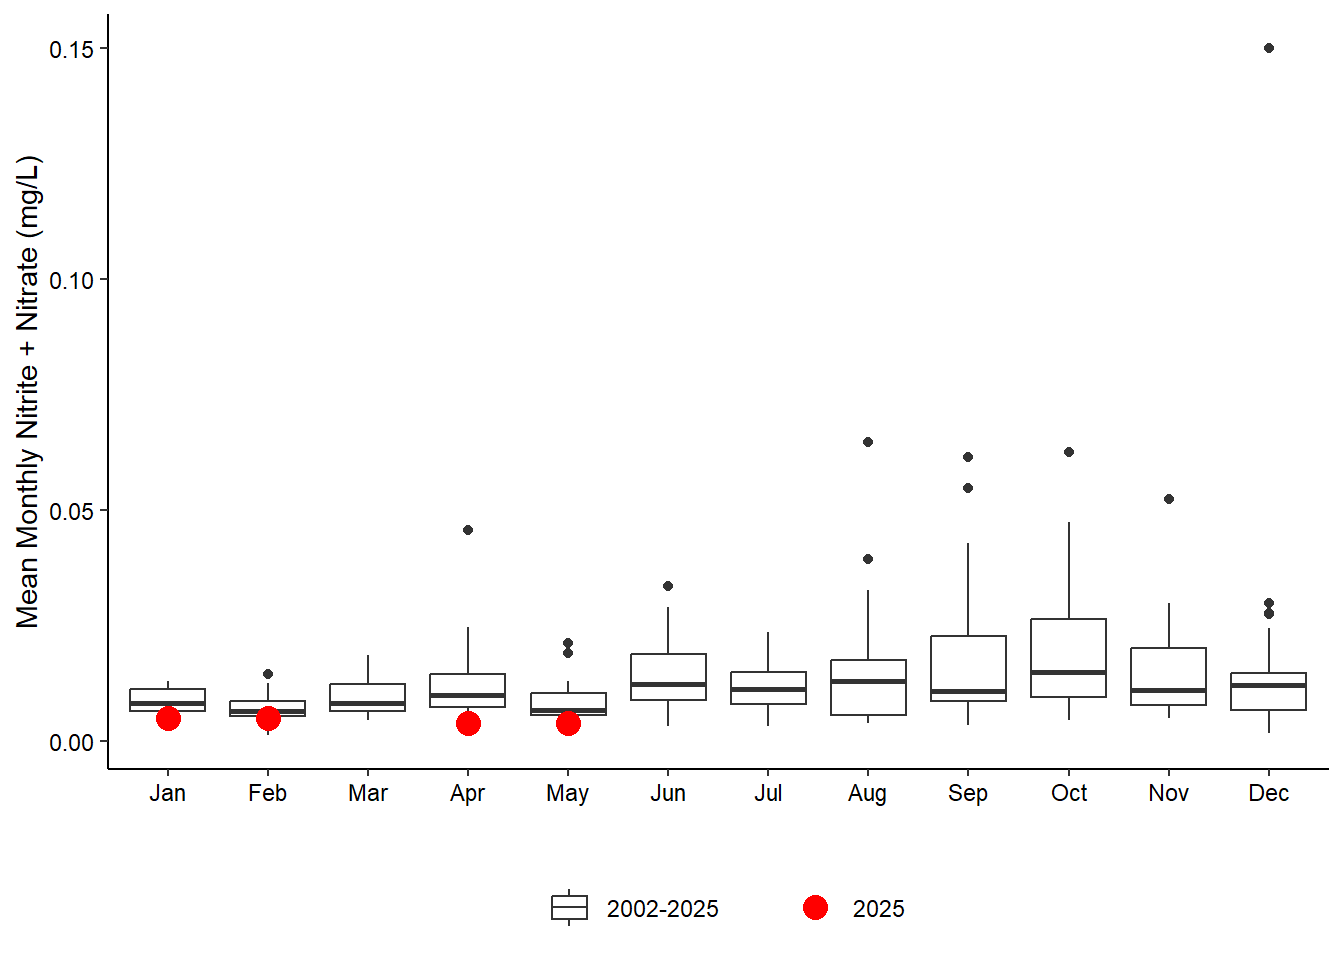
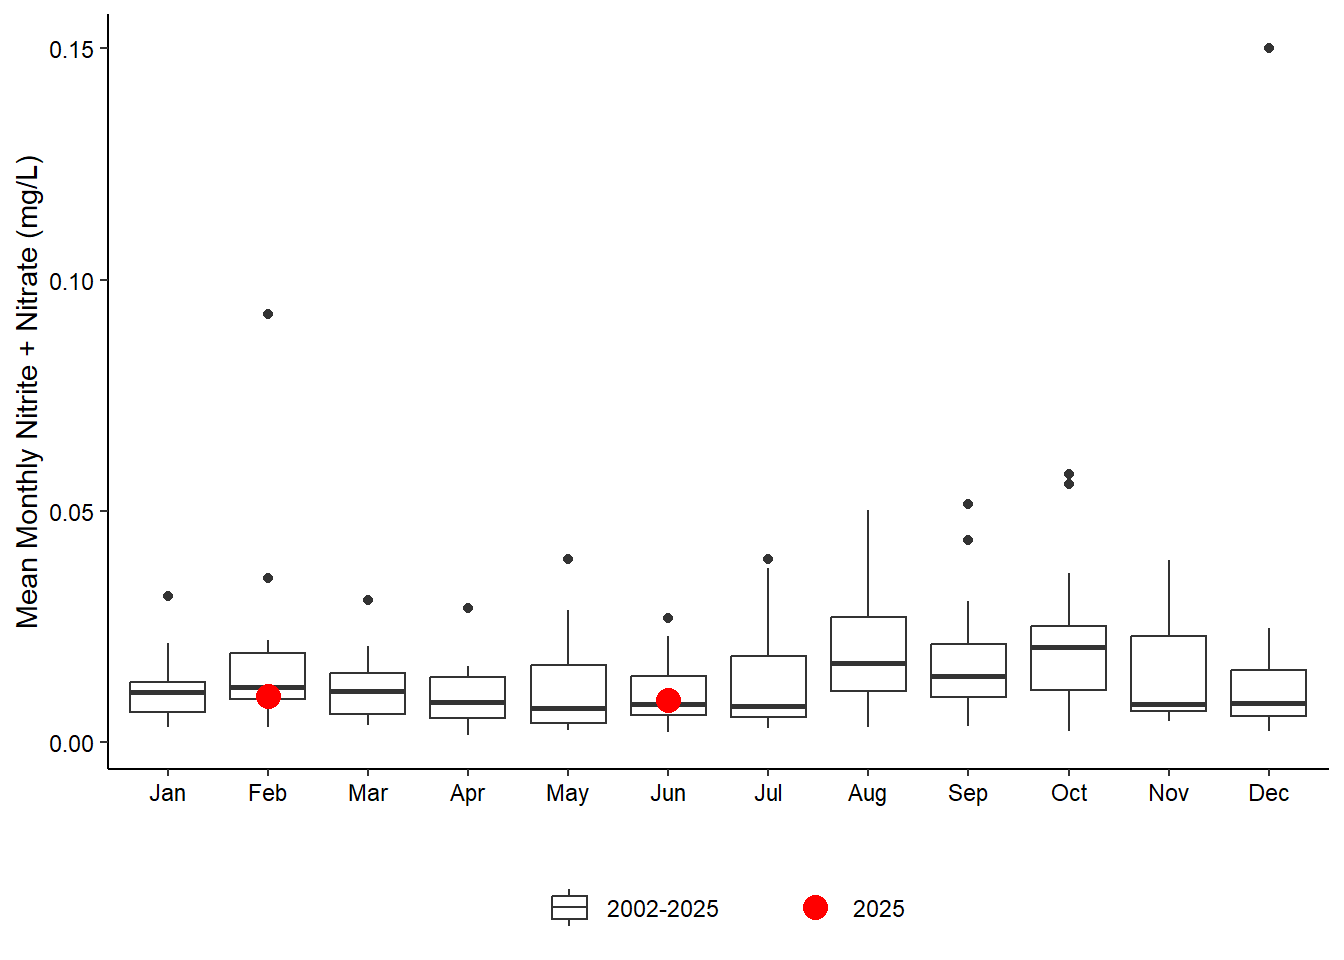
5.2.3.3 Nitrite + Nitrate
(a) Pine Island
(b) San Sebastian
(c) Fort Matanzas
(d) Pellicer Creek
Figure 5.8: Historical monthly nitrite + nitrate at each SWMP water quality station with current year monthly value overlaid in red.
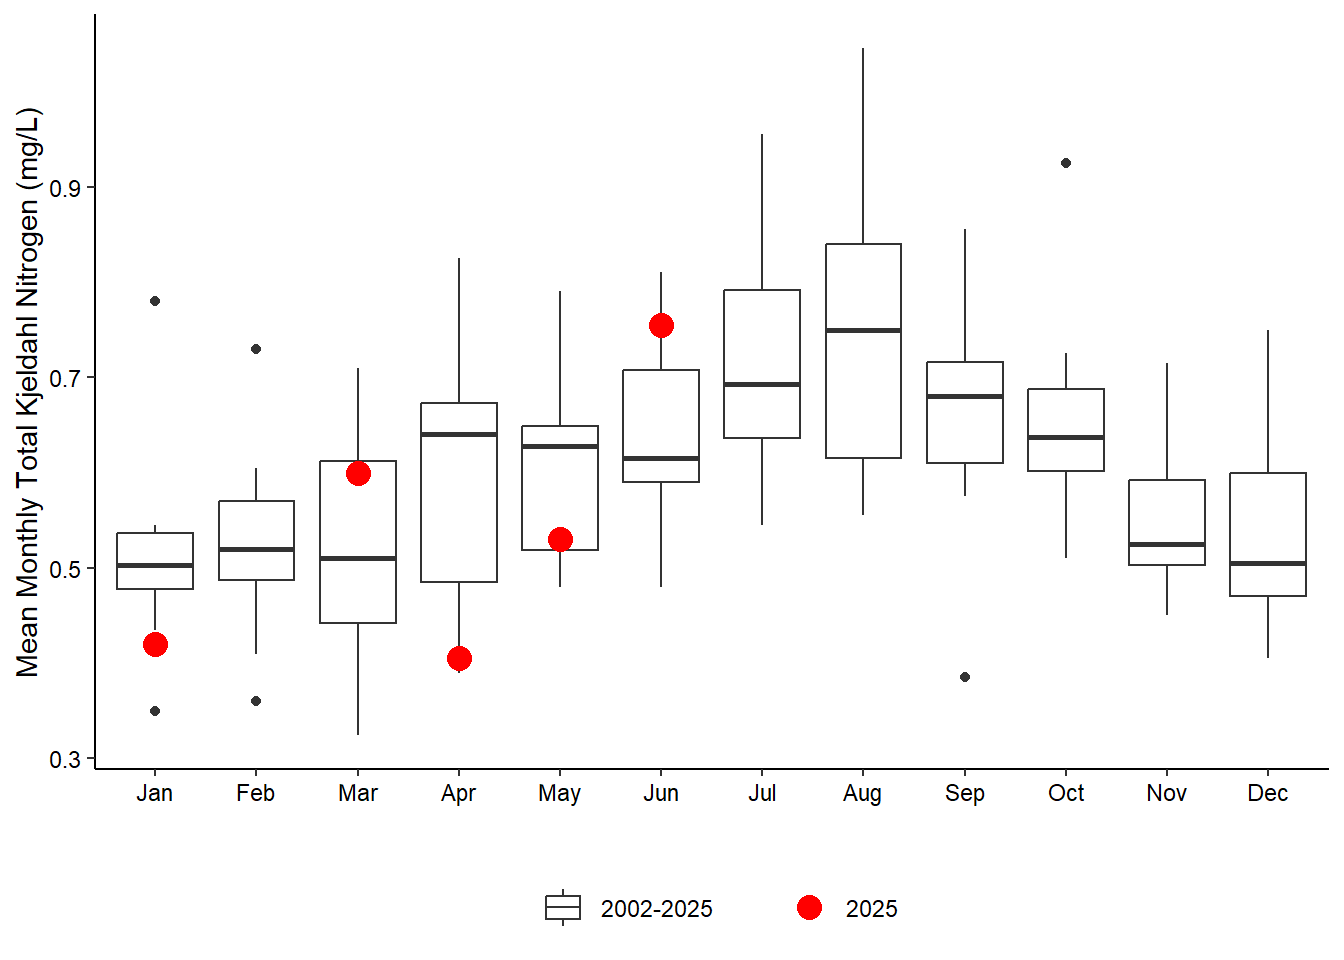
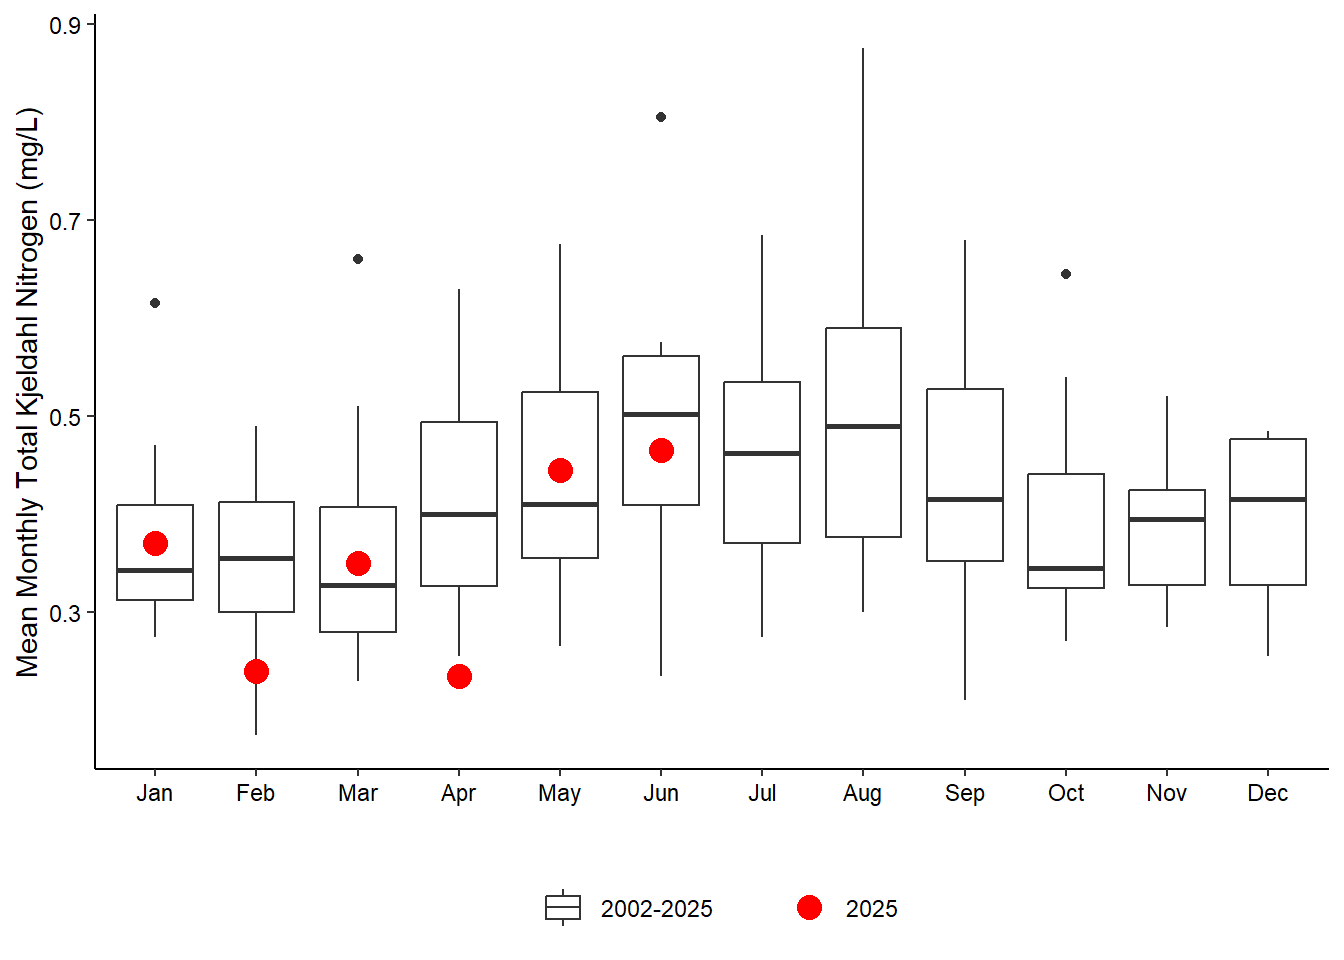
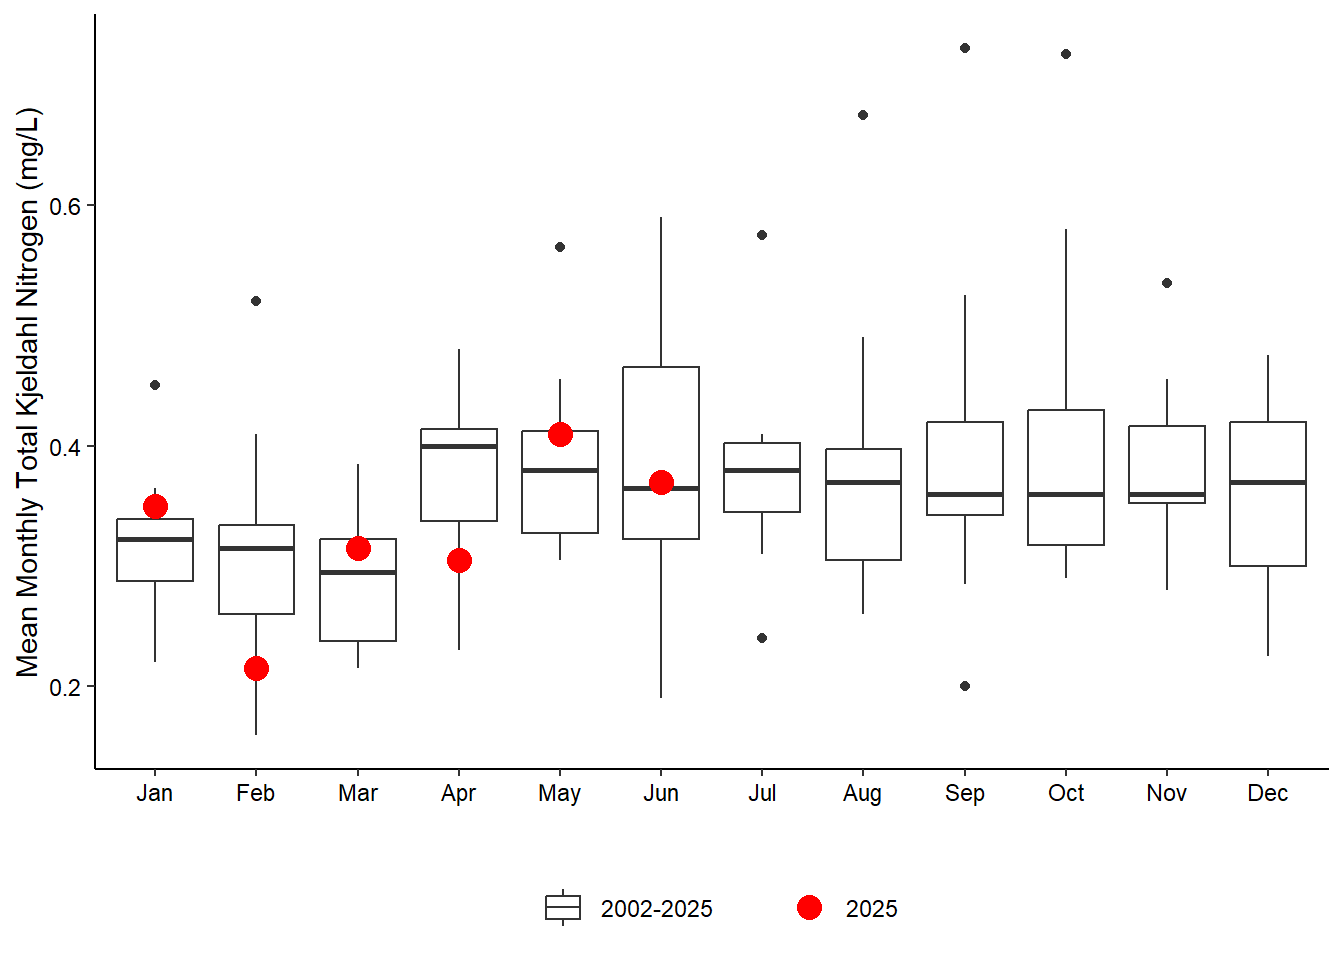
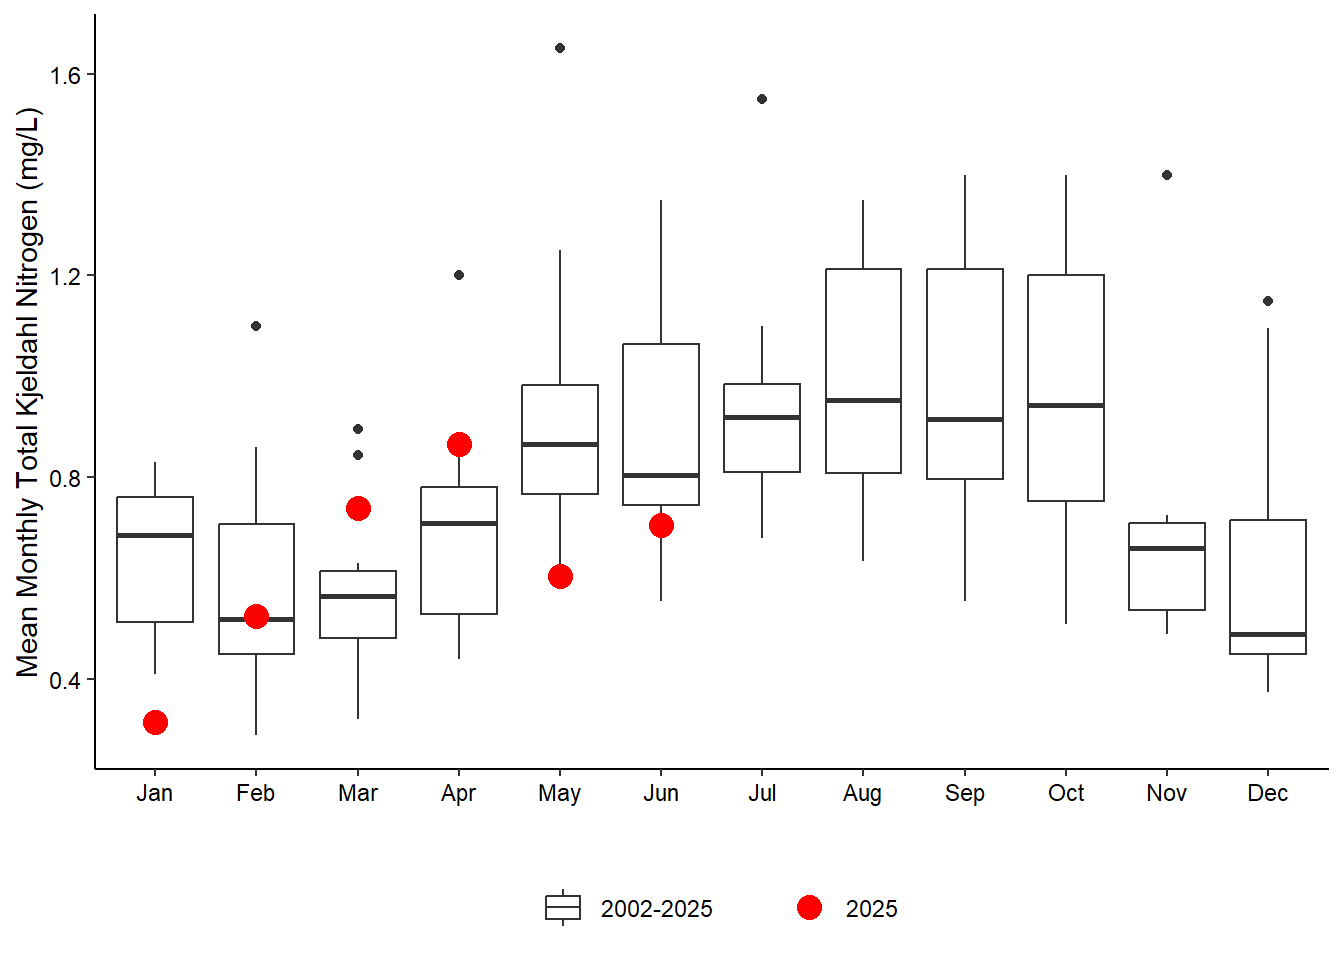
5.2.3.4 Total Kjeldahl Nitrogen
(a) Pine Island
(b) San Sebastian
(c) Fort Matanzas
(d) Pellicer Creek
Figure 5.9: Historical monthly total kjeldahl nitrogen at each SWMP water quality station with current year monthly value overlaid in red.
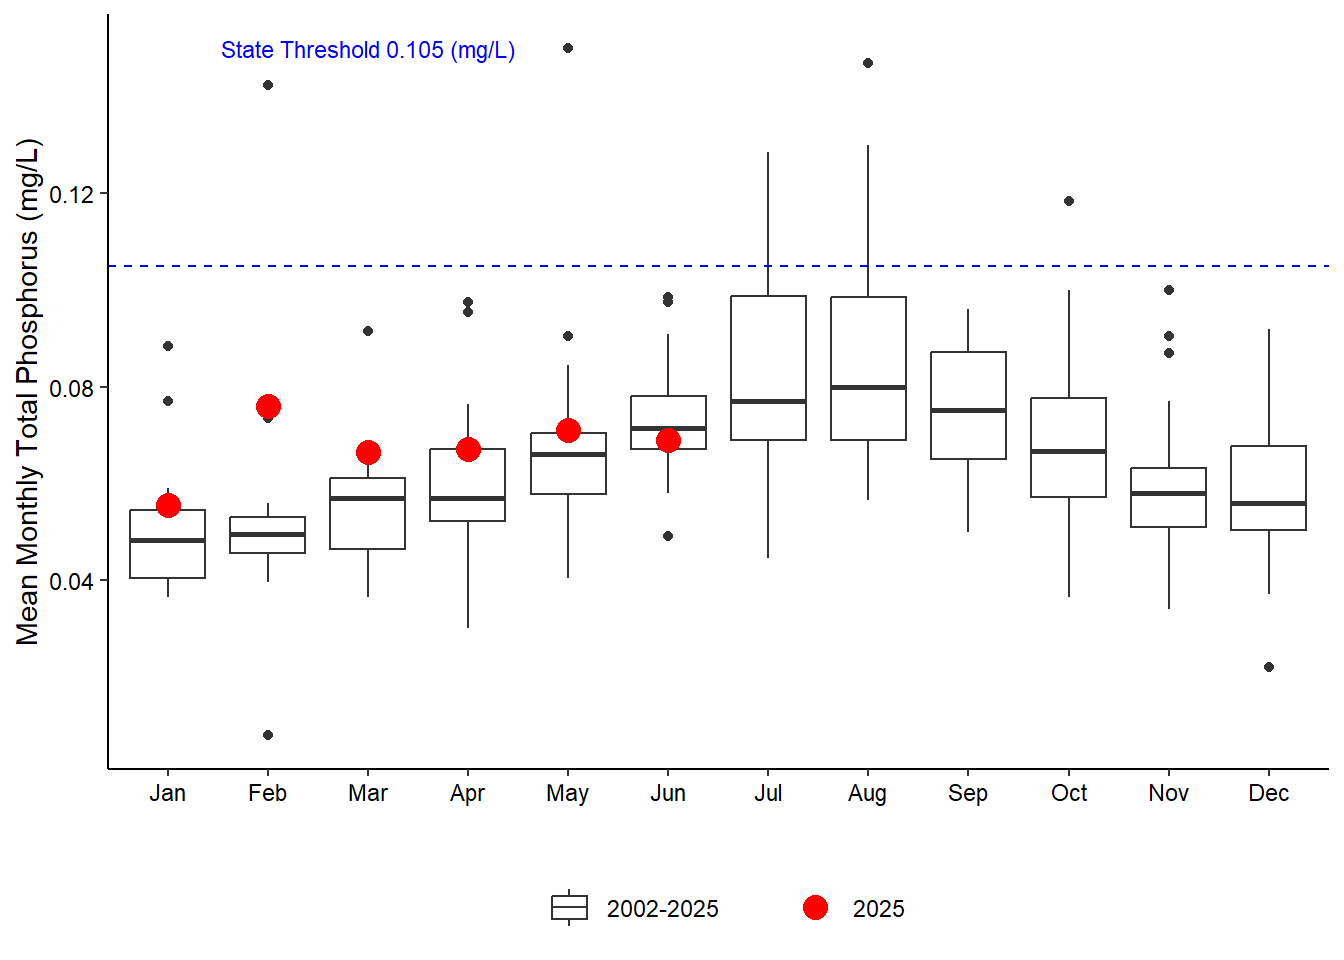
5.2.4 Phosphorus
5.2.4.1 Total Phosphorus
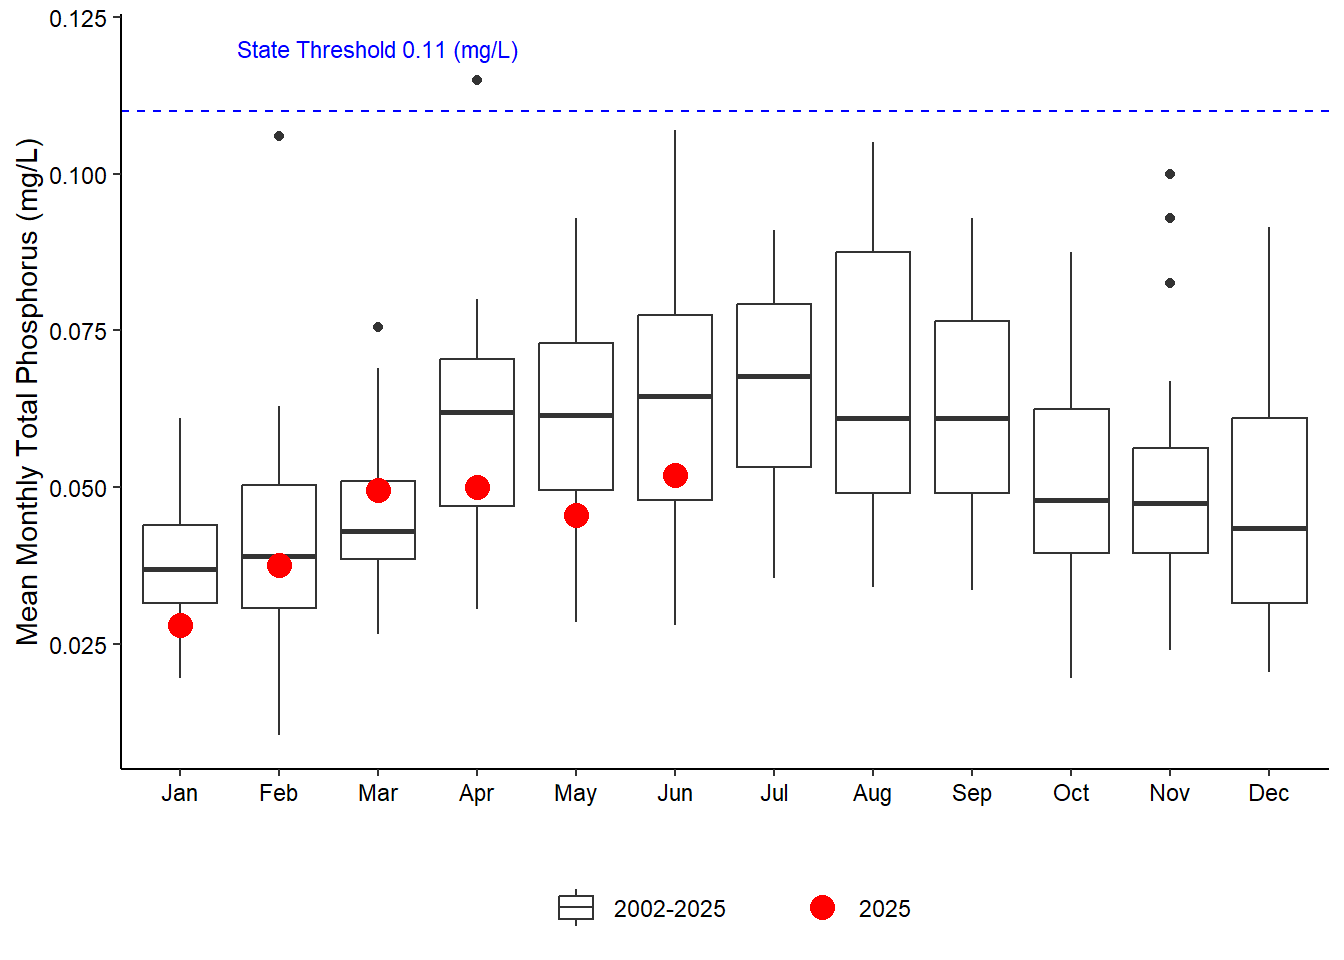
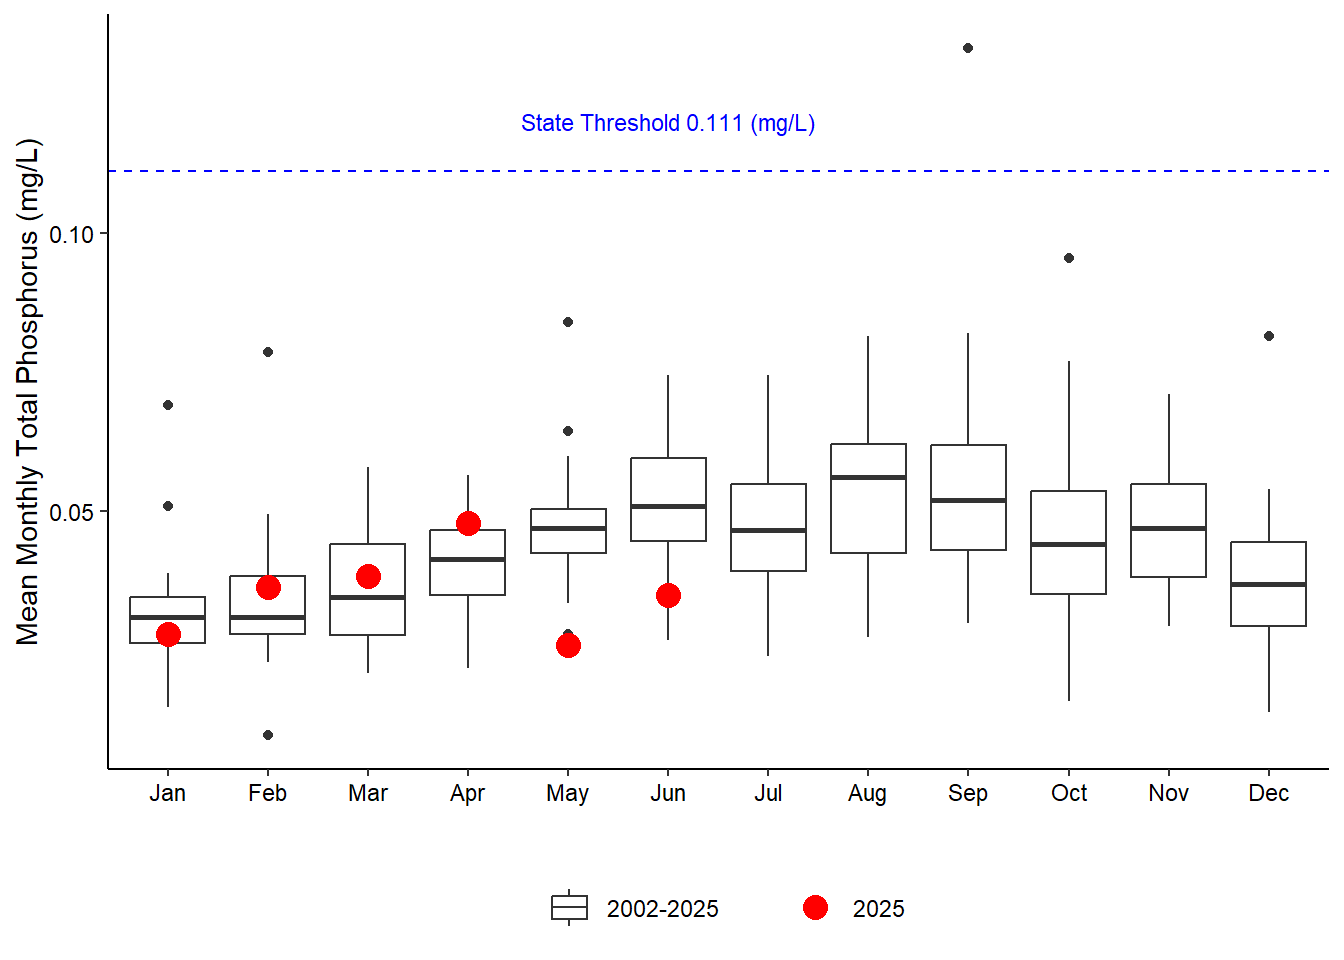
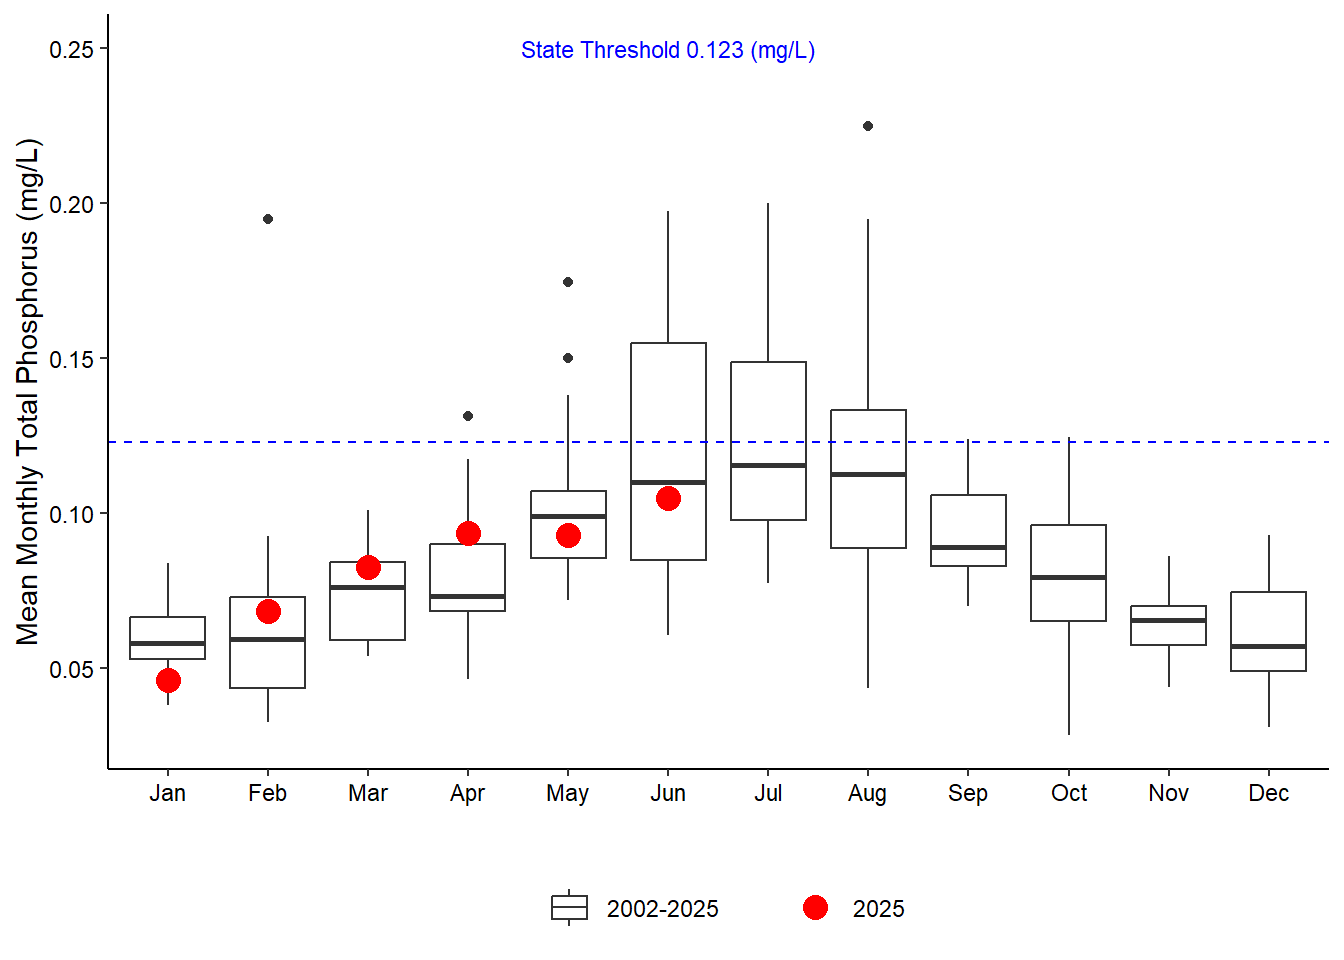
(a) Pine Island
(b) San Sebastian
(c) Fort Matanzas
(d) Pellicer Creek
Figure 5.10: Historical monthly total phosphorus at each SWMP water quality station with current year monthly value overlaid in red. Horizontal dashed blue line indicates the state threshold, as found in F.A.C 62-302.530.
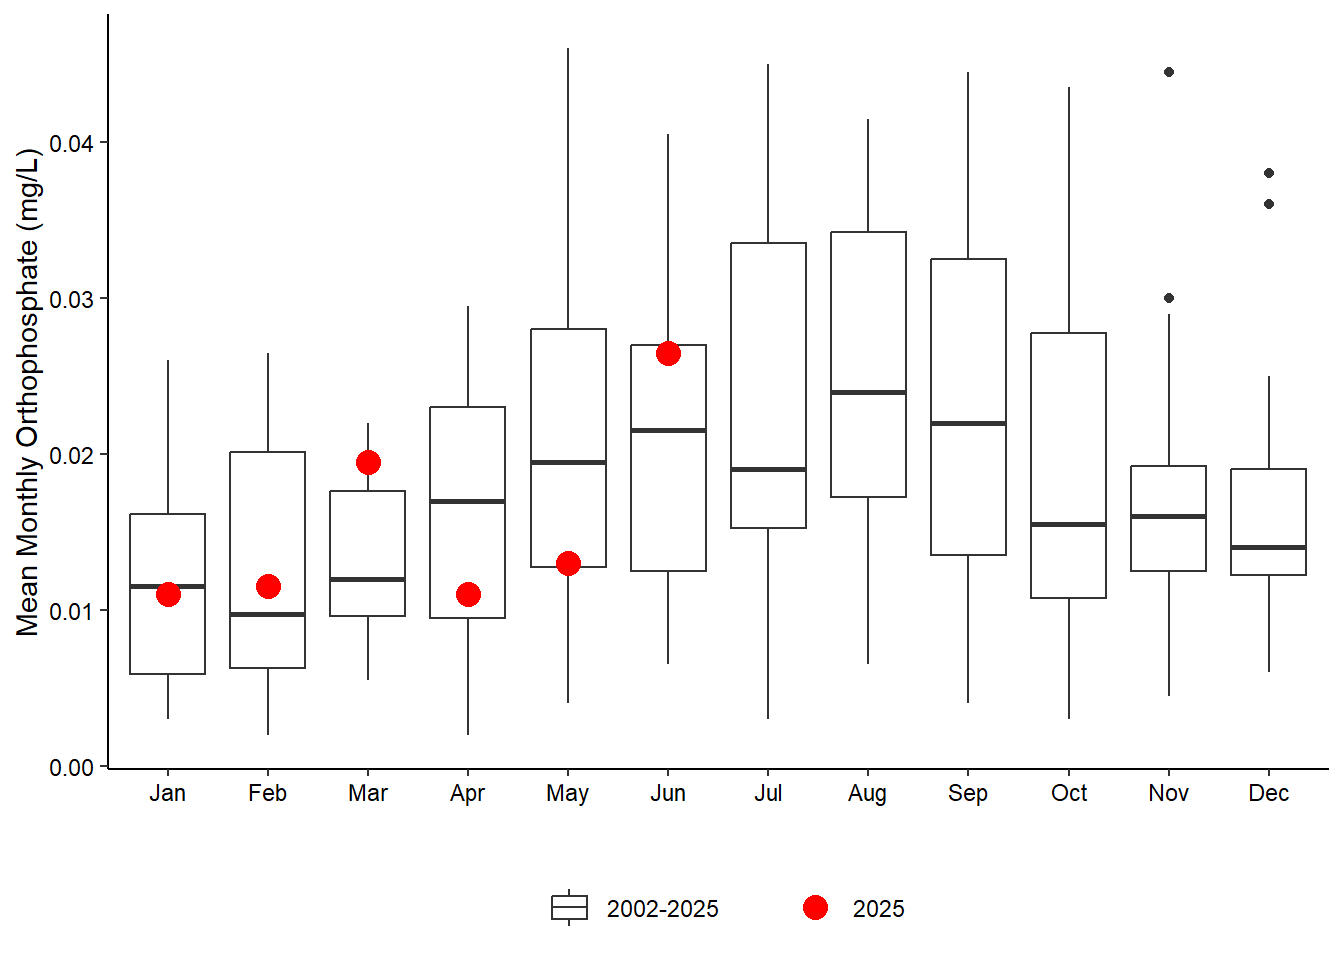
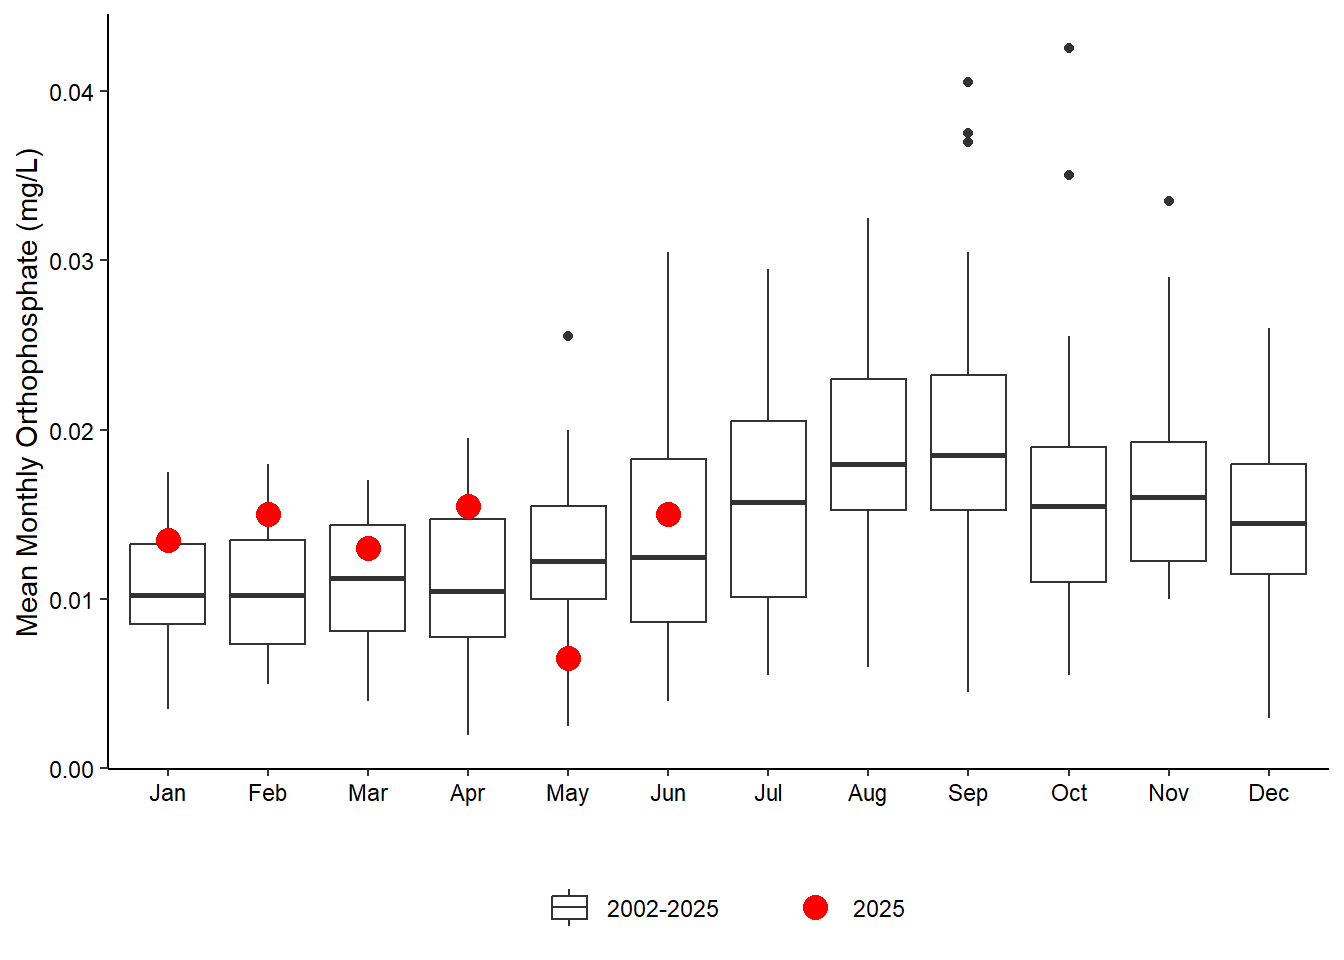
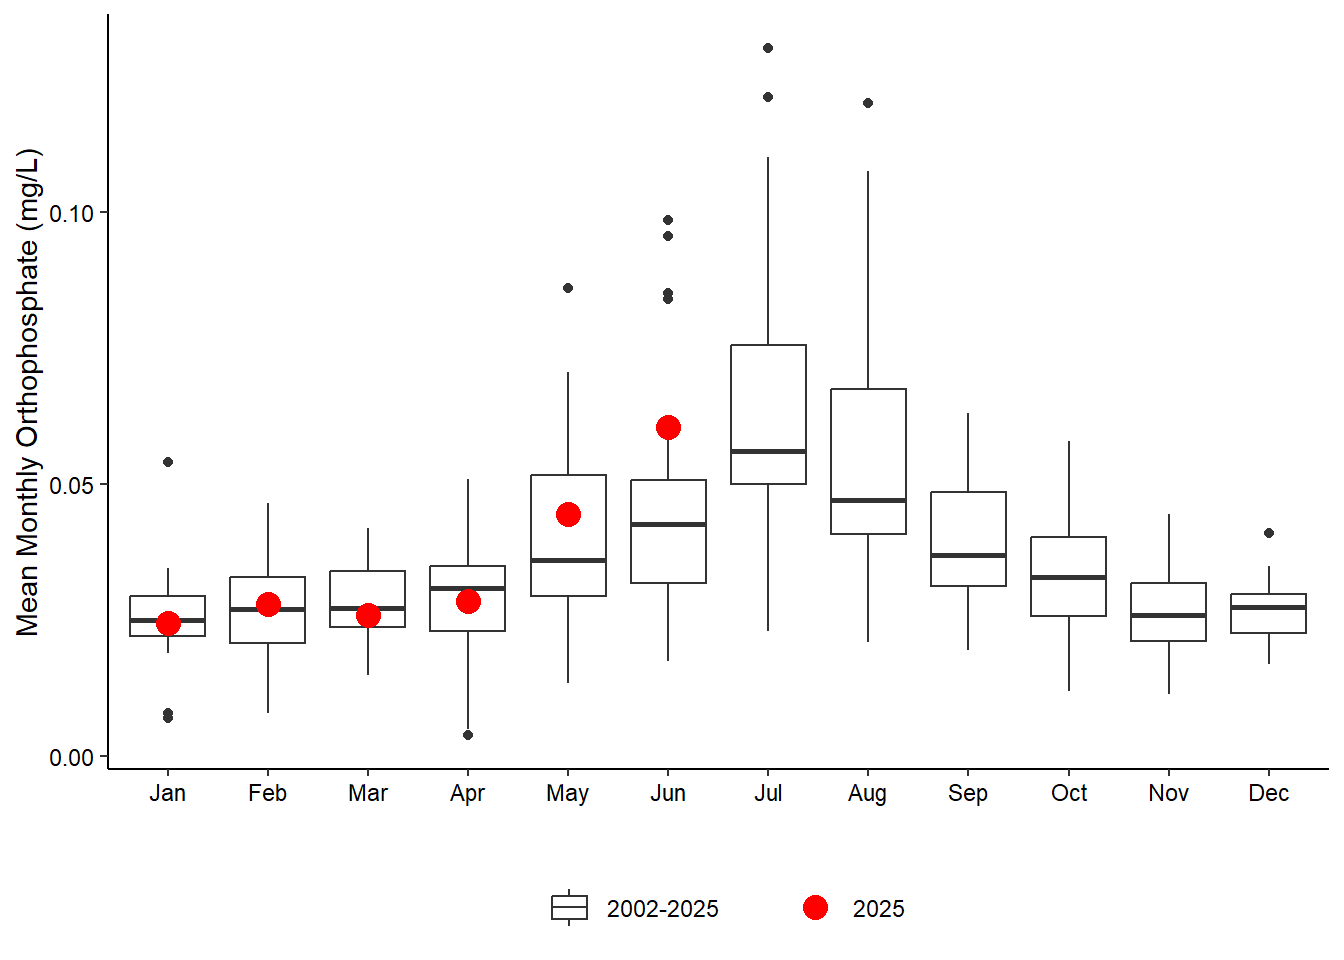
5.2.4.2 Orthophosphate
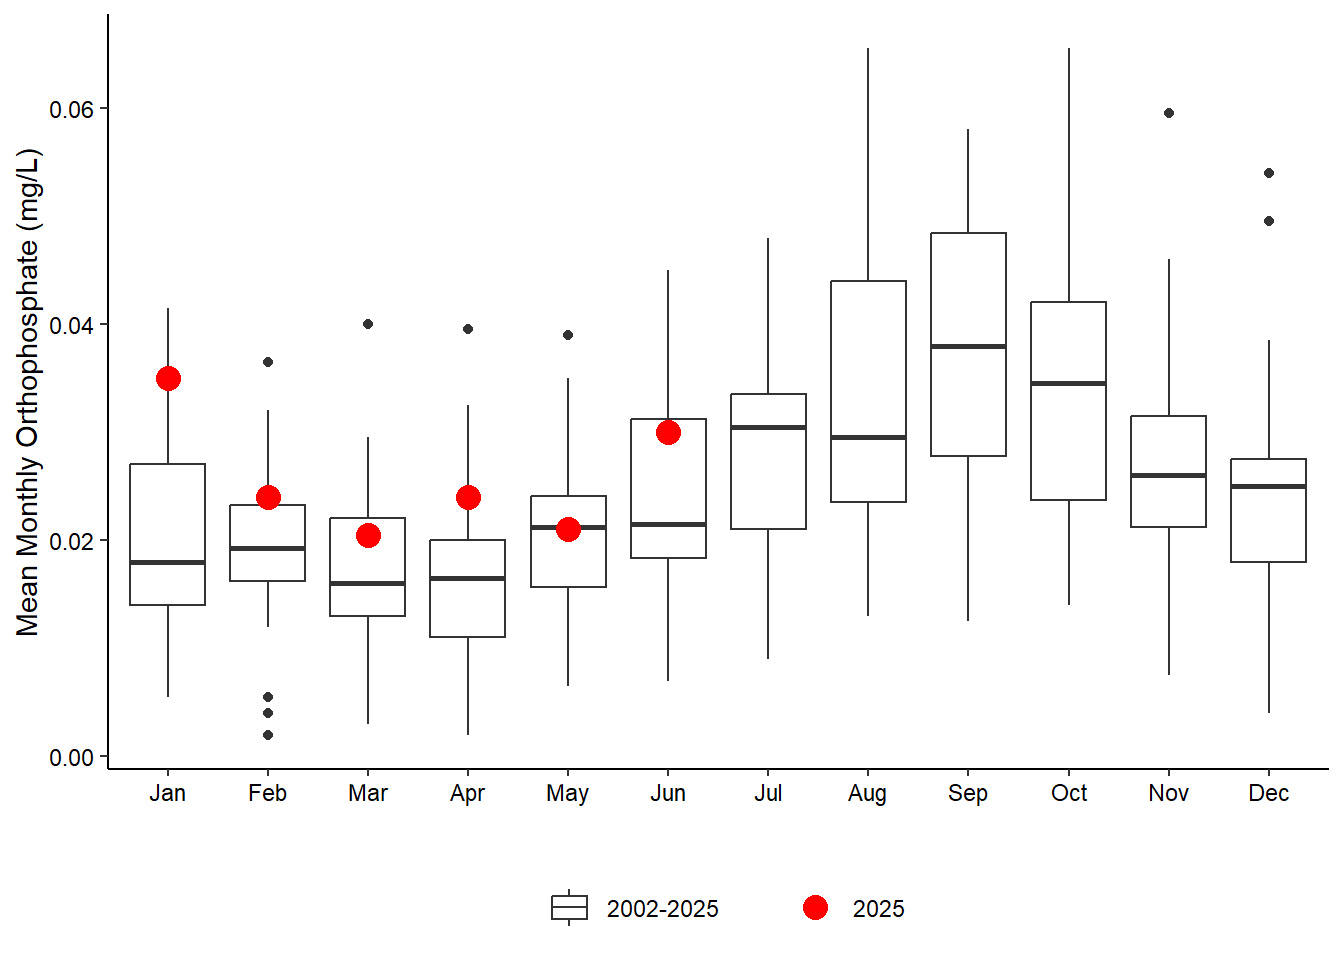
(a) Pine Island
(b) San Sebastian
(c) Fort Matanzas
(d) Pellicer Creek
Figure 5.11: Historical monthly orthophosphate at each SWMP water quality station with current year monthly value overlaid in red.