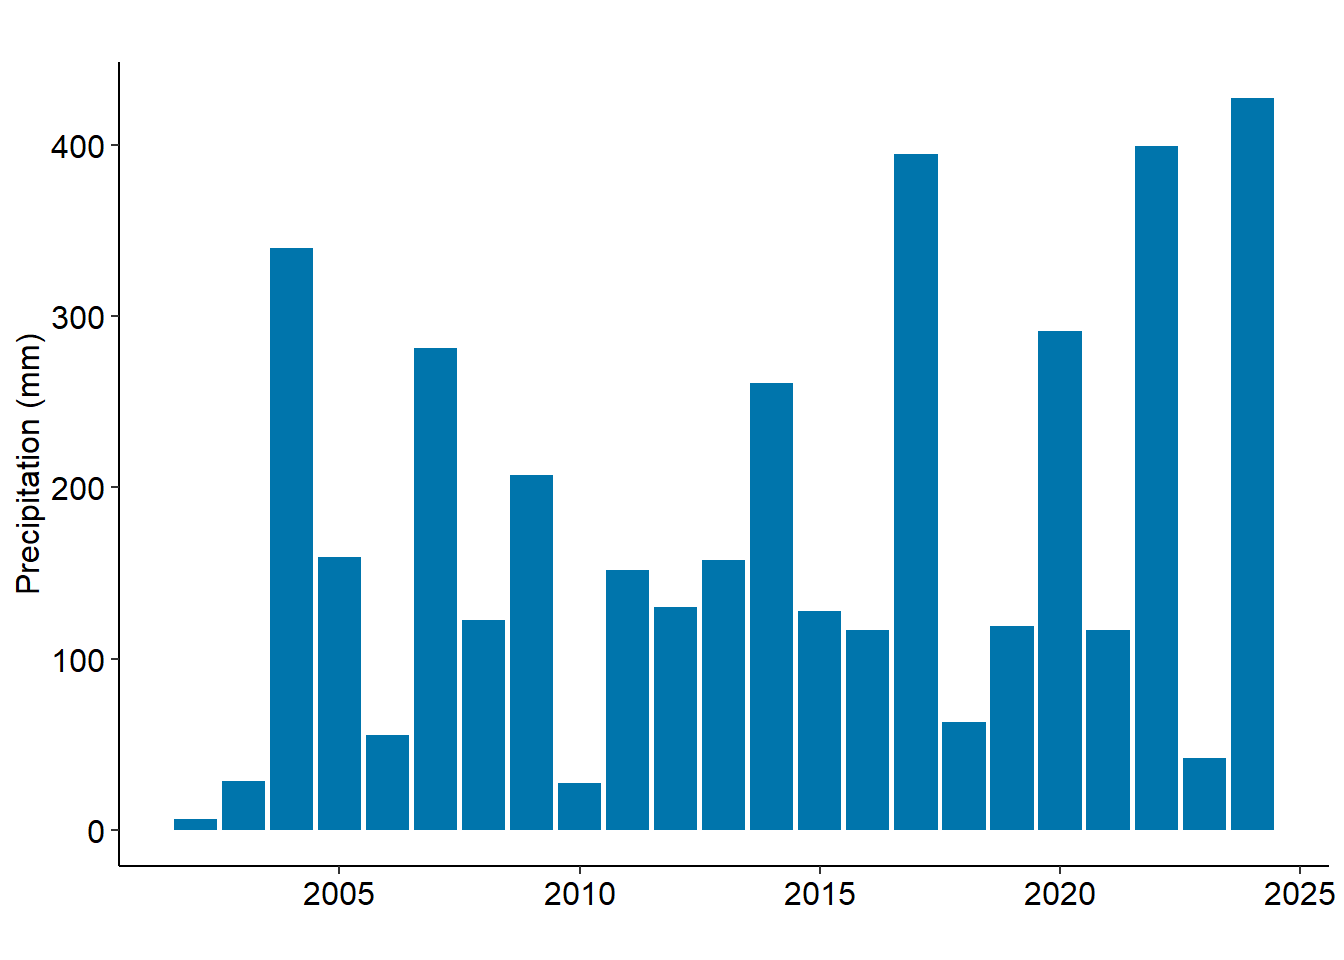
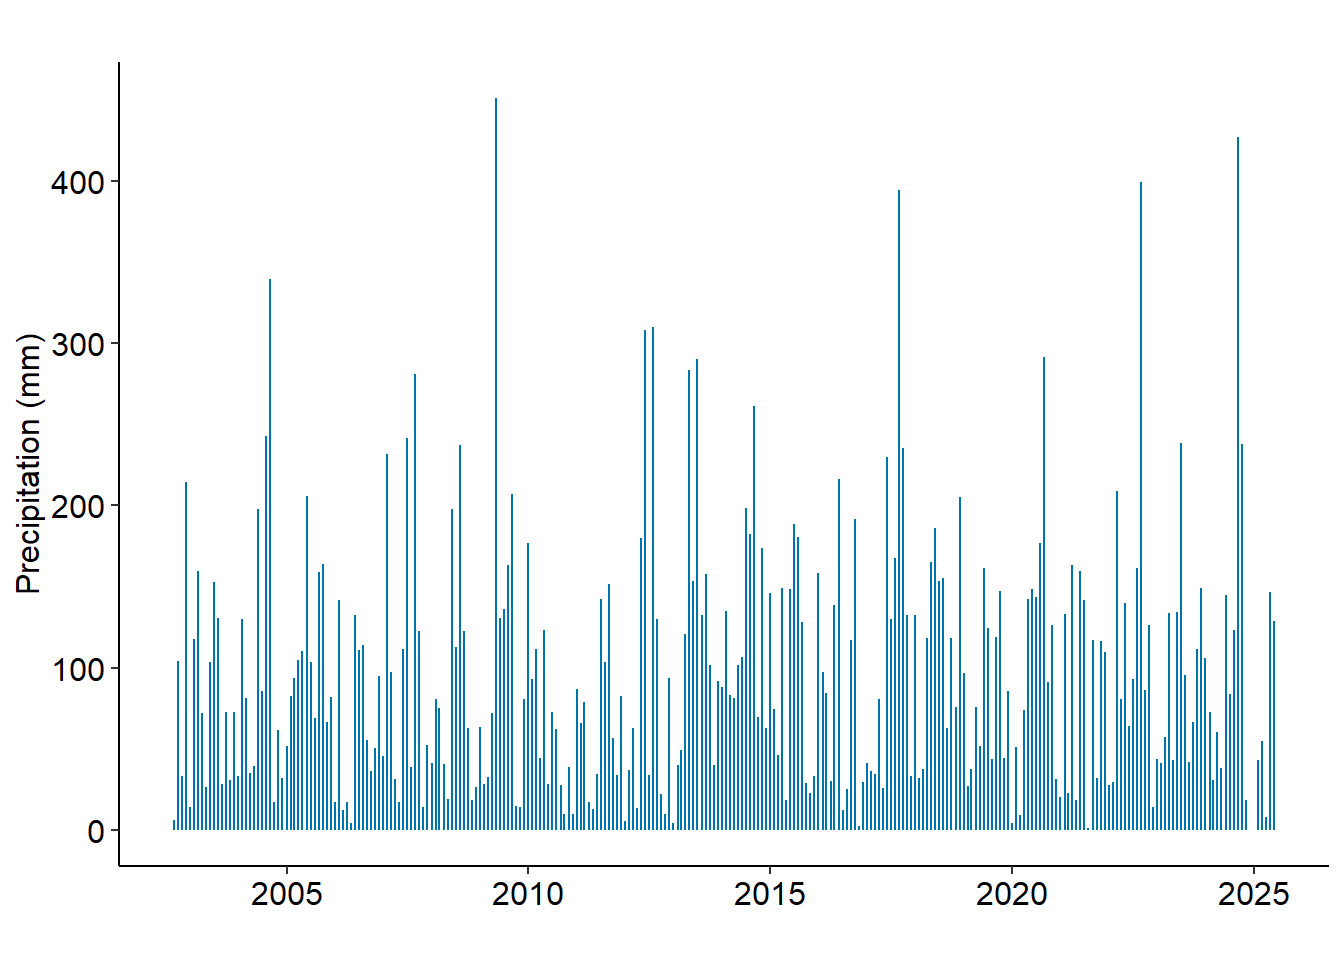
| Month | Year | Total Precipitation (mm) |
|---|---|---|
| May | 2009 | 451.0 |
| Sep | 2024 | 427.1 |
| Sep | 2022 | 399.3 |
| Sep | 2017 | 394.4 |
| Sep | 2004 | 339.9 |
4 Environmental
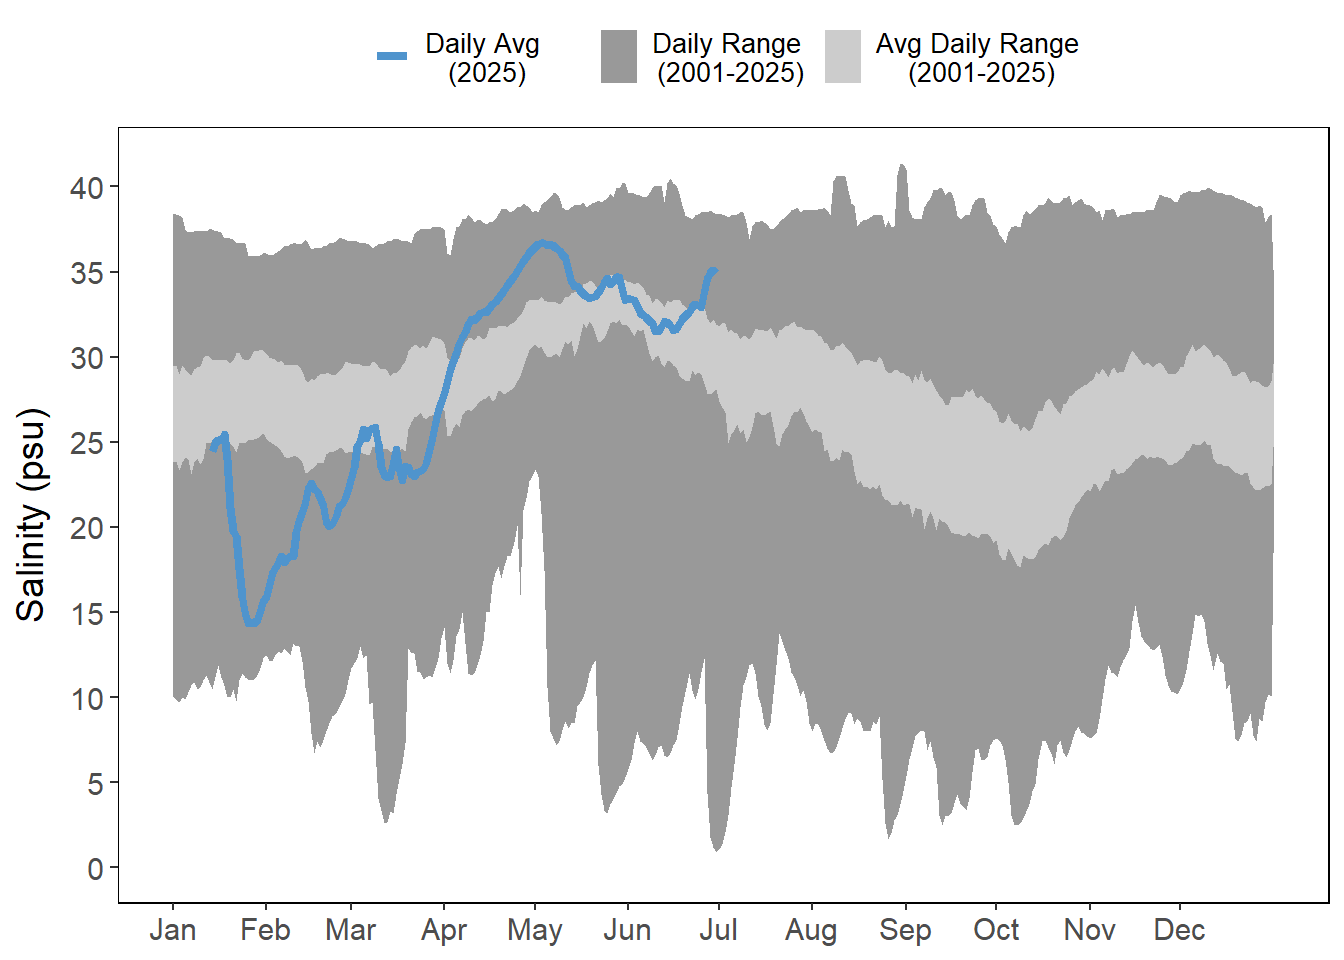
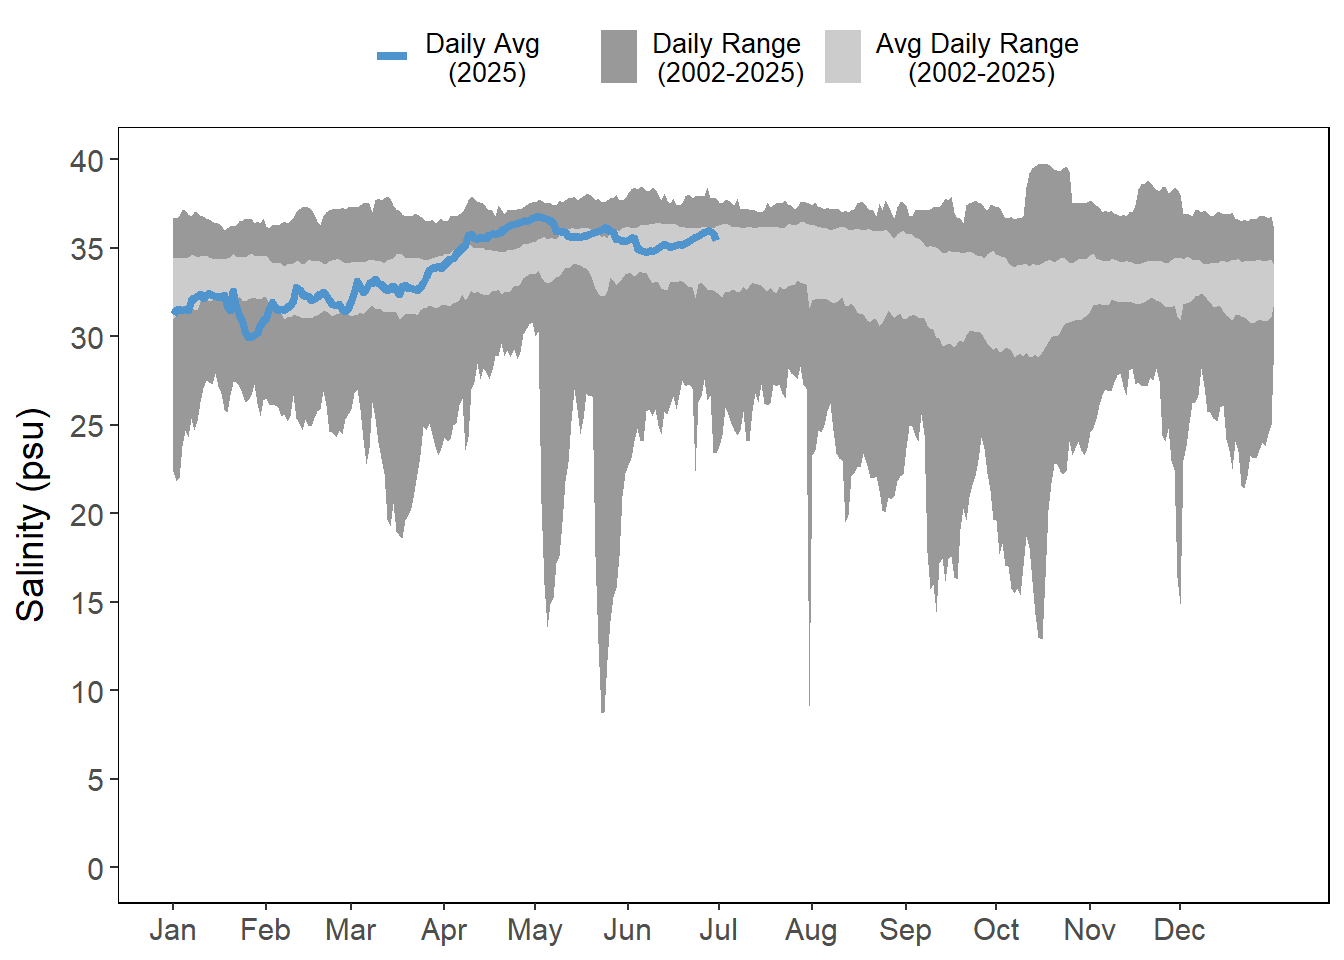
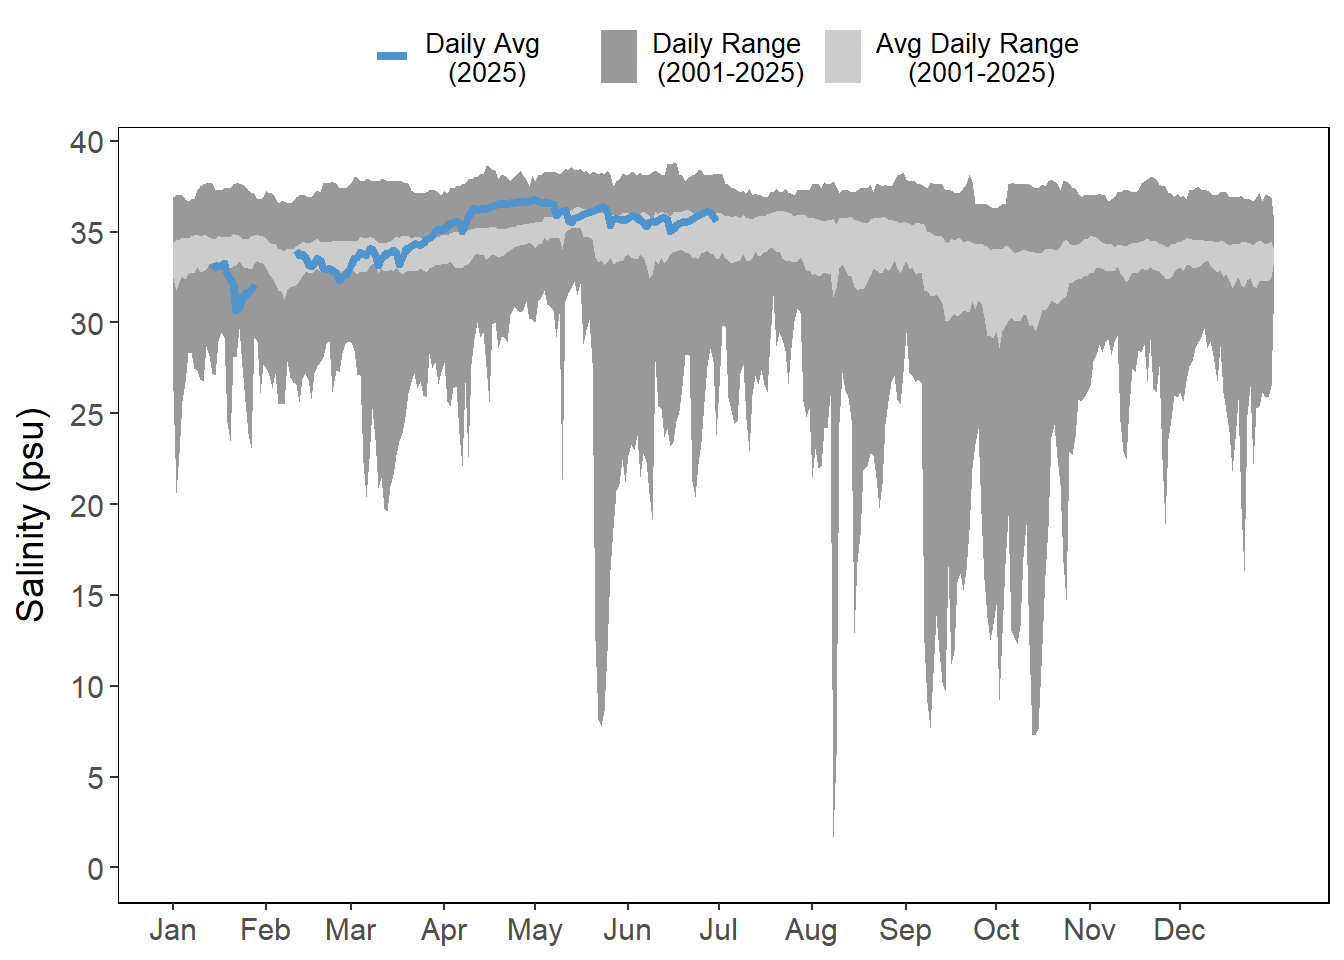
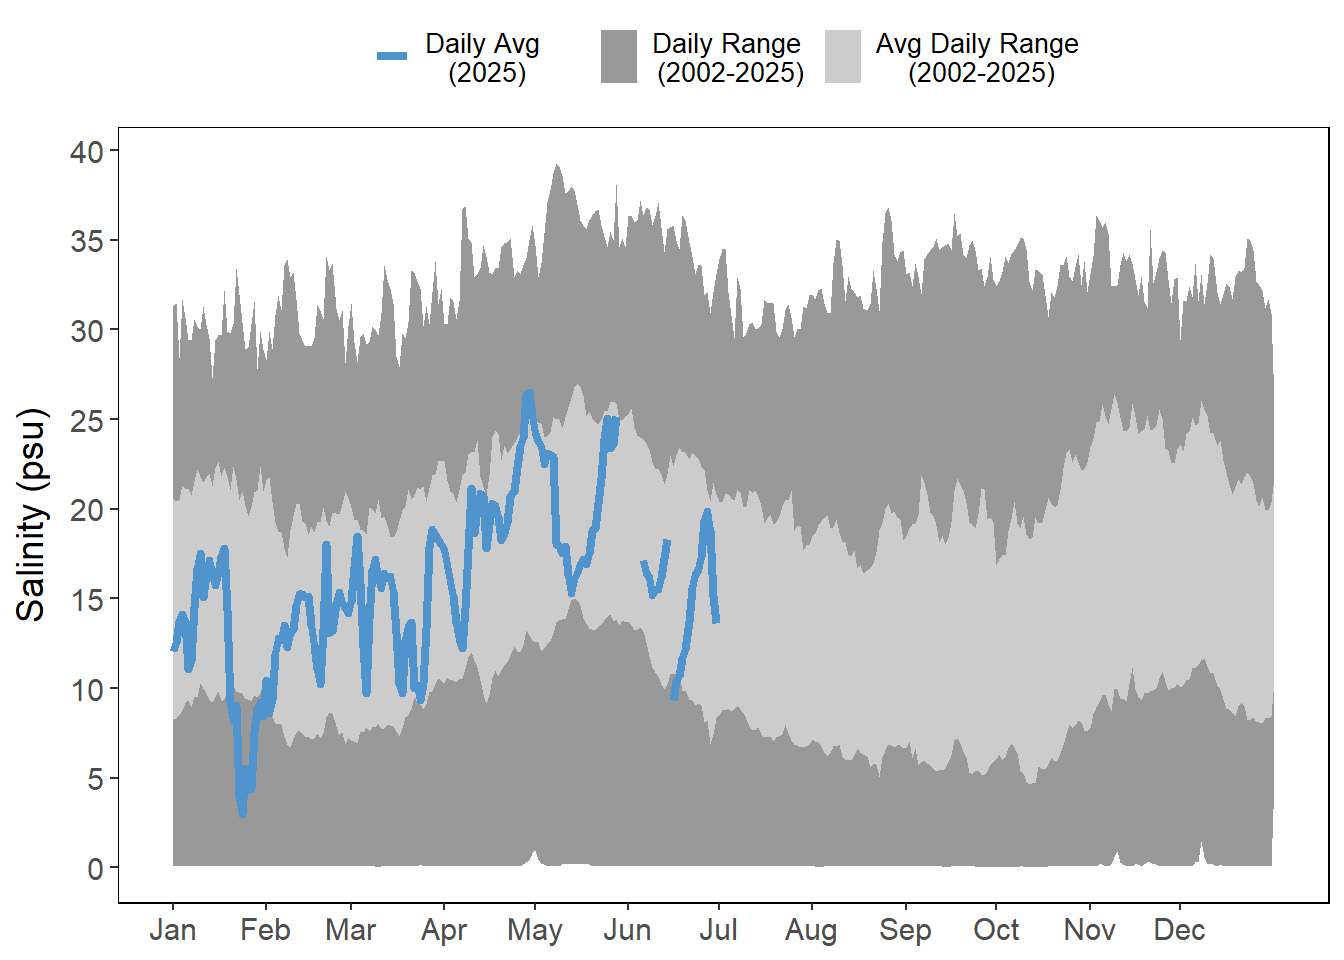
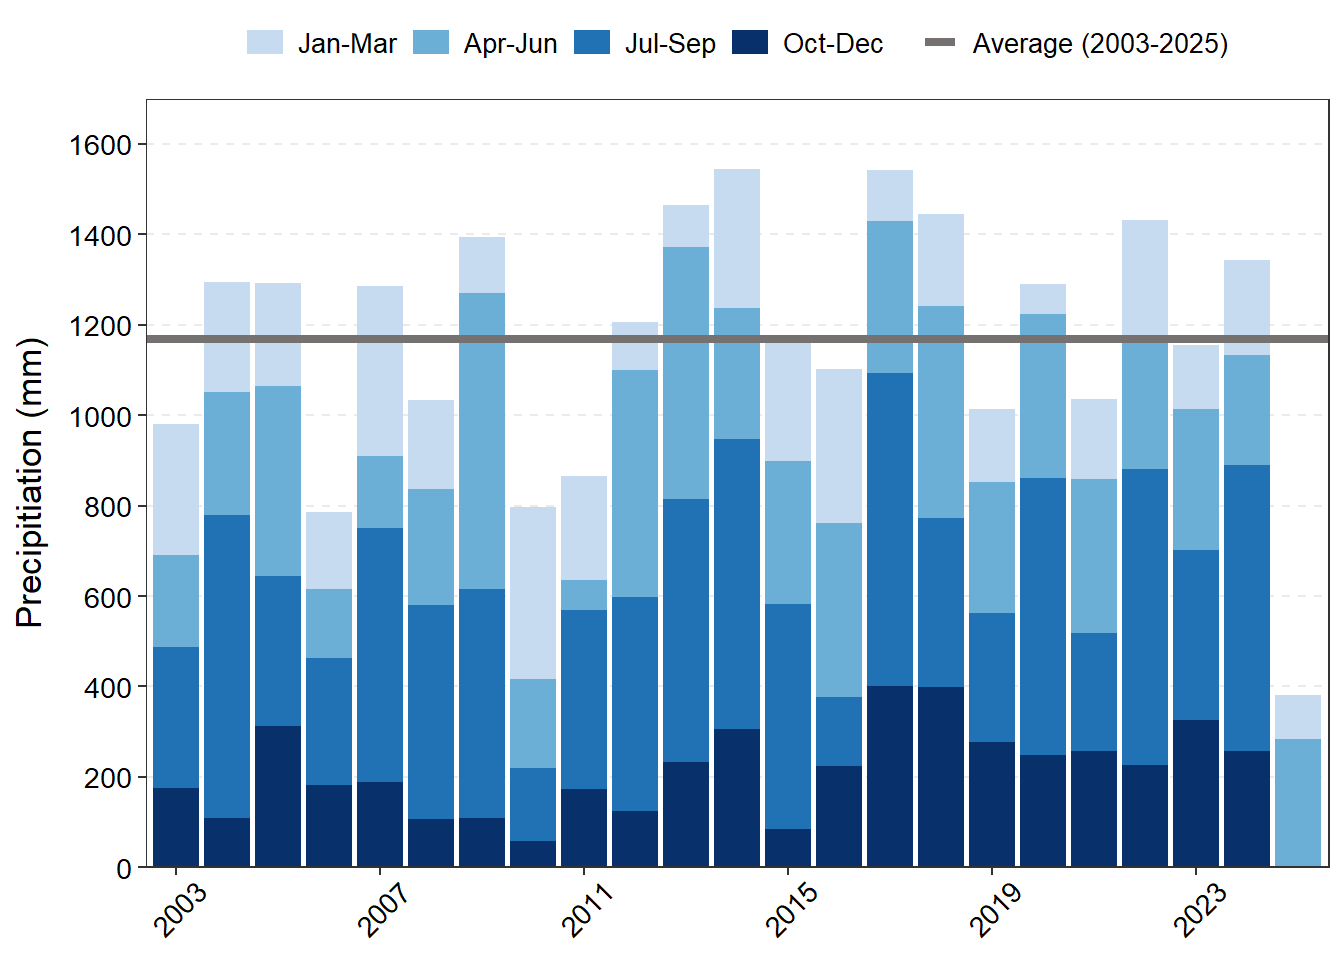
The following includes variables that establish the estuarine setting: rainfall, light intensity, water temperature, and salinity. These variables are driven primarily by climatic patterns and largely influence water quality, biological processes, and habitat condition.
4.1 Data
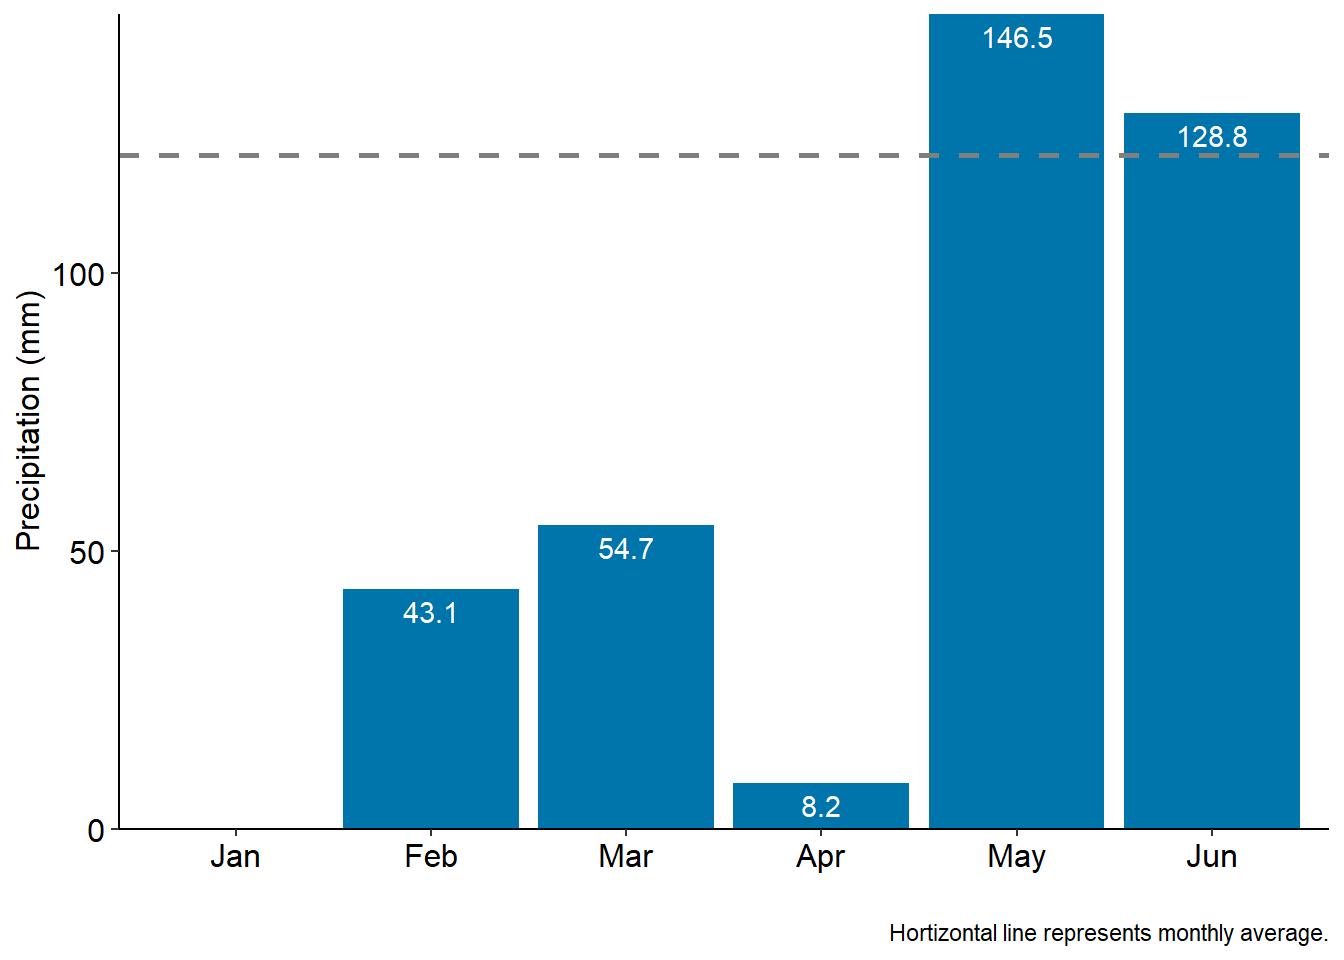
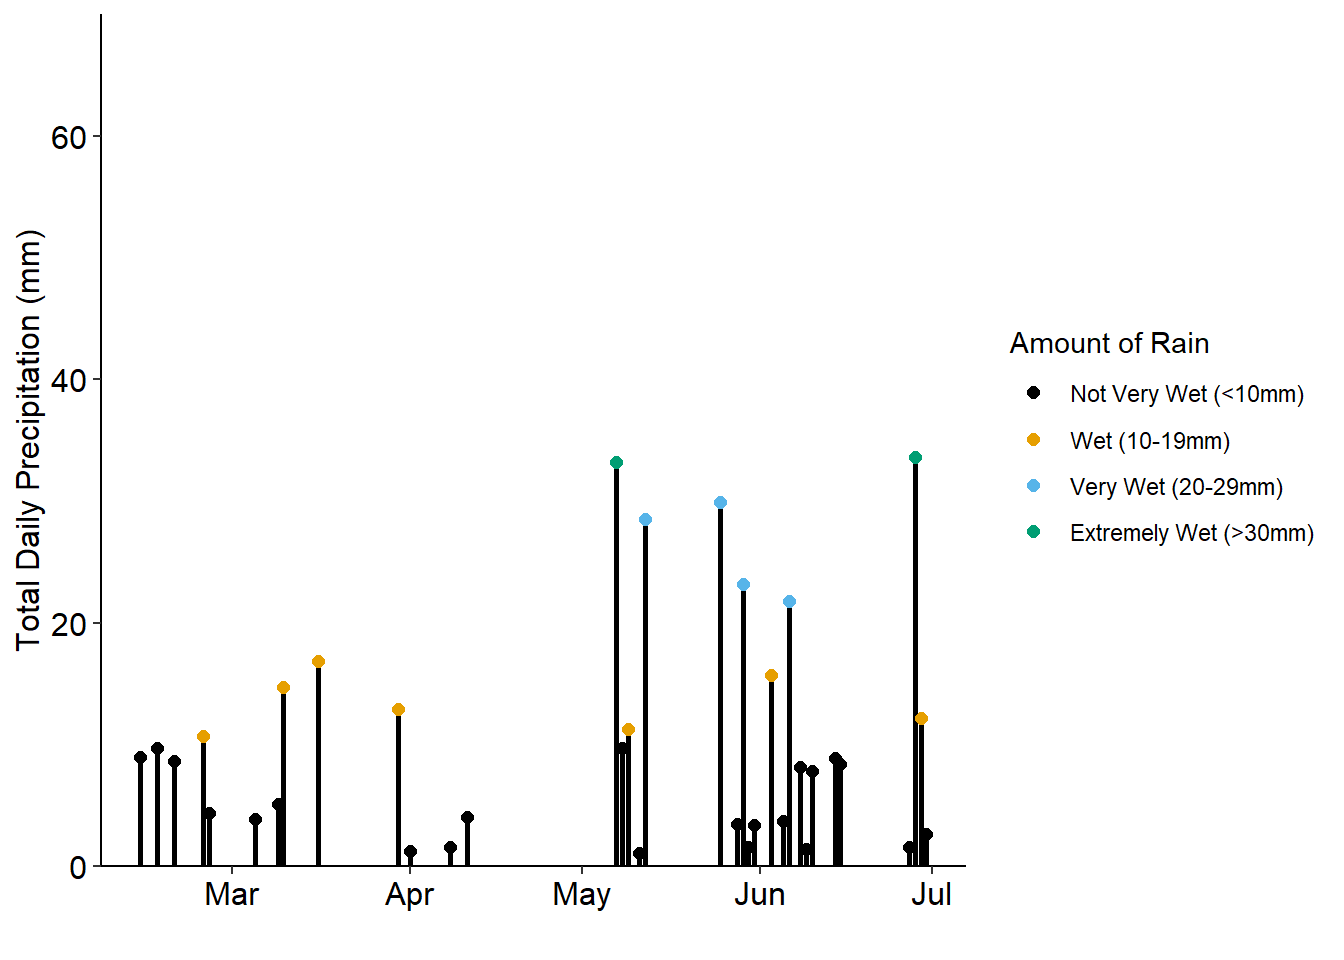
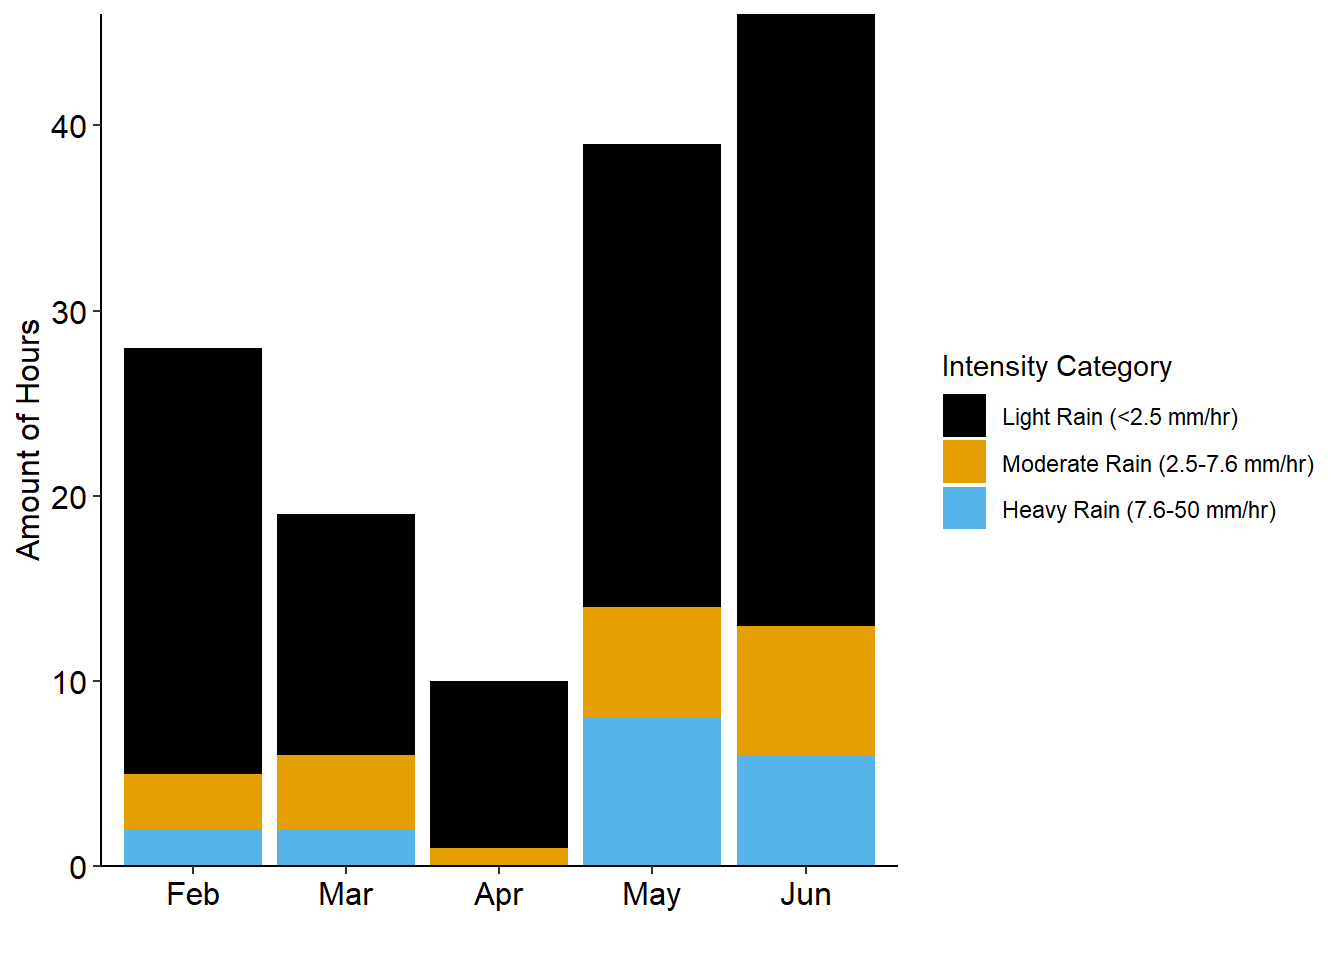
4.1.1 Rainfall
4.1.2 Light Intensity
The plot below is interactive. Clicking on elements in the legend (months) will select or deselect months of interest. Additionally, the axis can be adjusted by selecting portions of the plot to isolate.
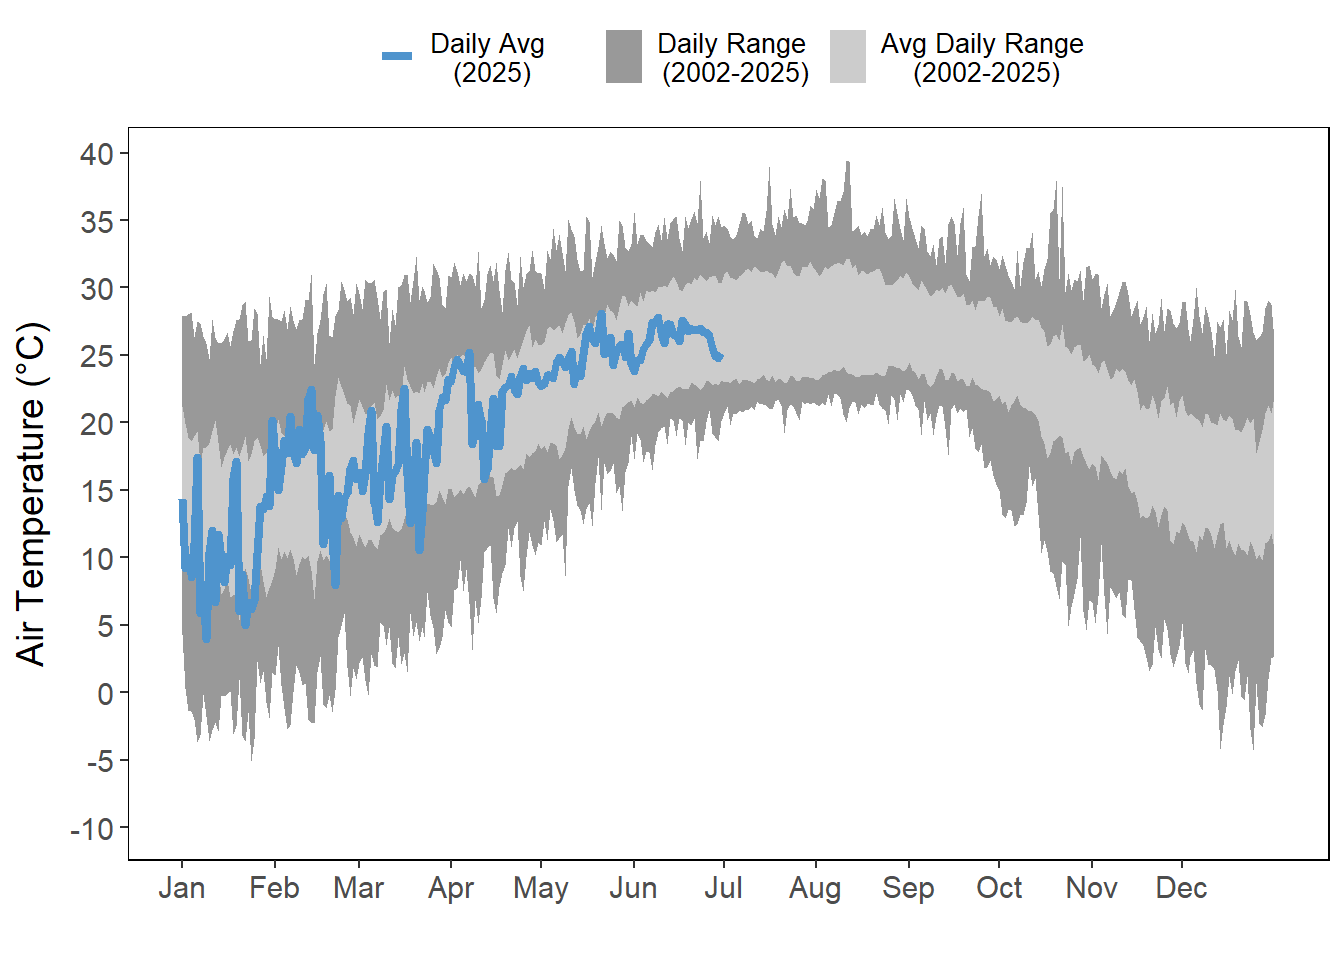
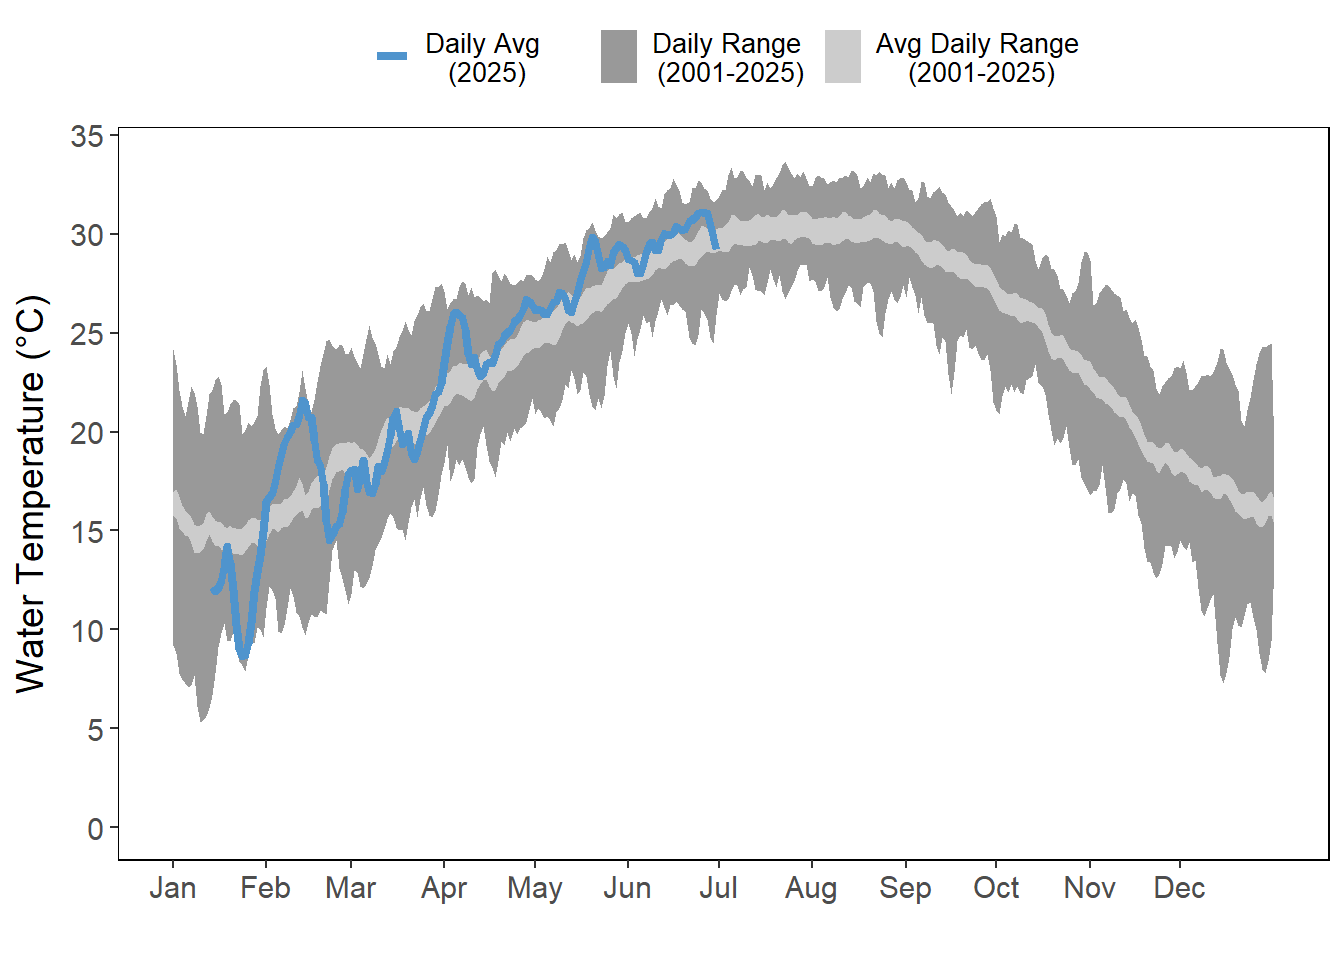
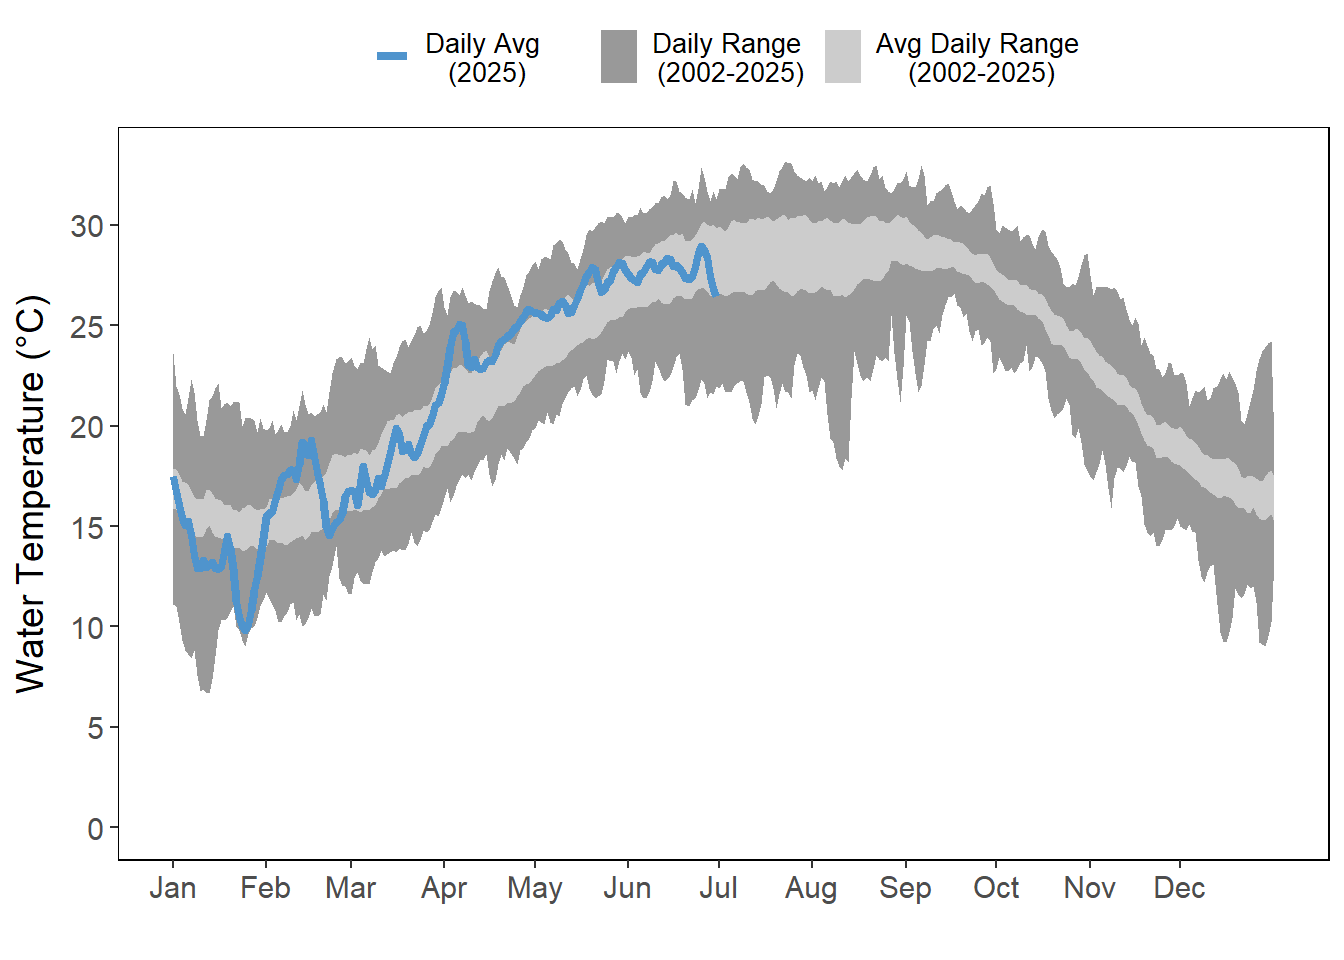
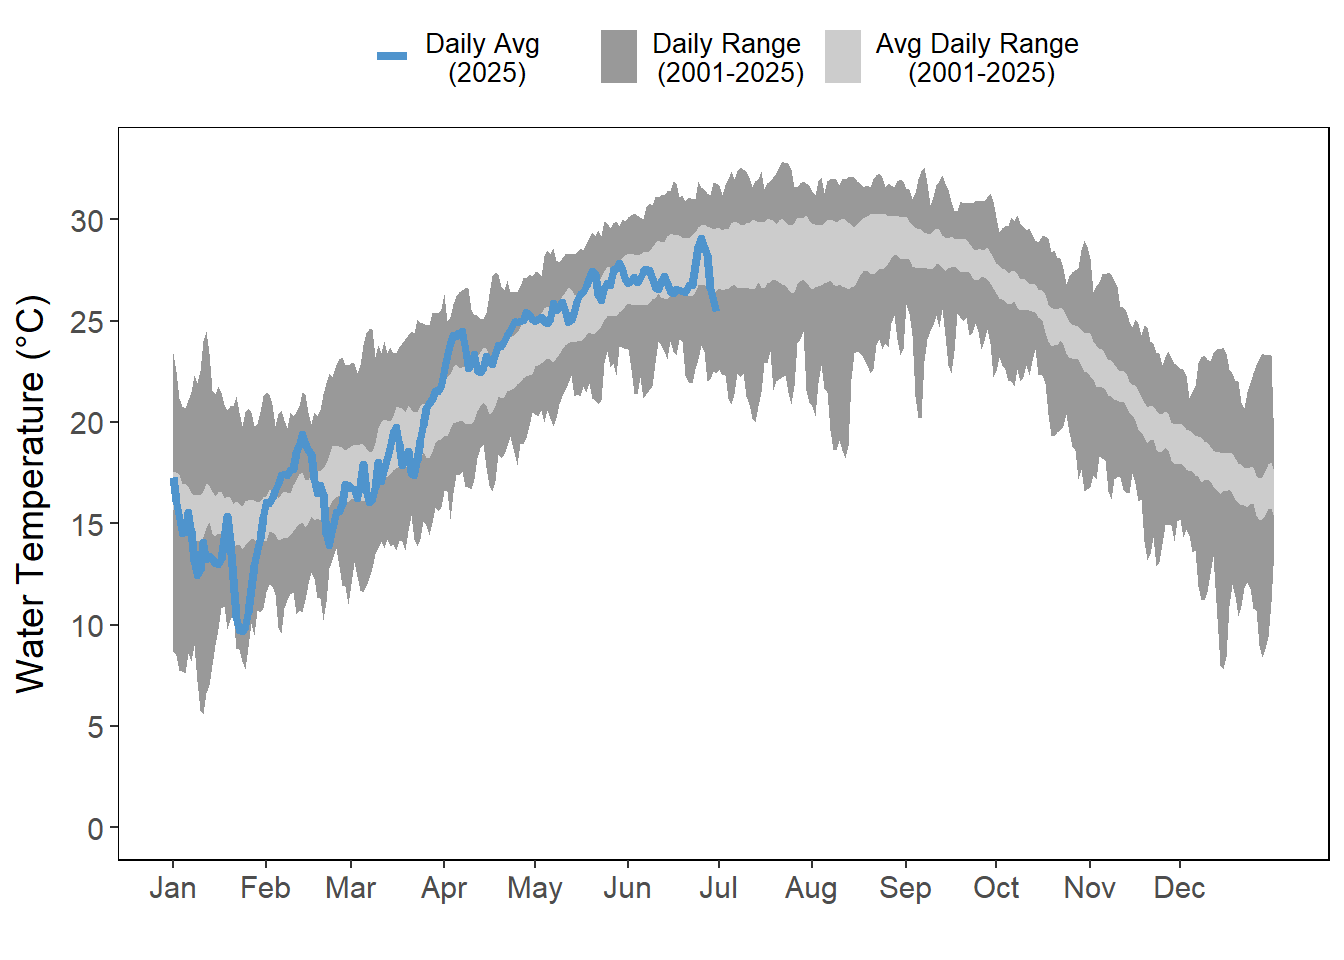
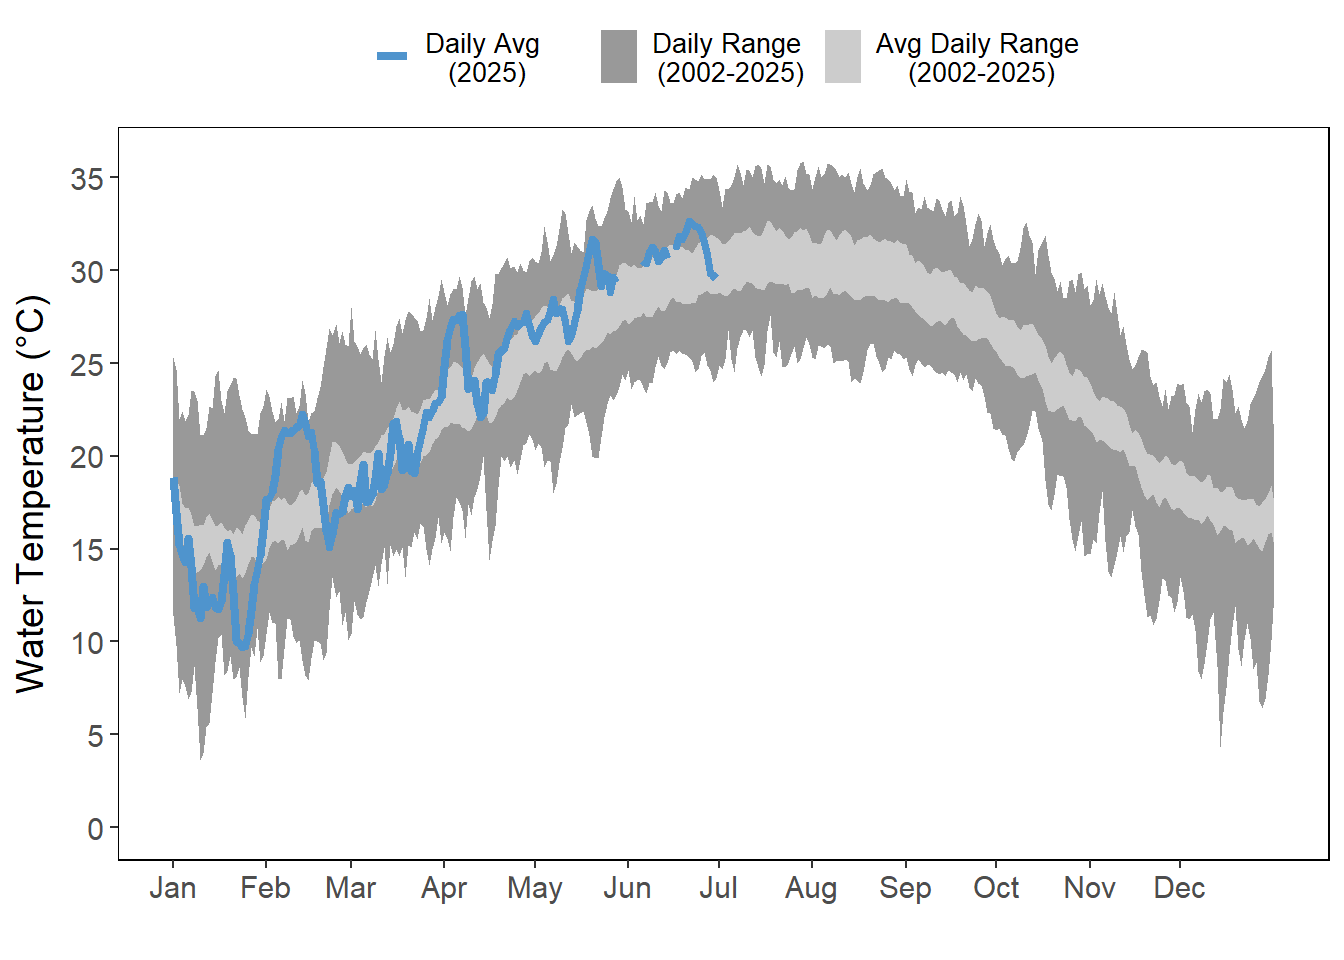
4.1.3 Temperature
Air and water temperatures are presented as daily averages (blue line) with historic ranges (daily range and average daily range) provided in shades of gray.
4.1.4 Salinity