4 Environmental
The following includes variables that establish the estuarine setting: rainfall, light intensity, water temperature, and salinity. These variables are driven primarily by climatic patterns and largely influence water quality condition.
4.1 Summary
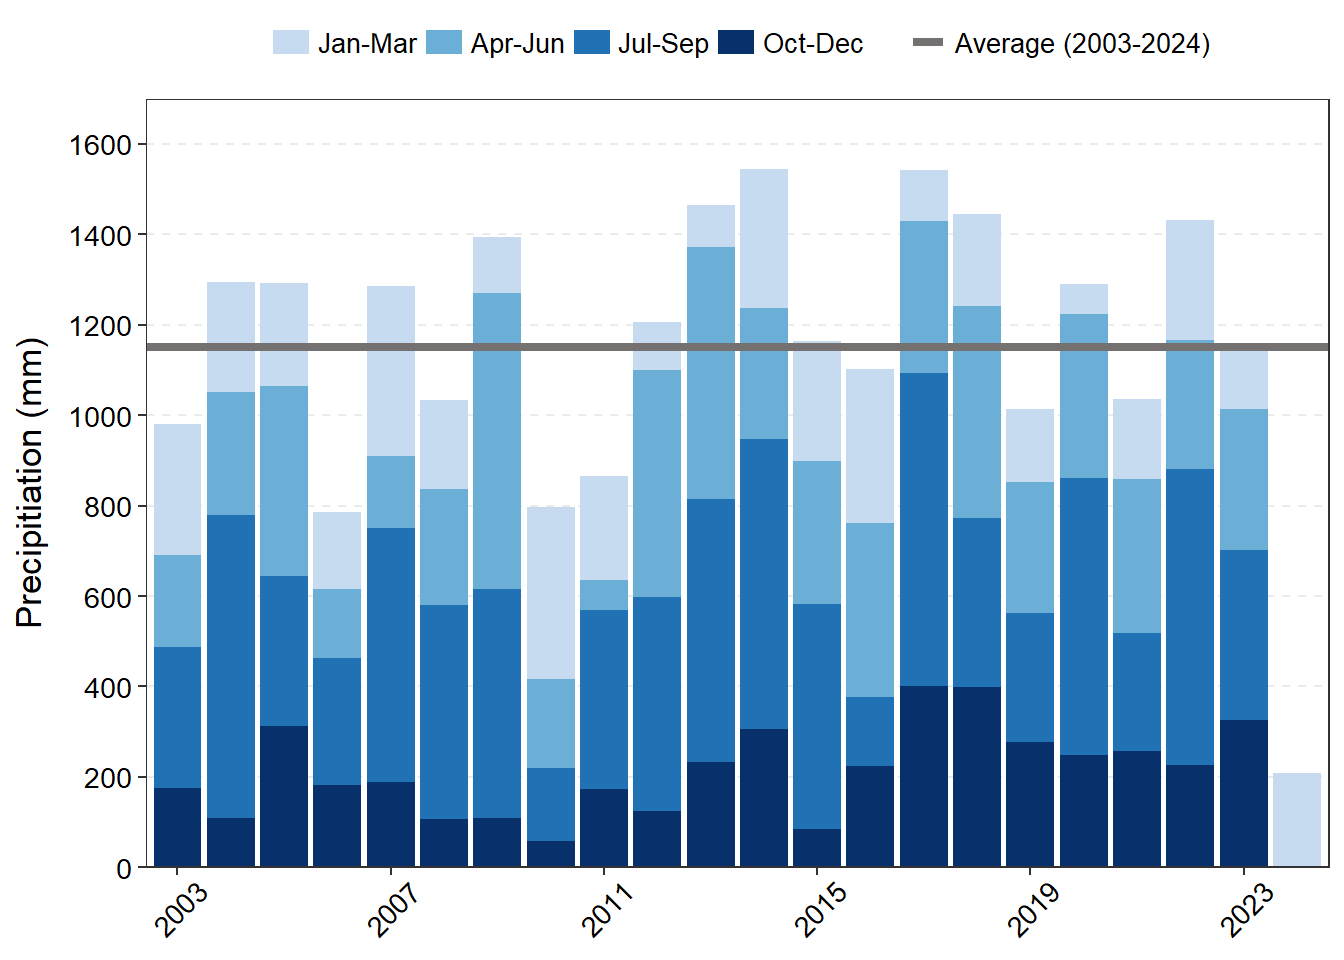
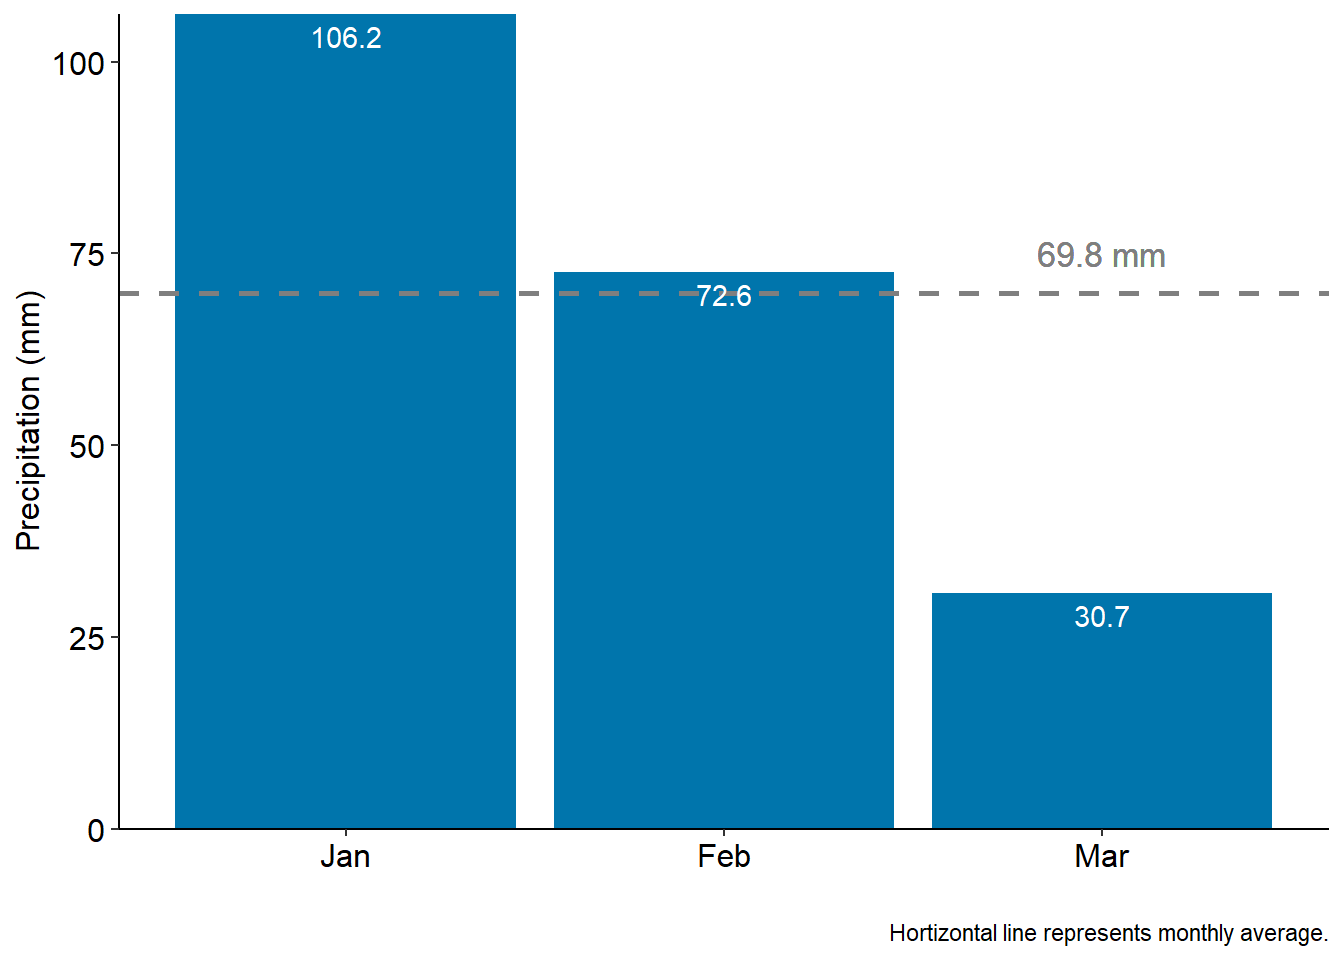
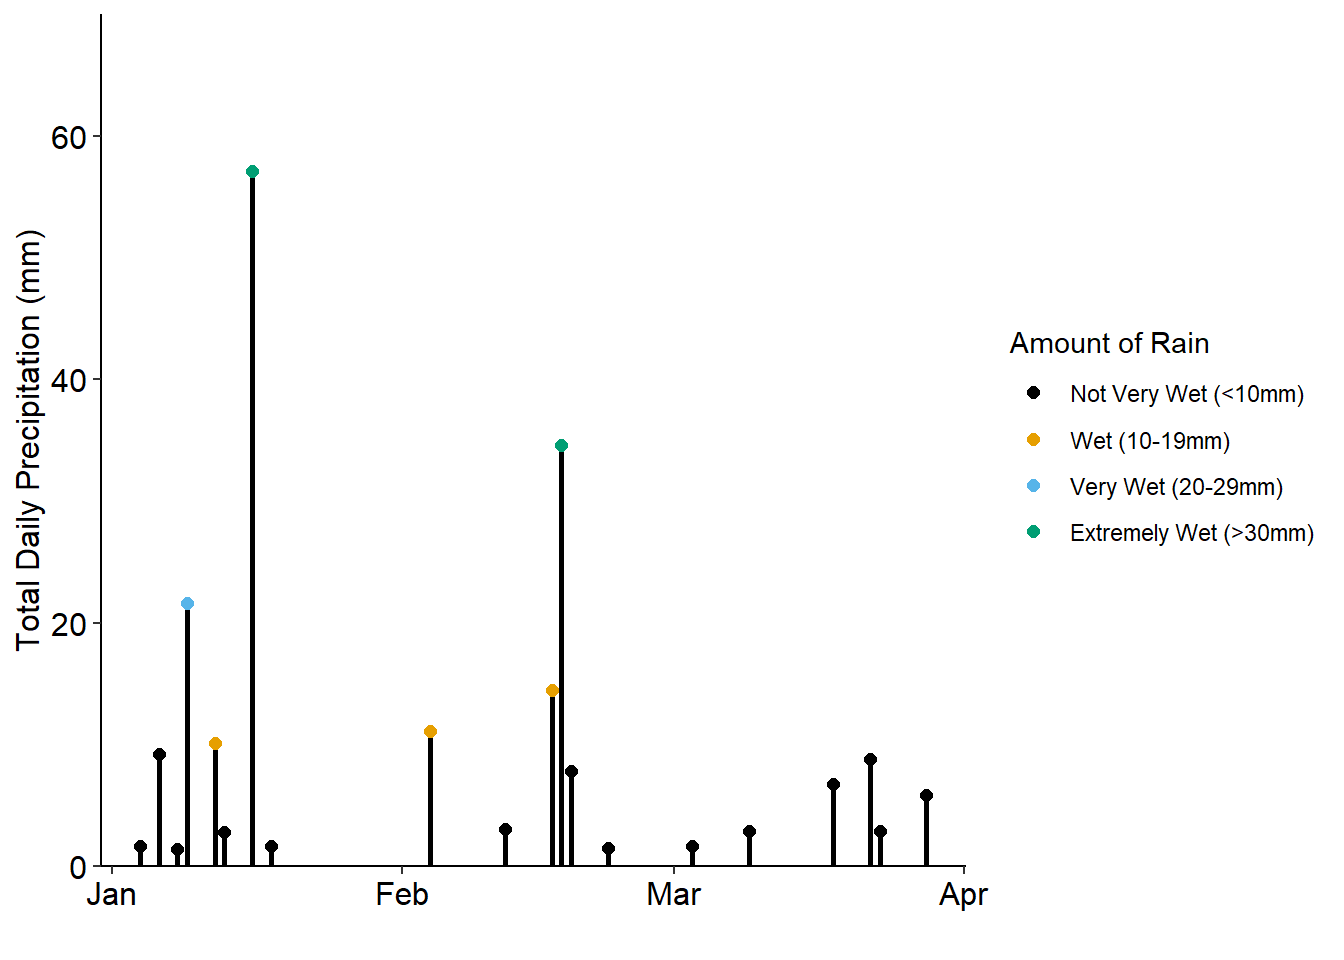
Rainfall totals for the first quarter of 2024 exceeded the quarterly totals from the previous five years with the exception of 2022 (Figure 4.1). January had the greatest amount of rainfall at 106.2 mm (Figure 4.1 (b)), and the greatest number of rain days exceeding 10 mm/day (Figure 4.1 (c)).
Winter storm Finn (unofficially named) brought rainfall and strong winds in January to Northeast Florida causing some local schools to release students early and cancel after school activities (Figure 4.1 (a); Figure 4.1 (b)). These events are discussed in further detail in the next chapter.
In 2024, the average daily amount of light intensity for each month is shown in Figure 4.2. Light intensity increased each month with the lowest peak daily amount of light in January and the highest in March. The greatest light intensity in March occurred mid-day and exceeded January's intensity by over 10,000 mMol/m^2.
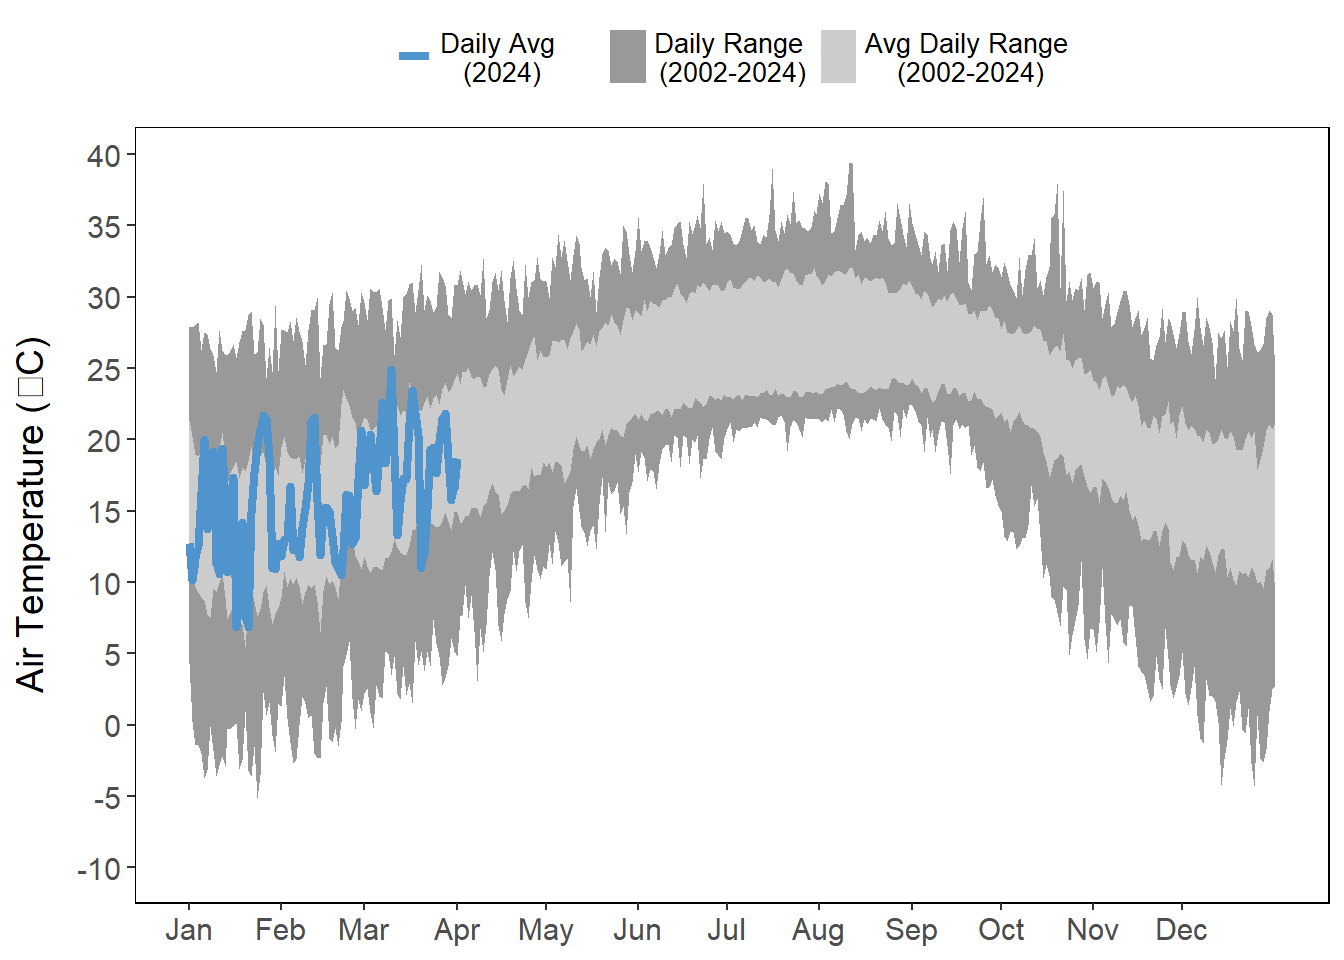
Daily average air temperatures were variable during the first part of the year but fell within the historical range for the GTMNERR station through March (Figure 4.3). January and March experienced a few temperature drops outside of the average range (Figure 4.3). More discussions on temperature anomalies can be found in the next chapter.
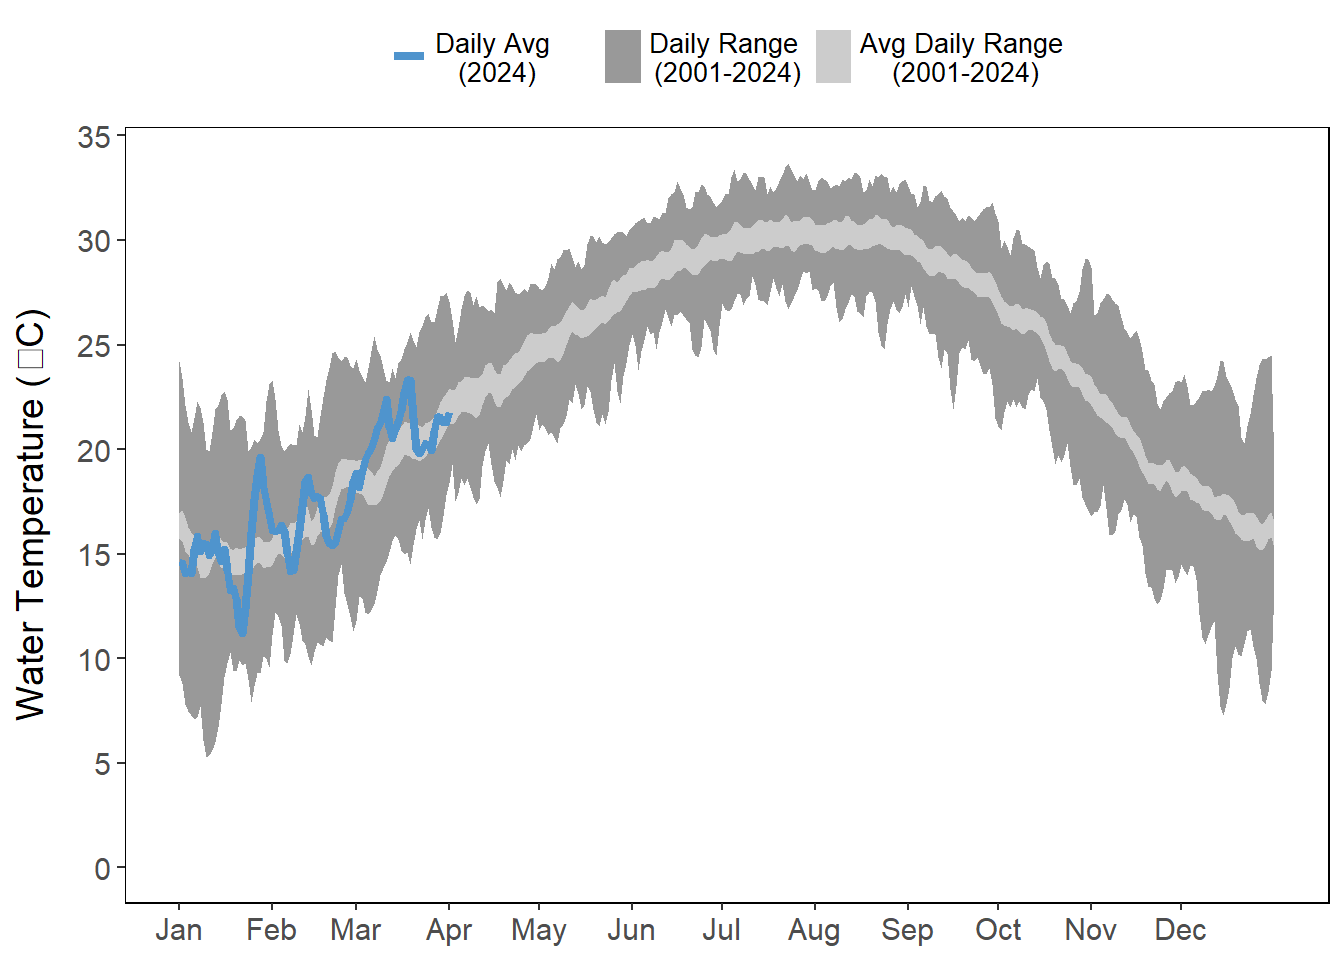
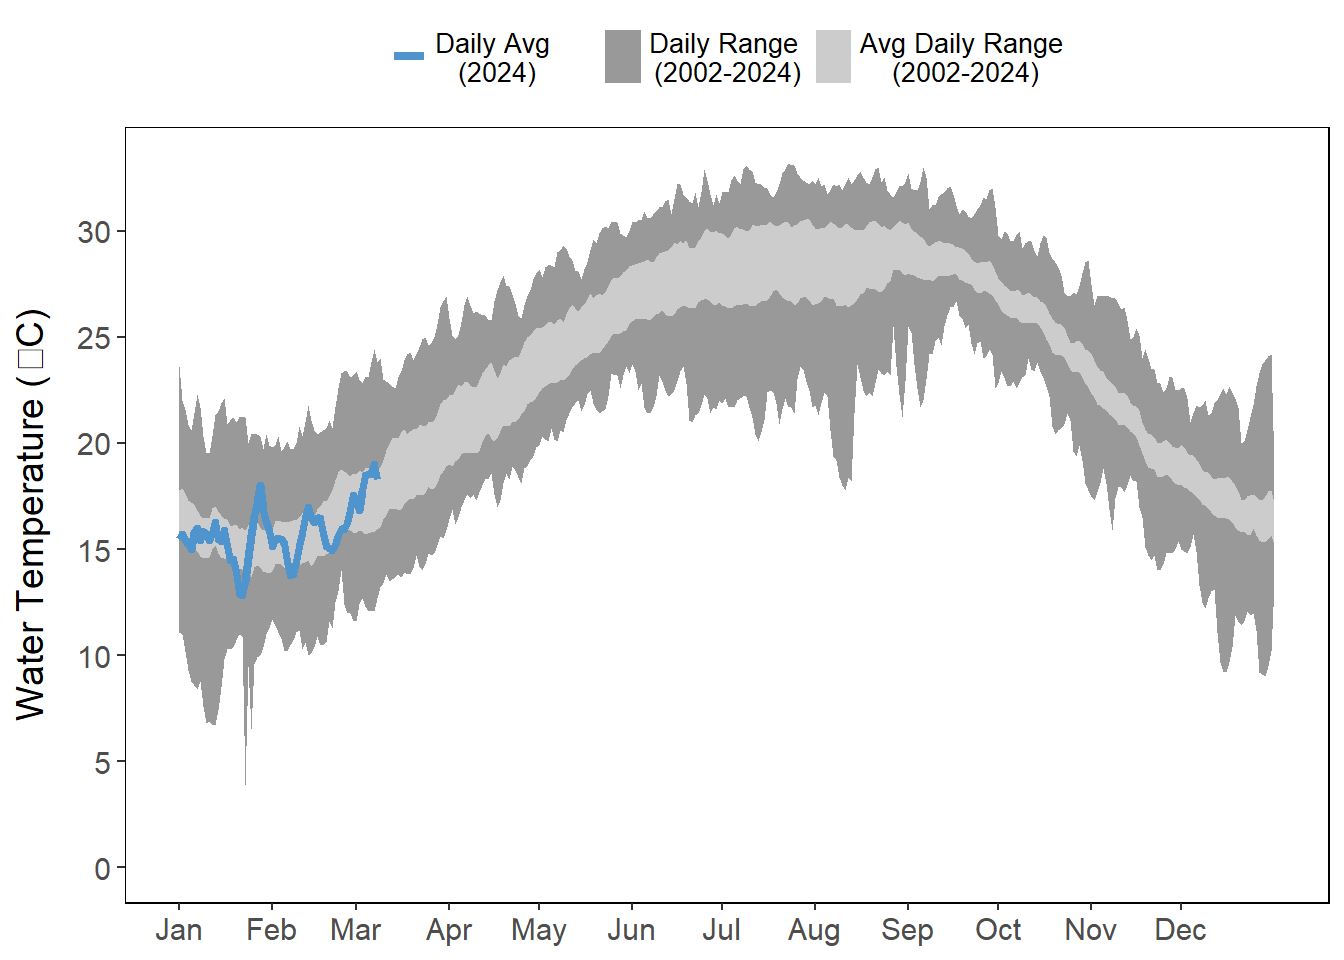
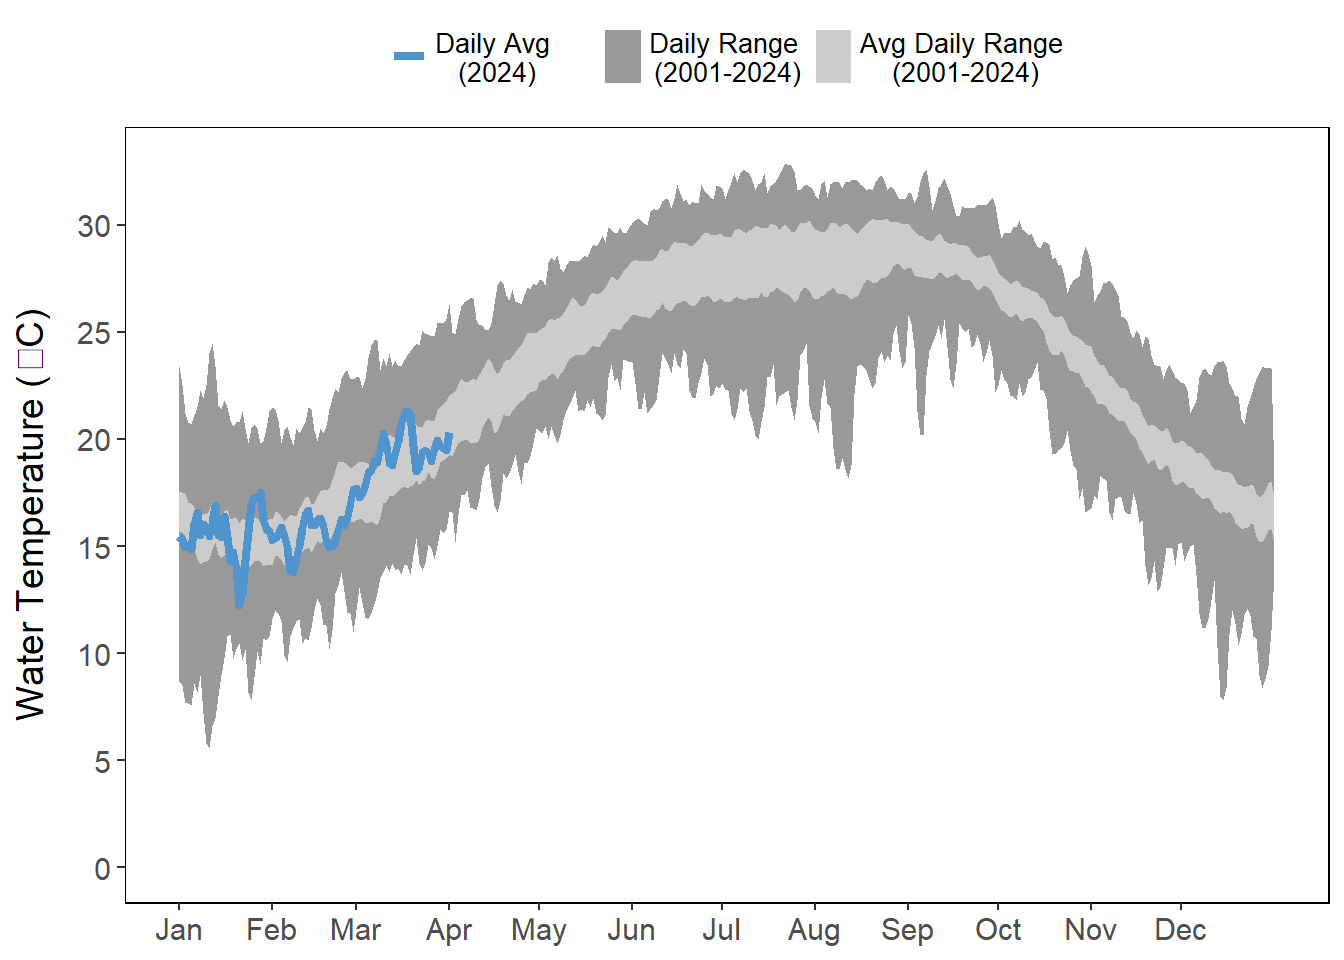
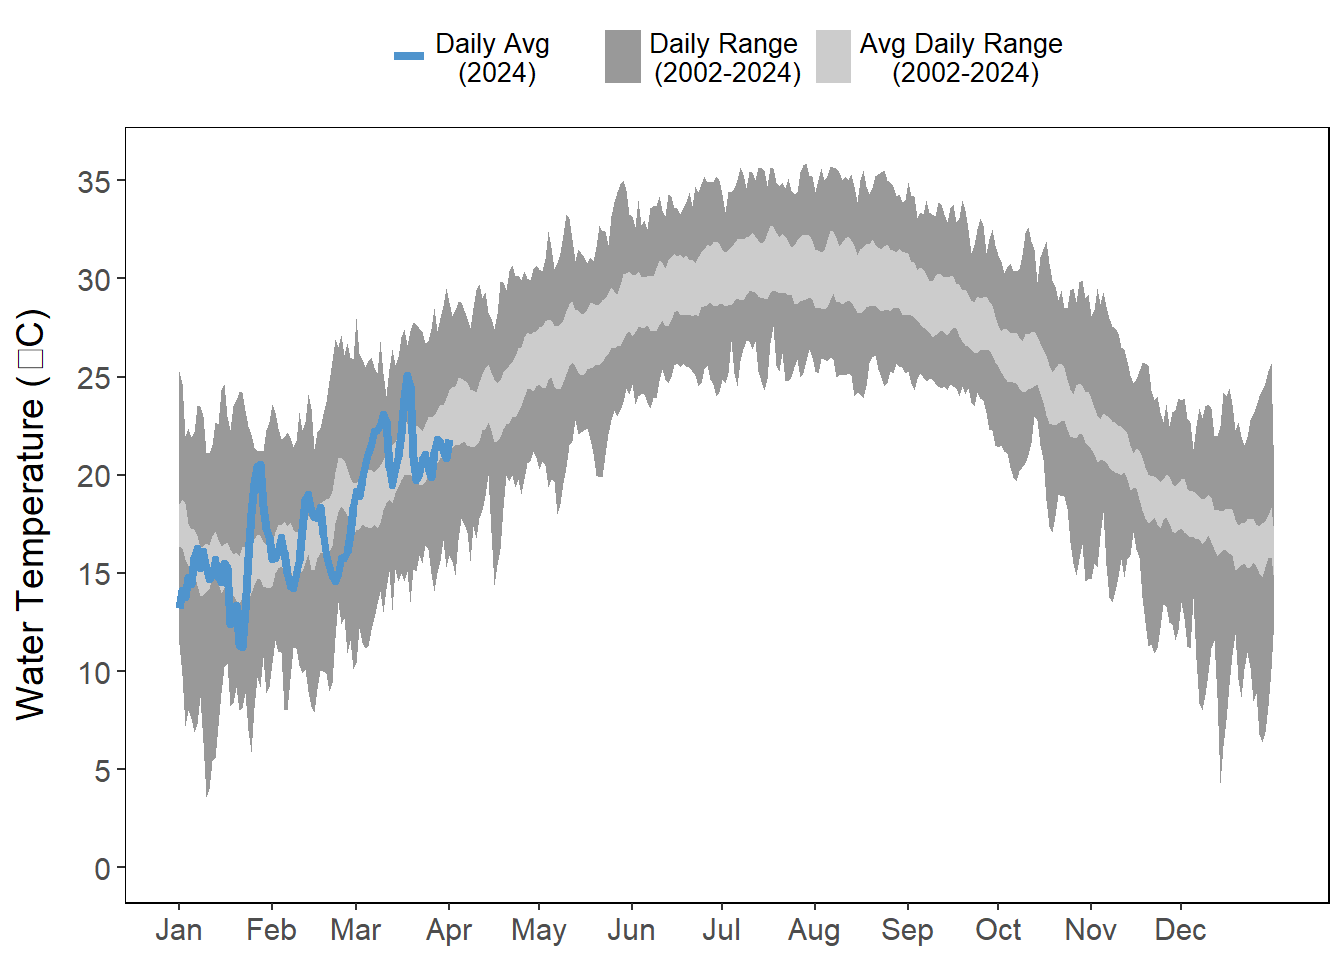
Daily averages in water temperature generally fell within historical ranges at the stations within the quarter, but all stations experienced lower temperature in January and higher temperatures in February and March (Figure 4.4). The changes in daily averages were observed at all four stations, though more pronounced at Pellicer Creek, the shallowest of the four stations (Figure 4.4 (d)).
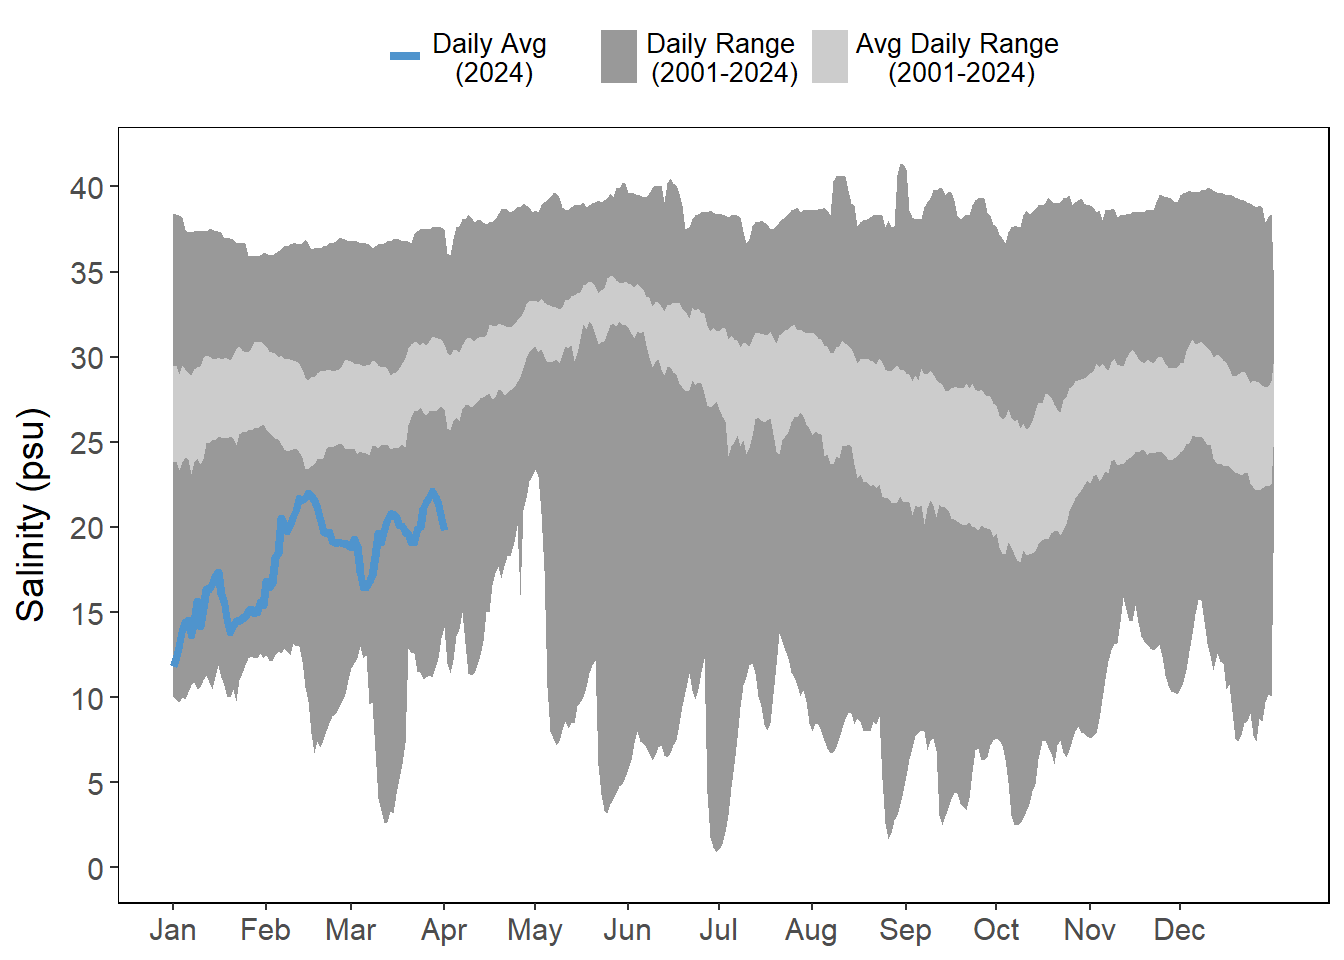
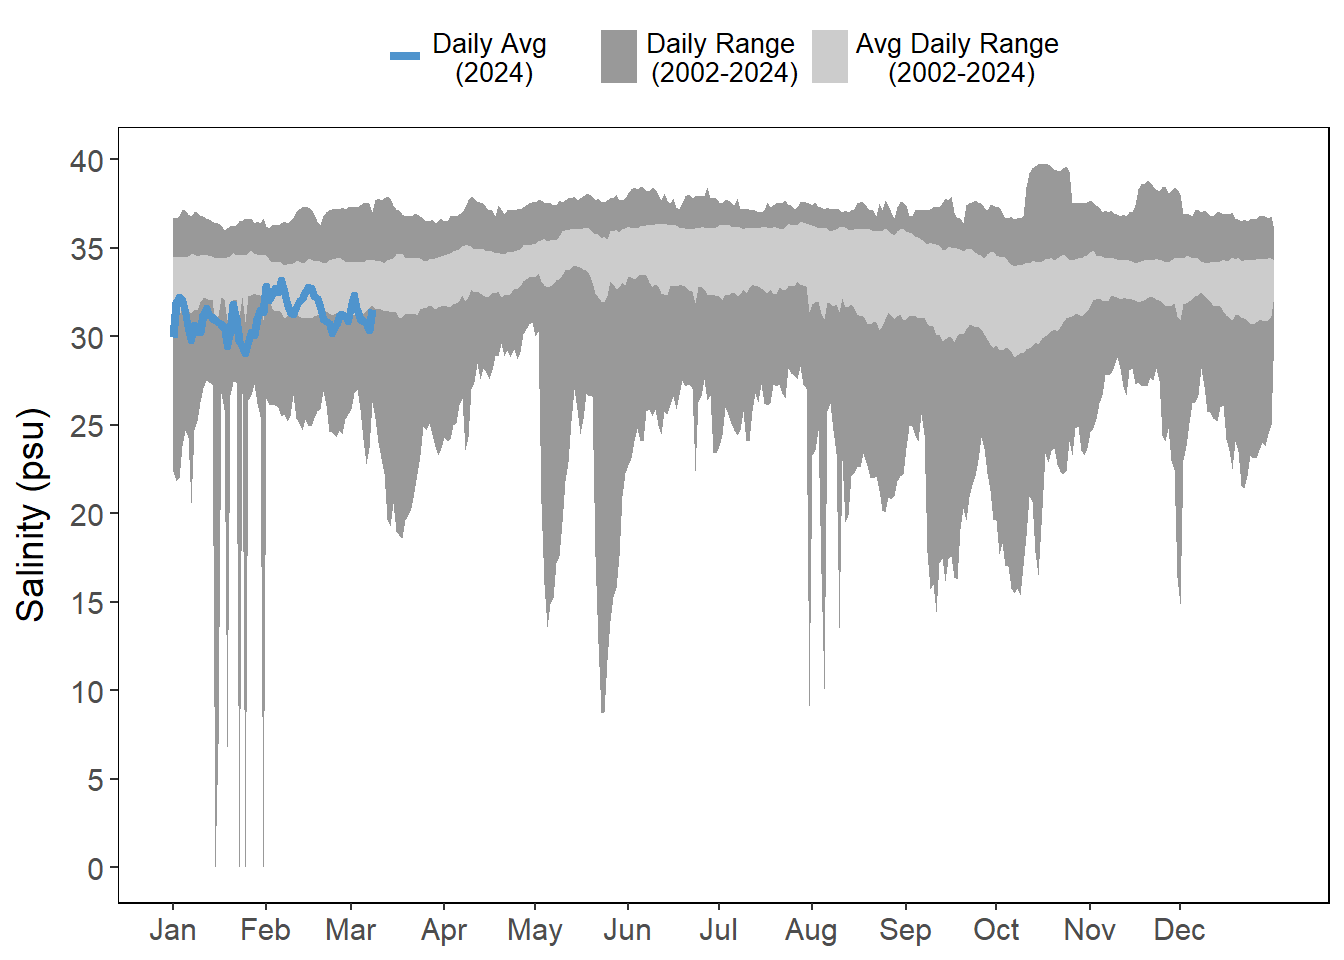
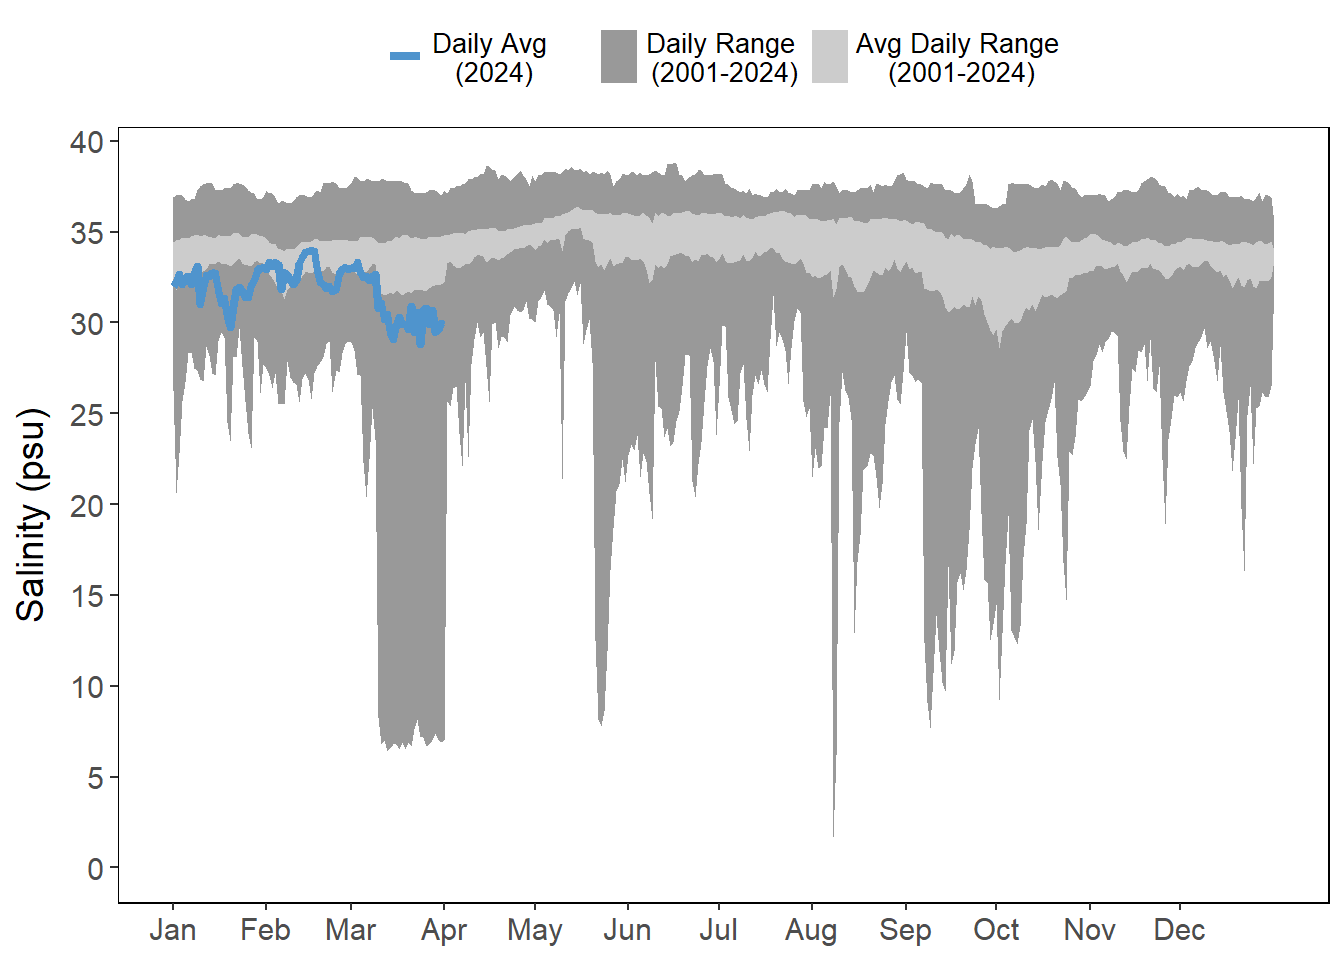
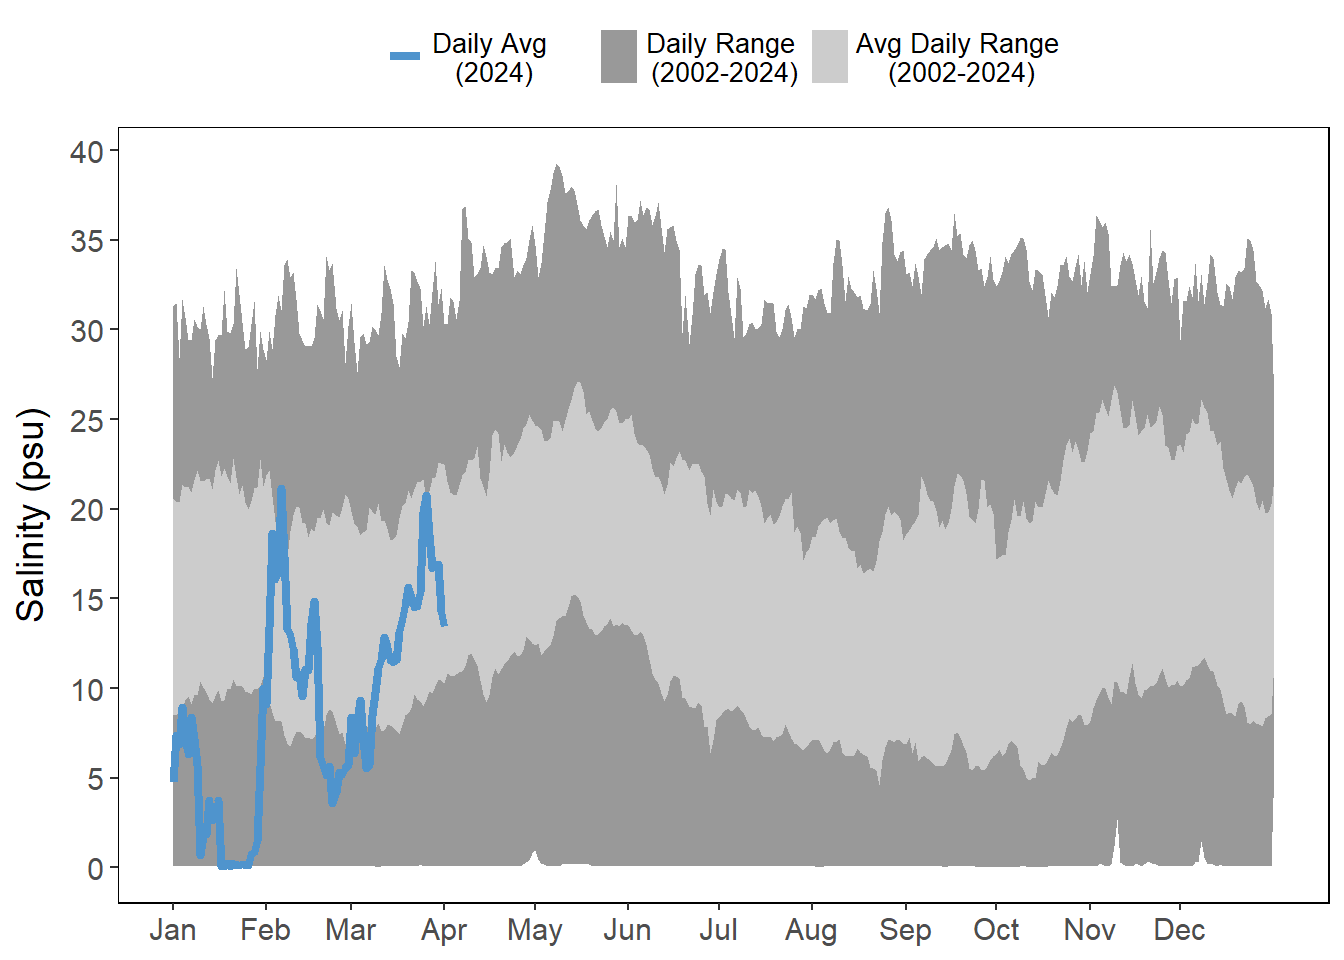
Rainfall in January brought salinities lower than their average daily ranges (Figure 4.5), particularly at the stations farthest from the inlets (Figure 4.5 (a); Figure 4.5 (d)). Salinities stayed below the average daily range at Pine Island for the entire quarter but increased at the other stations. All stations with the exception of San Sebastian (Figure 4.5 (b)) had increasing salinities in March.
4.2 Data
4.2.1 Rainfall
Data is presented as quarterly totals, then monthly, and then daily totals as “rain days” which are categorized into Wet (<10 mm), Very Wet (20-29 mm), and Extremely Wet (>30 mm) days.
4.2.2 Light Intensity
The plot below is interactive. Clicking on elements in the legend (months) will select or deselect months of interest. Additionally, the axis can be adjusted by selecting portions of the plot to isolate.
4.2.3 Temperature
Air and water temperatures are presented as daily averages (blue line) with historic ranges (daily range and average daily range) provided in shades of gray.
4.2.4 Salinity