| Start Time | End Time | Duration (hrs) |
|---|---|---|
| 2024-03-24 01:00:00 | 2024-03-25 09:45:00 | 33 |
6 Environmental Drivers
This section includes drivers of environmental patterns such as significant weather events (e.g., tropical cyclones, Nor’easters, large rainfall events), anomalies, and other local events with impact.
6.1 Tropical Cyclones
There were no tropical cyclones that had direct impacts in the GTM estuary during this reporting period.
6.2 Nor’easters
Typically, a Nor’easter is a storm along the East Coast of the United States with predominating winds from the northeast. These storms can last anywhere from a single day (24 hours) to several days or weeks. Callahan, Leathers, and Callahan (2022) found that these events can produce surges just as severe as tropical cyclone events, and occur much more frequently. These events are often in the news associated with blizzards in the New England area of the US; however, their impacts to northeast Florida are not insignificant. Often these storms bring higher water levels, heavy prevailing winds, precipitation, and reduced tidal exchange.
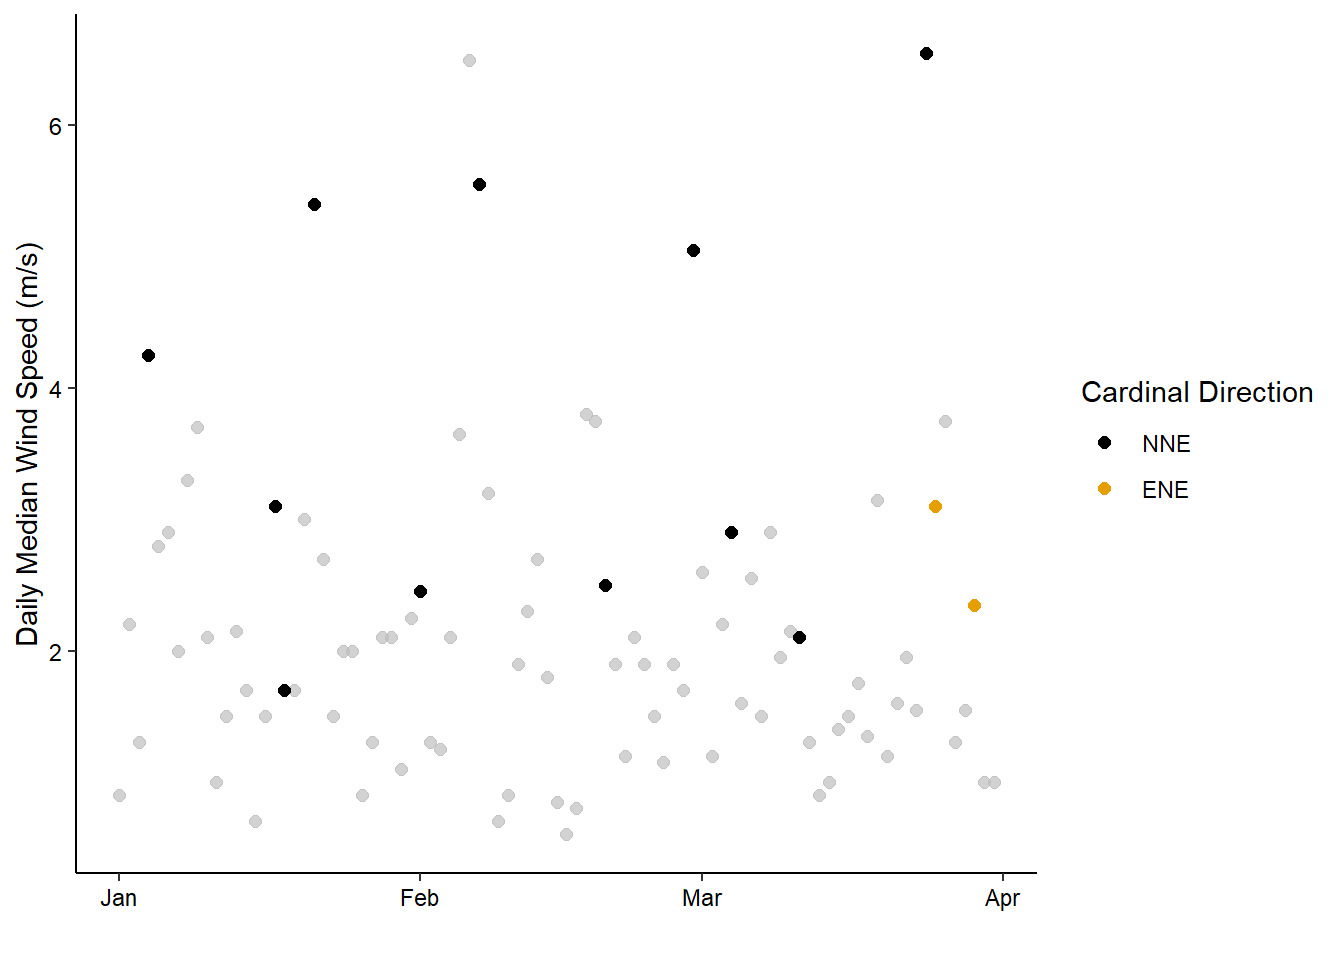
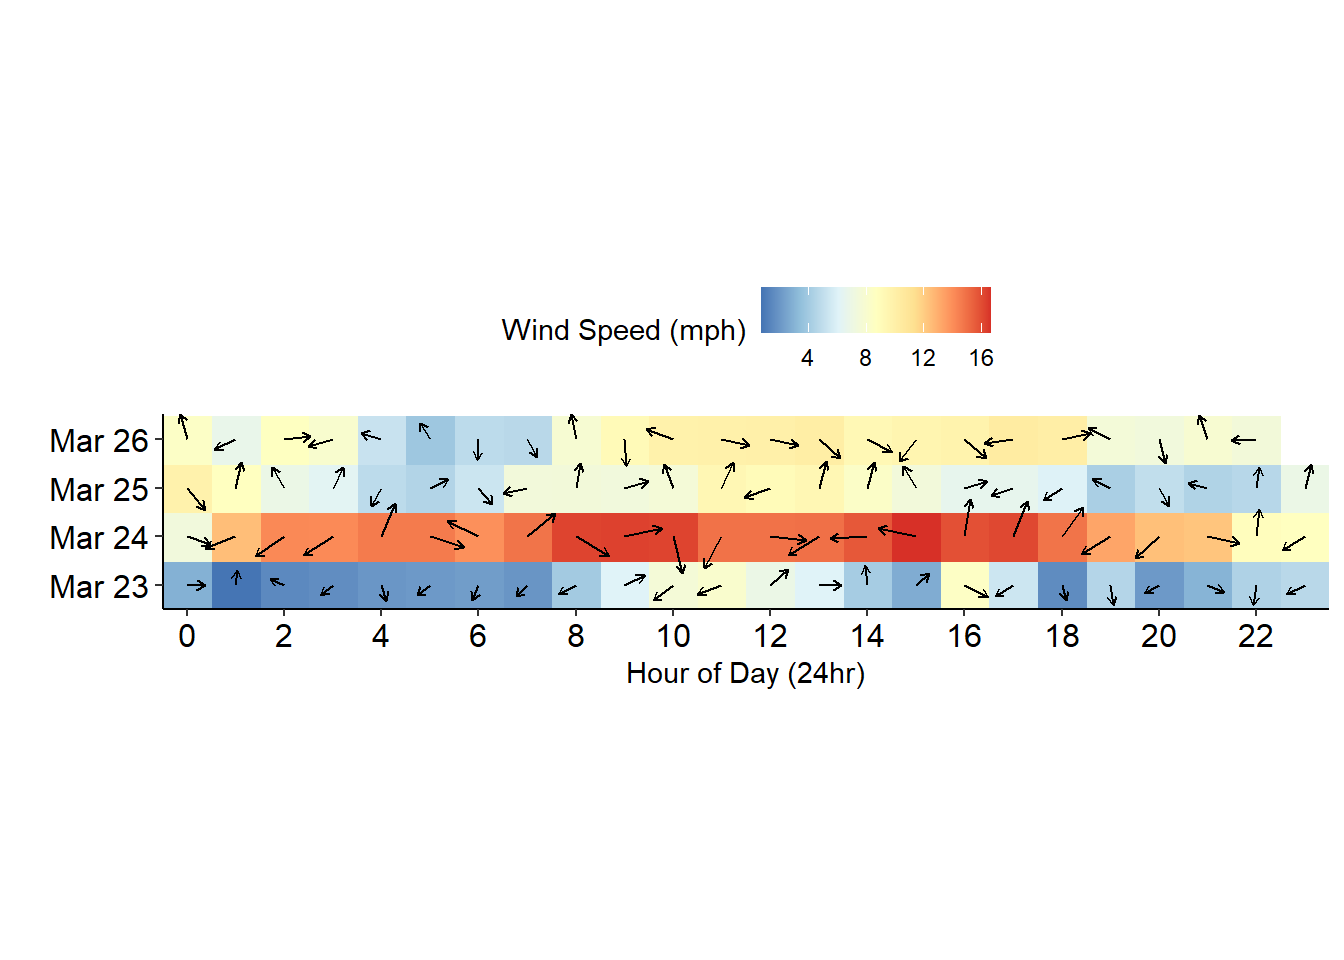
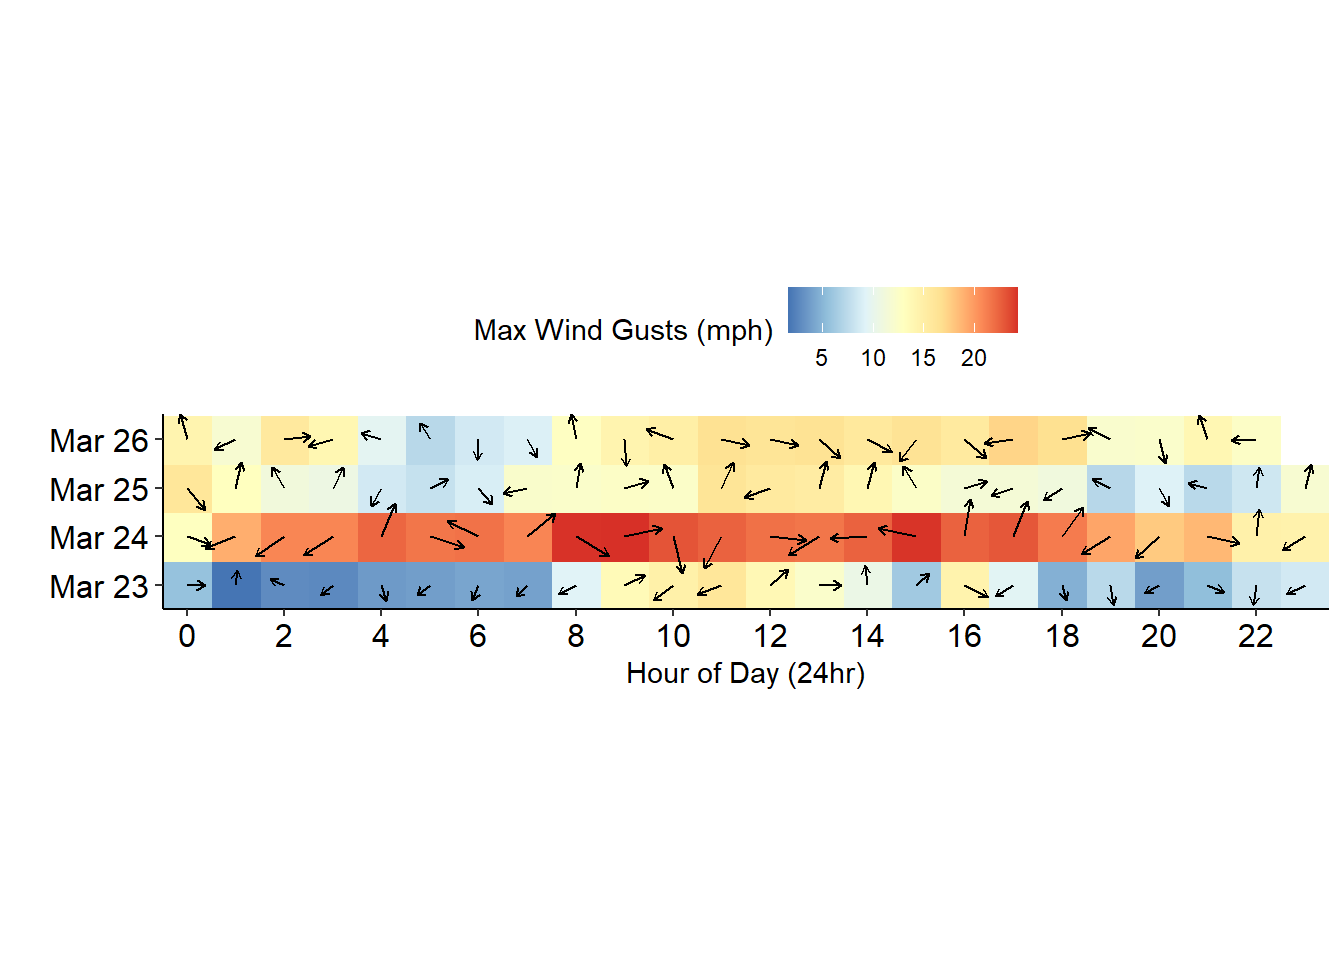
Using duration of wind directions between 0-100 degrees for greater than 24-hrs, one “Nor’easter” event was identified using data from the Pellicer Creek weather station (Table 6.1). Occasionally, localized wind directions result in values outside of this 0-100 degree window. The longest Nor’easter event occurred March 24th - March 25th, lasting 33 hours (Figure 6.4). This table does not identify strength of the winds during these events, just the time frames in which winds were originating and prevailing in the 0-100 degree directions (Figure 6.1).
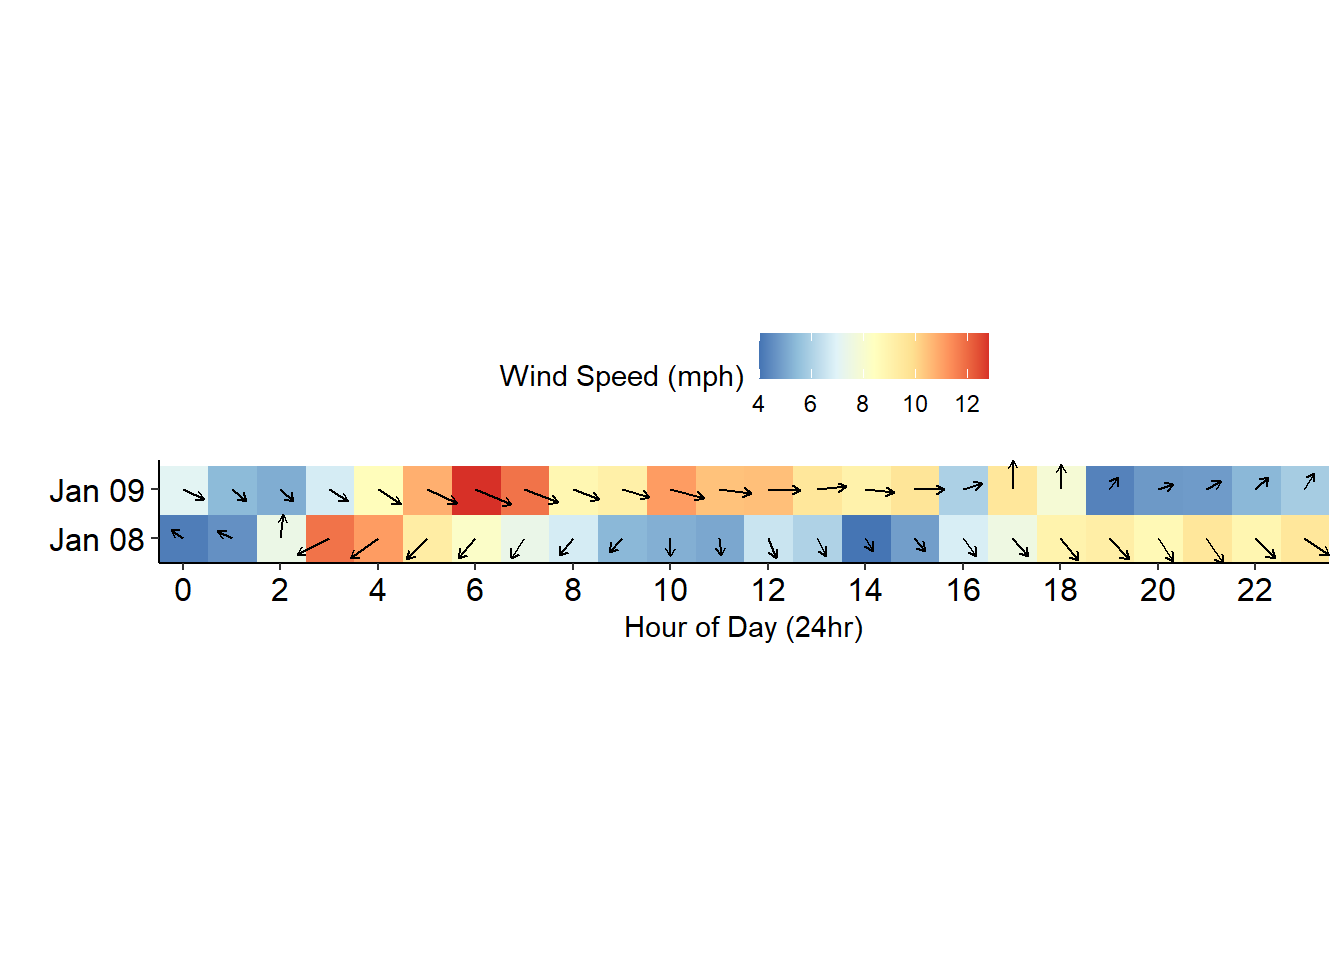
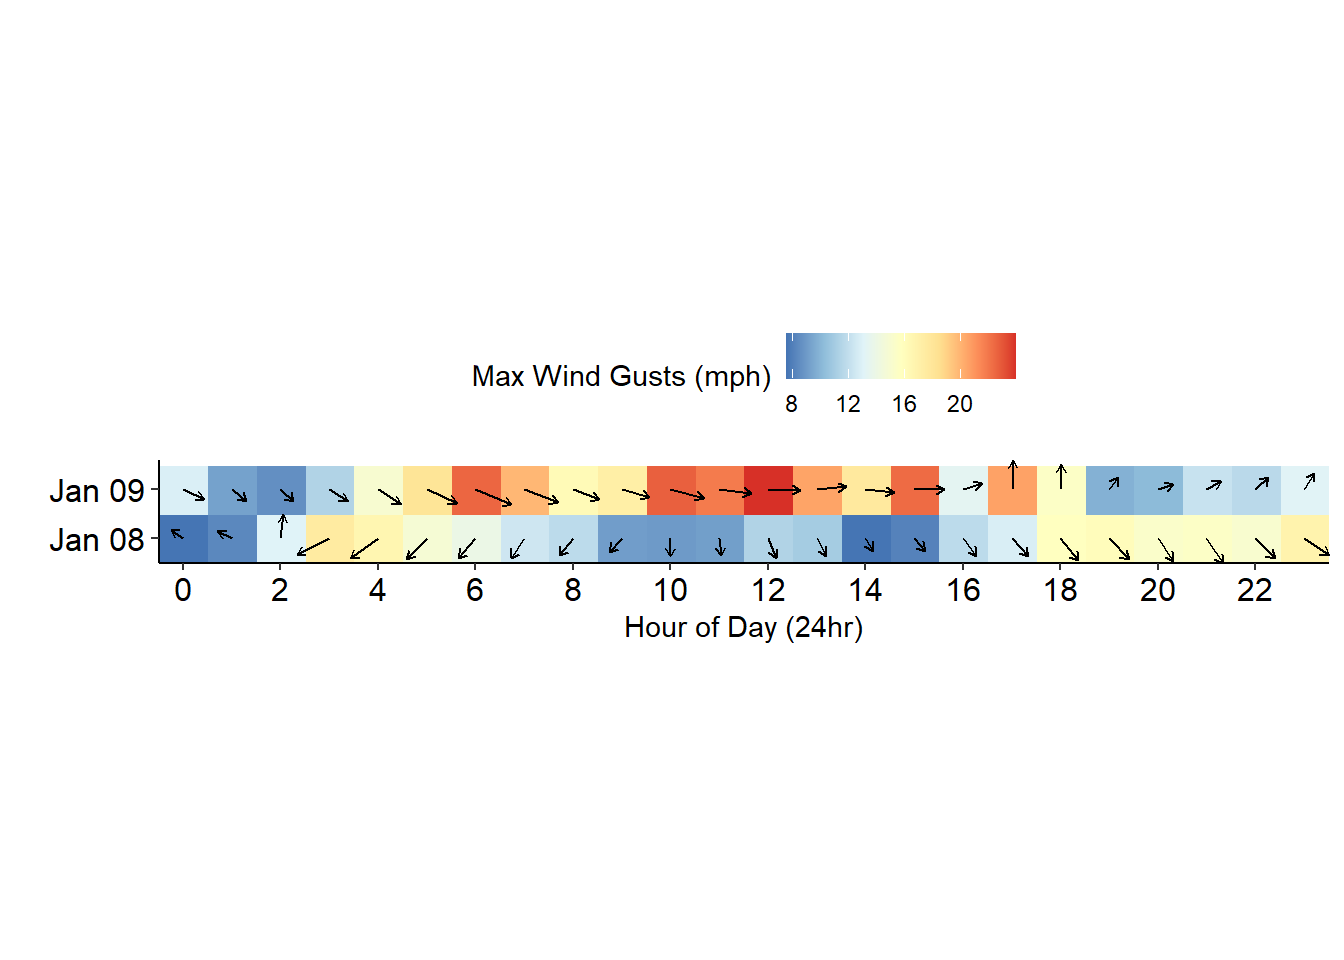
Additionally, northeast Florida felt the impacts of an unofficially named winter storm, Finn. Strong winds were predicted for the event as well as heavy localized rain. Saint Johns County was considered in an Enhanced Risk area (level 3 of 5) with strong southerly winds and the potential for tornadoes. Local schools were released early and government offices closed early in preparation for the fast moving storm. The Pellicer Creek weather station recorded over 23 mm of rain (Figure 4.1 (c)) and had a maximum wind speed of 28.9 mph (Figure 6.6 (b)).
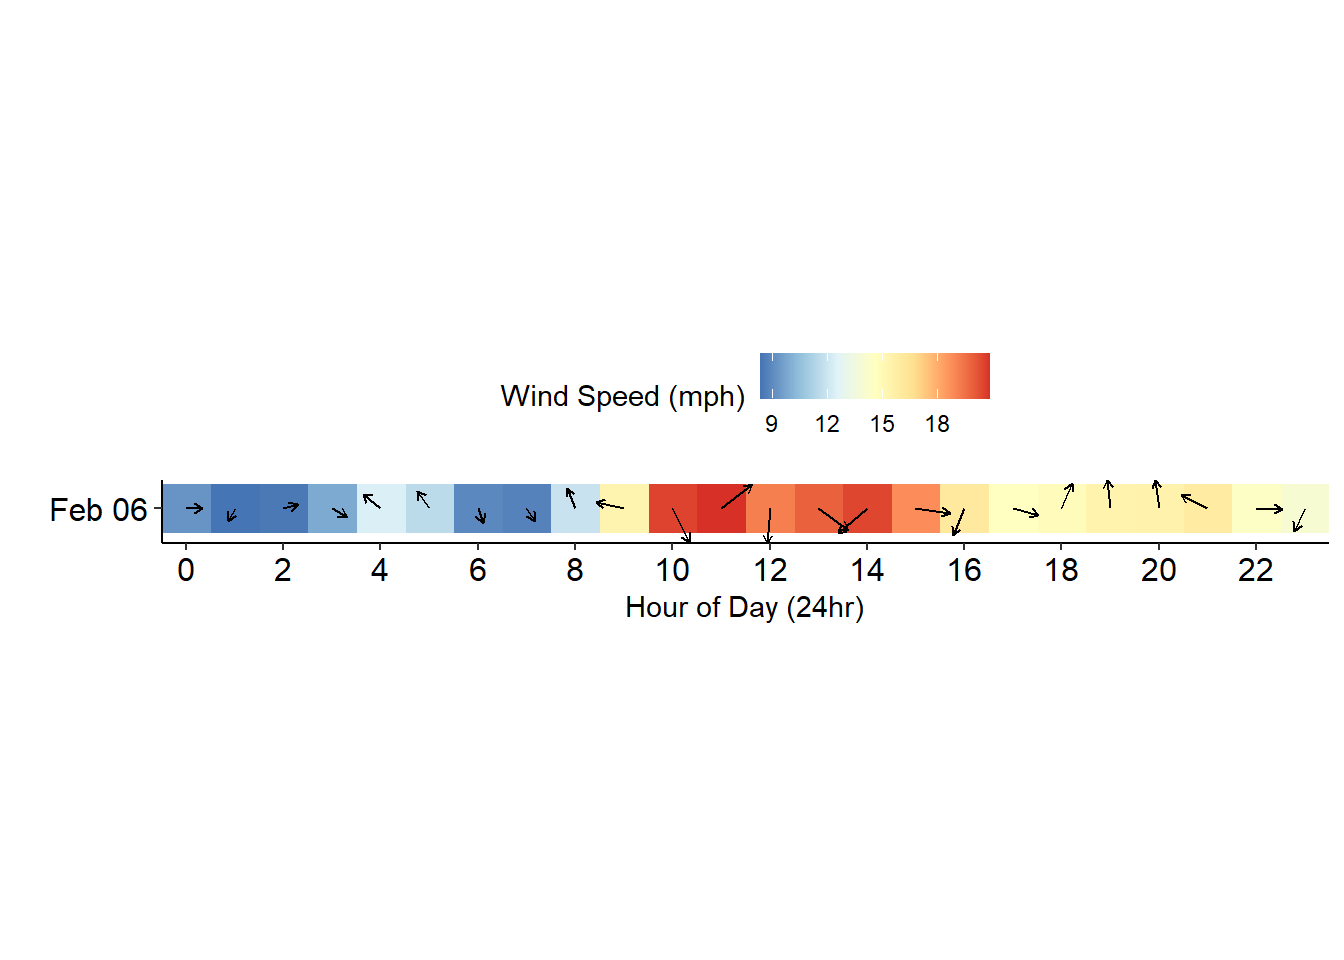
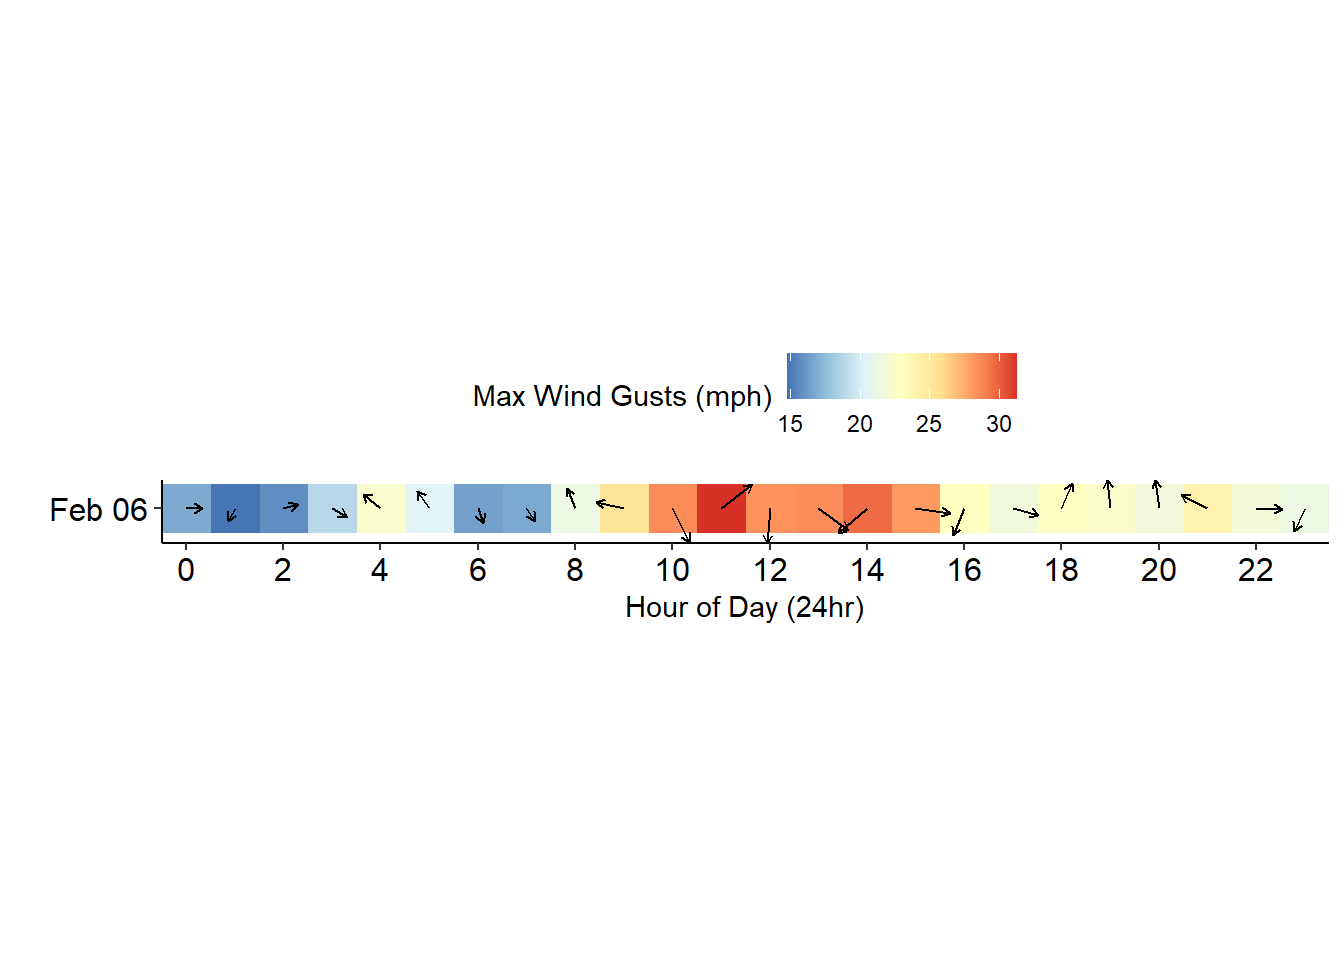
Another strong storm passed through the area on February 6th. This storm brought a lot of rain, hail and high winds to Northeast Florida. The National Weather Service confirmed that two tornadoes touched down in Jacksonville as a result of the extreme storm system. Surprisingly, the Pellicer Creek weather station did not record any rain from the event but it did record high winds. The winds were predominately from the north and the maximum wind speed was 32.7 mph (Figure 6.7). Strong winds initially raised salinity at all stations (Figure 4.5), and the effect was especially pronounced at Pellicer Creek (Figure 4.5 (d)).
6.3 King Tides
“King Tides” are the highest predicted tides of the year and in northeast Florida, these typically occur during the fall months. For the city of St. Augustine, these events often bring nuisance flooding in coastal and low-lying areas. For the estuary, this typically also means reduced tidal exchange, a lack of low tide events, and more and prolonged flooding in the intertidal wetlands. The city reports these events on their website.
Predicted king tide events for quarter one of 2024 were:
- January 11th-13th
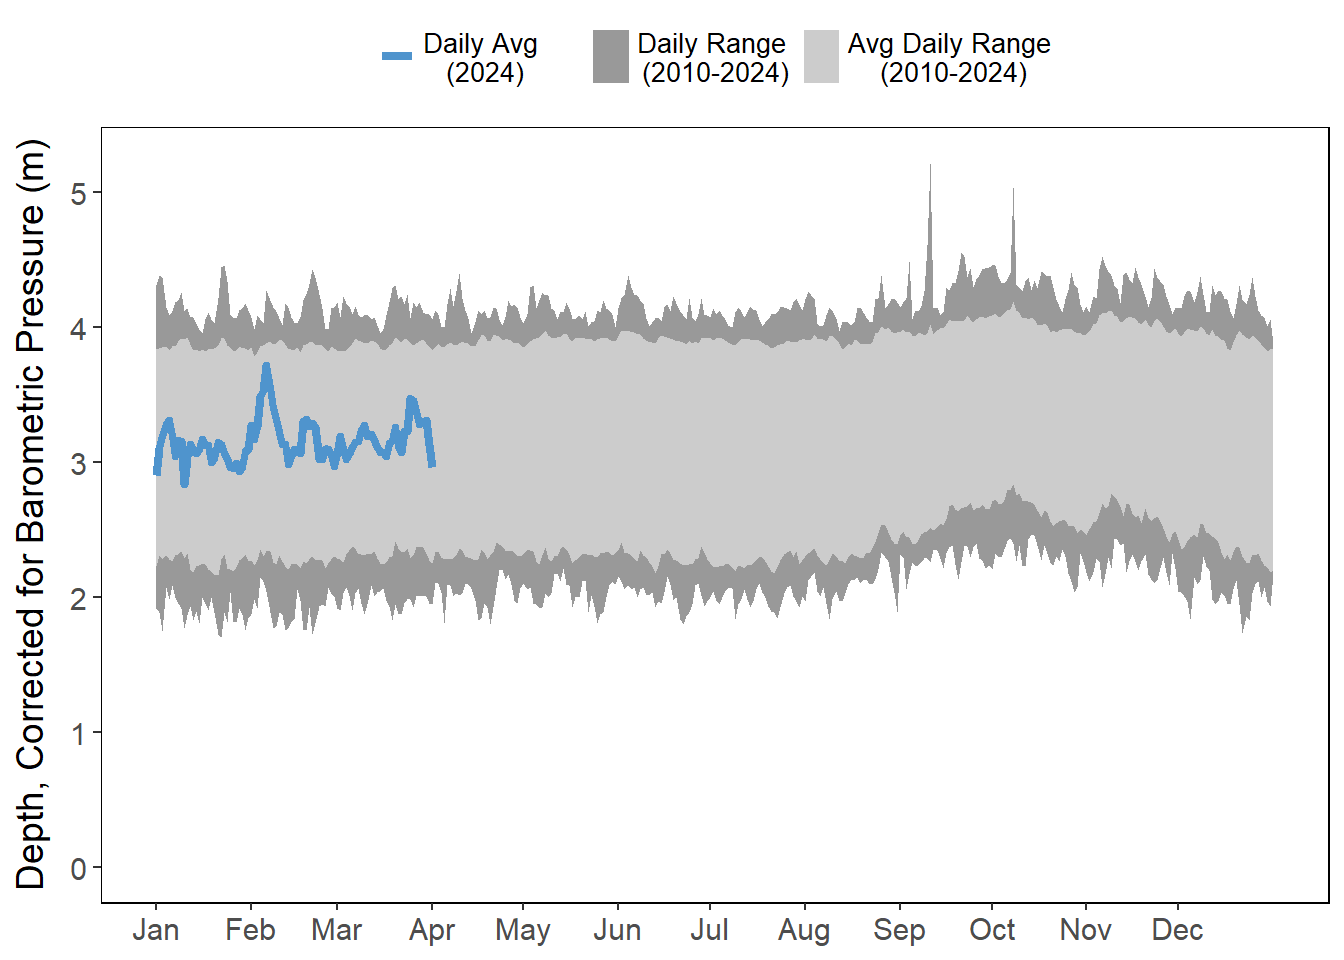
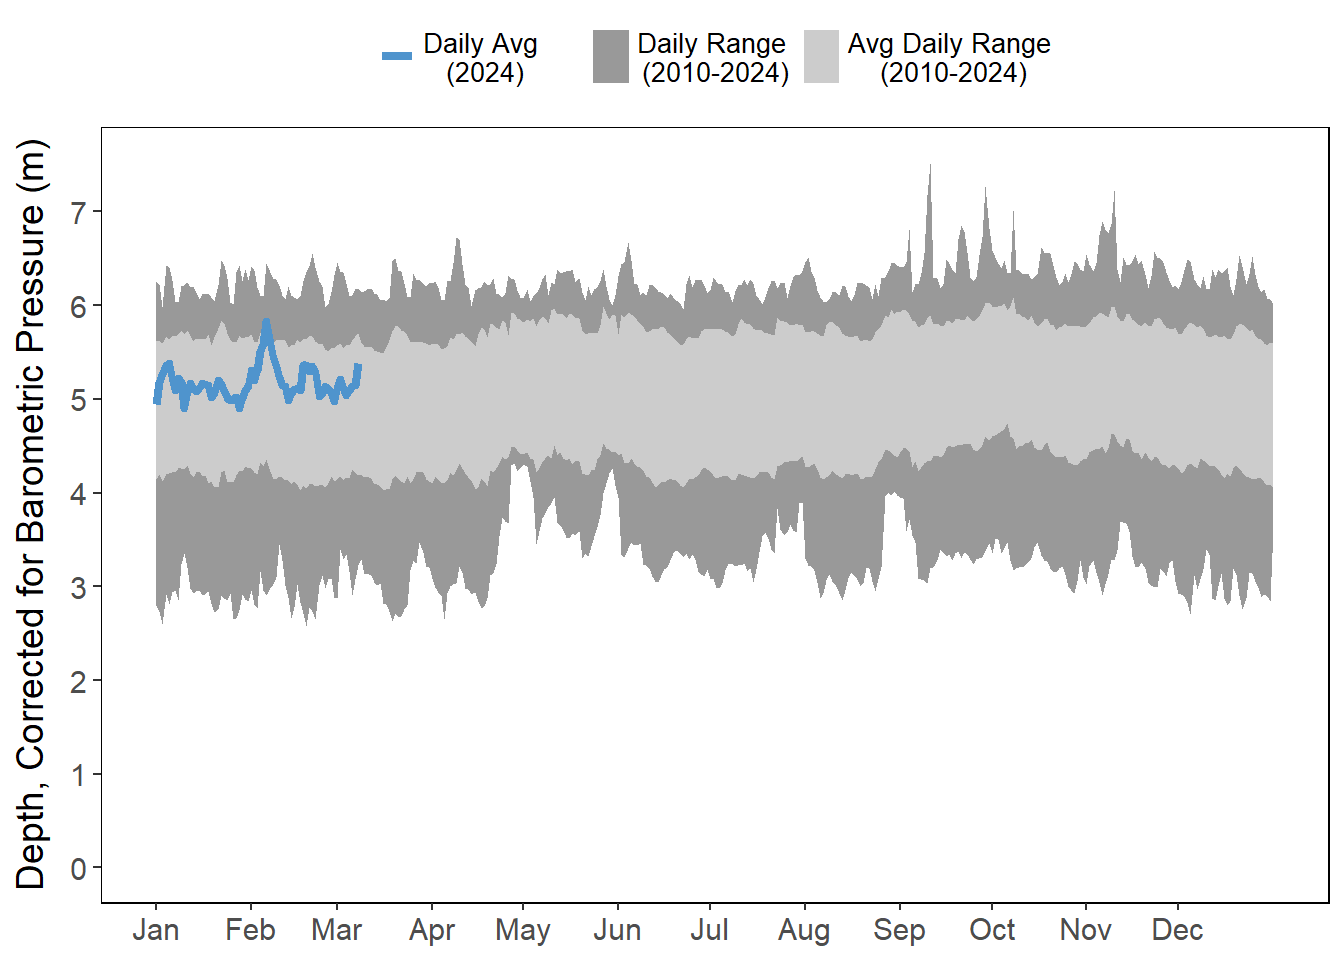
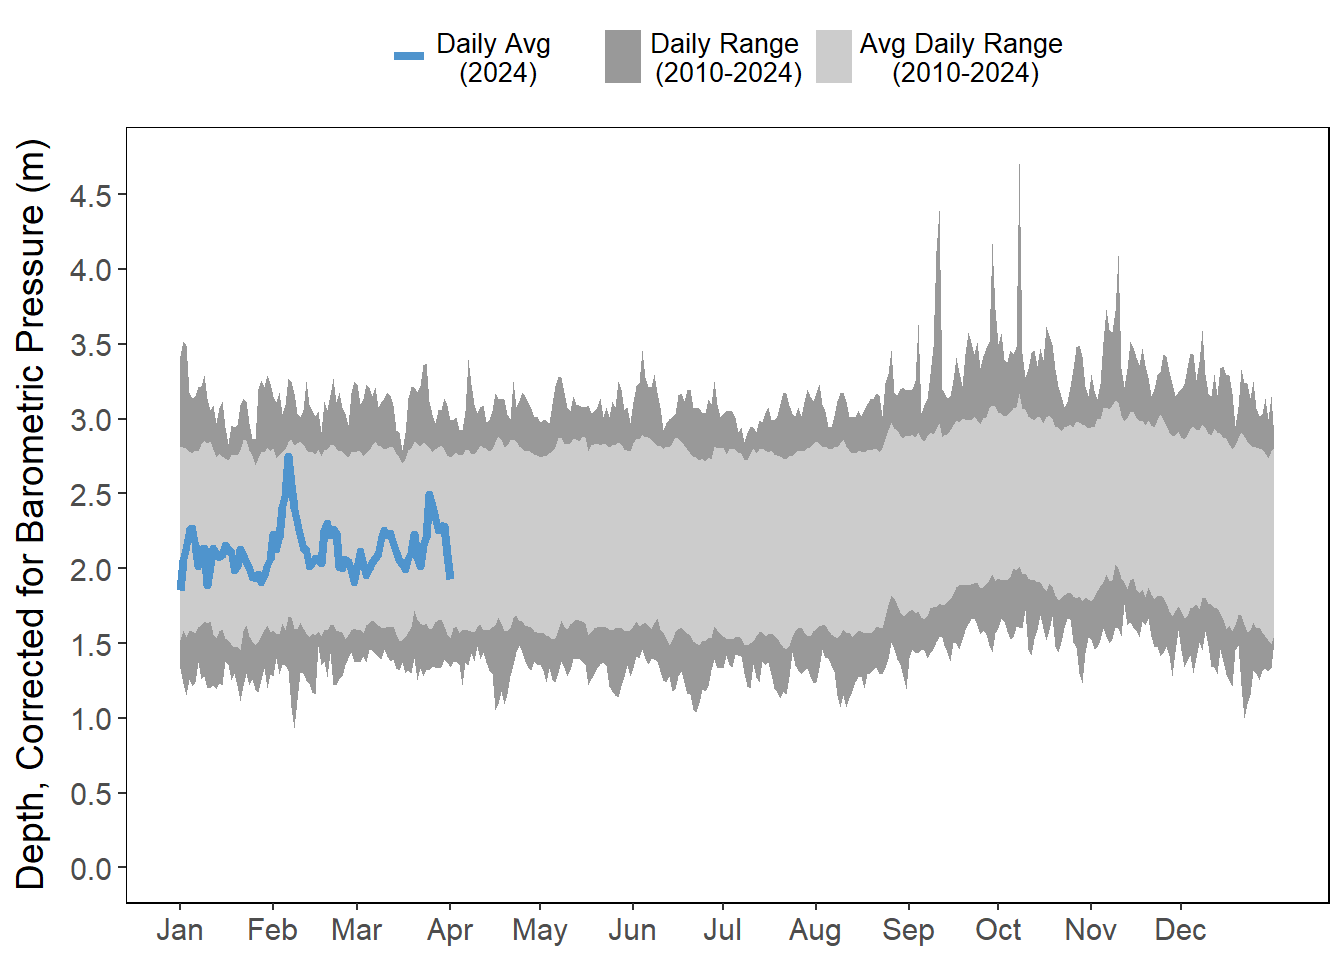
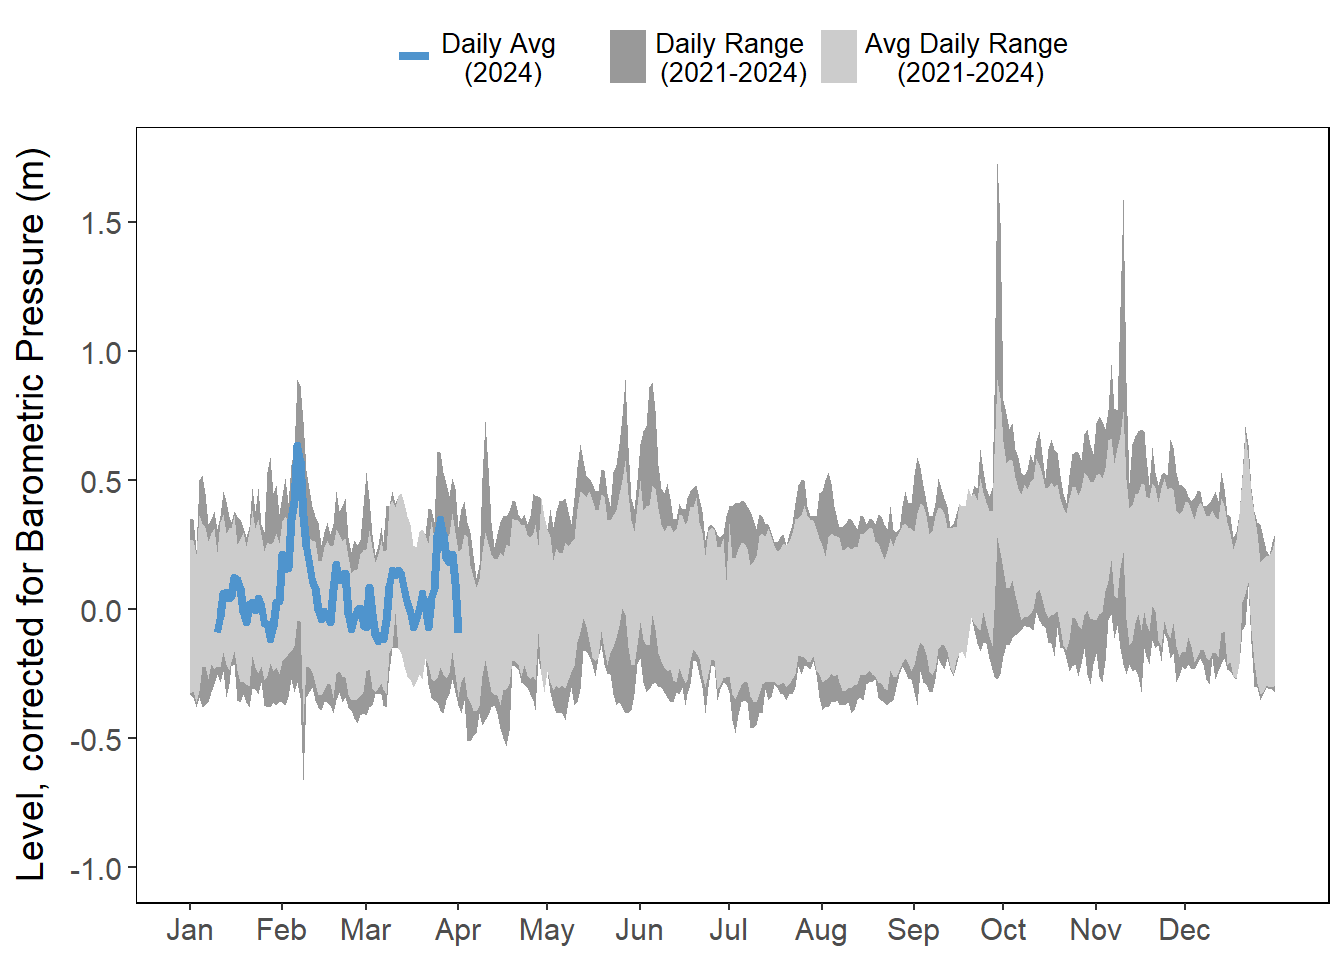
6.3.1 Water Depth
Note that the water level data at Pellicer Creek only includes data from 2021-2024, which is due to this station switching from reporting depth to reporting level (NAVD88) in 2021 (Figure 6.8 (d)).
6.4 Temperature anomalies
Extreme temperatures, both high and low, have drastic impacts on environmental function. For black mangroves (Avicennia germinans), temperatures under -4°C have been found to reduce mangrove cover (Cavanaugh et al. 2013). Extreme high temperatures are often health risks as they result in many heat-related illnesses.
Overall, examining monthly temperature anomalies the first part of the year January and March were higher than “normal” (Figure 6.9). With February of this year “cooler” than normal.
No freezing events were recorded in this recording year.
Callahan, John A, Daniel J Leathers, and Christina L Callahan. 2022. “Comparison of Extreme Coastal Flooding Events Between Tropical and Midlatitude Weather Systems in the Delaware and Chesapeake Bays for 19802019.” JOURNAL OF APPLIED METEOROLOGY AND CLIMATOLOGY 61.
Cavanaugh, Kyle C., James R. Kellner, Alexander J. Forde, Daniel S. Gruner, John D. Parker, Wilfrid Rodriguez, and Ilka C. Feller. 2013. “Poleward Expansion of Mangroves Is a Threshold Response to Decreased Frequency of Extreme Cold Events.” Proceedings of the National Academy of Sciences 111 (2): 723–27. https://doi.org/10.1073/pnas.1315800111.