5 Nutrient Indicators
The state thresholds used in the chlorophyll a, total nitrogen, and total phosphorus visualizations come from Florida State Surface Water Quality Standards within the Florida Administrative Code.
By visiting Florida Rules
5.1 Summary
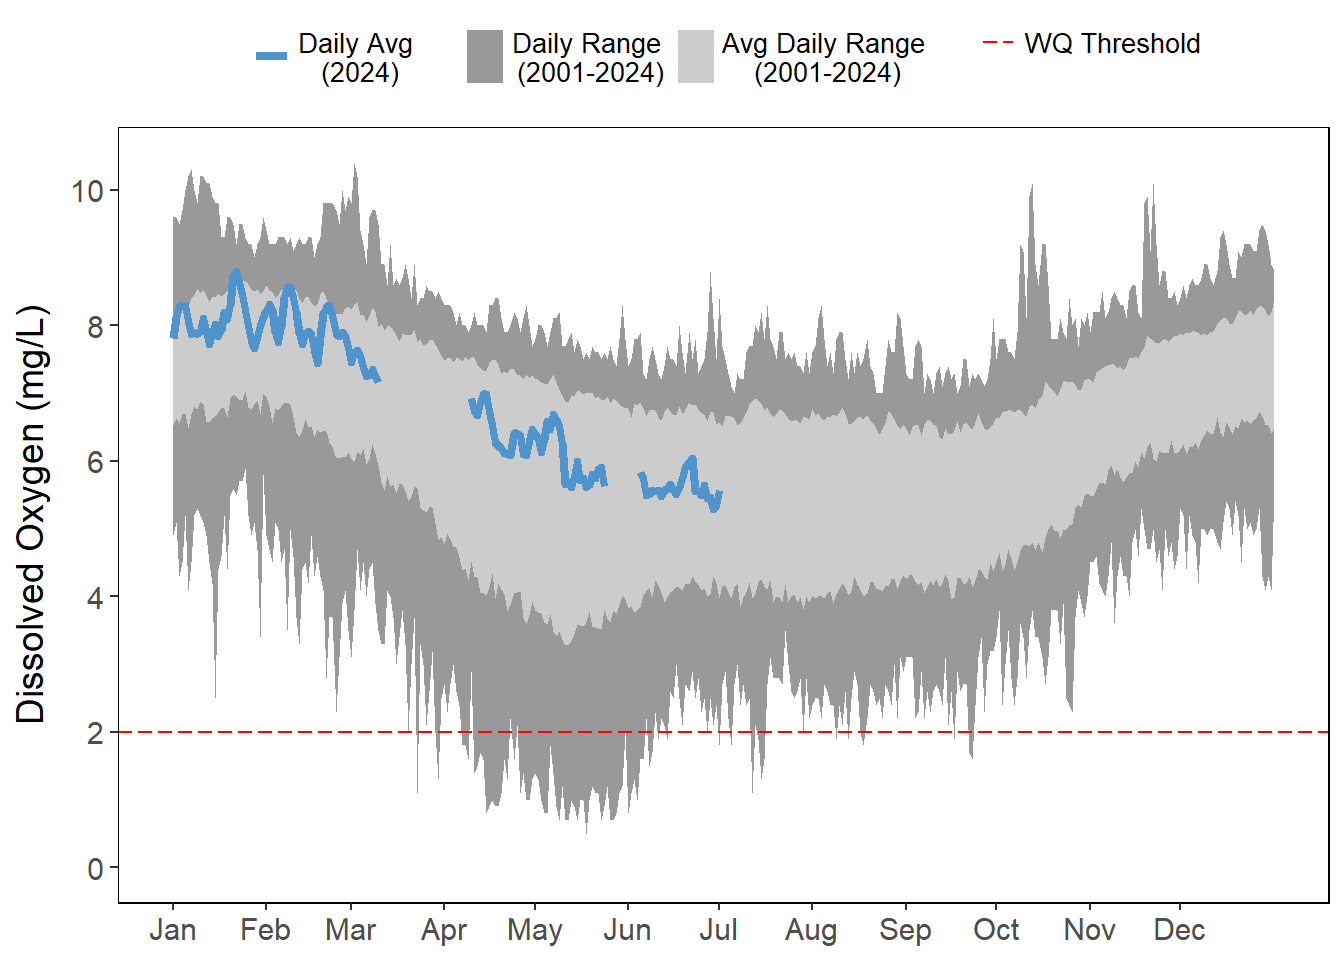
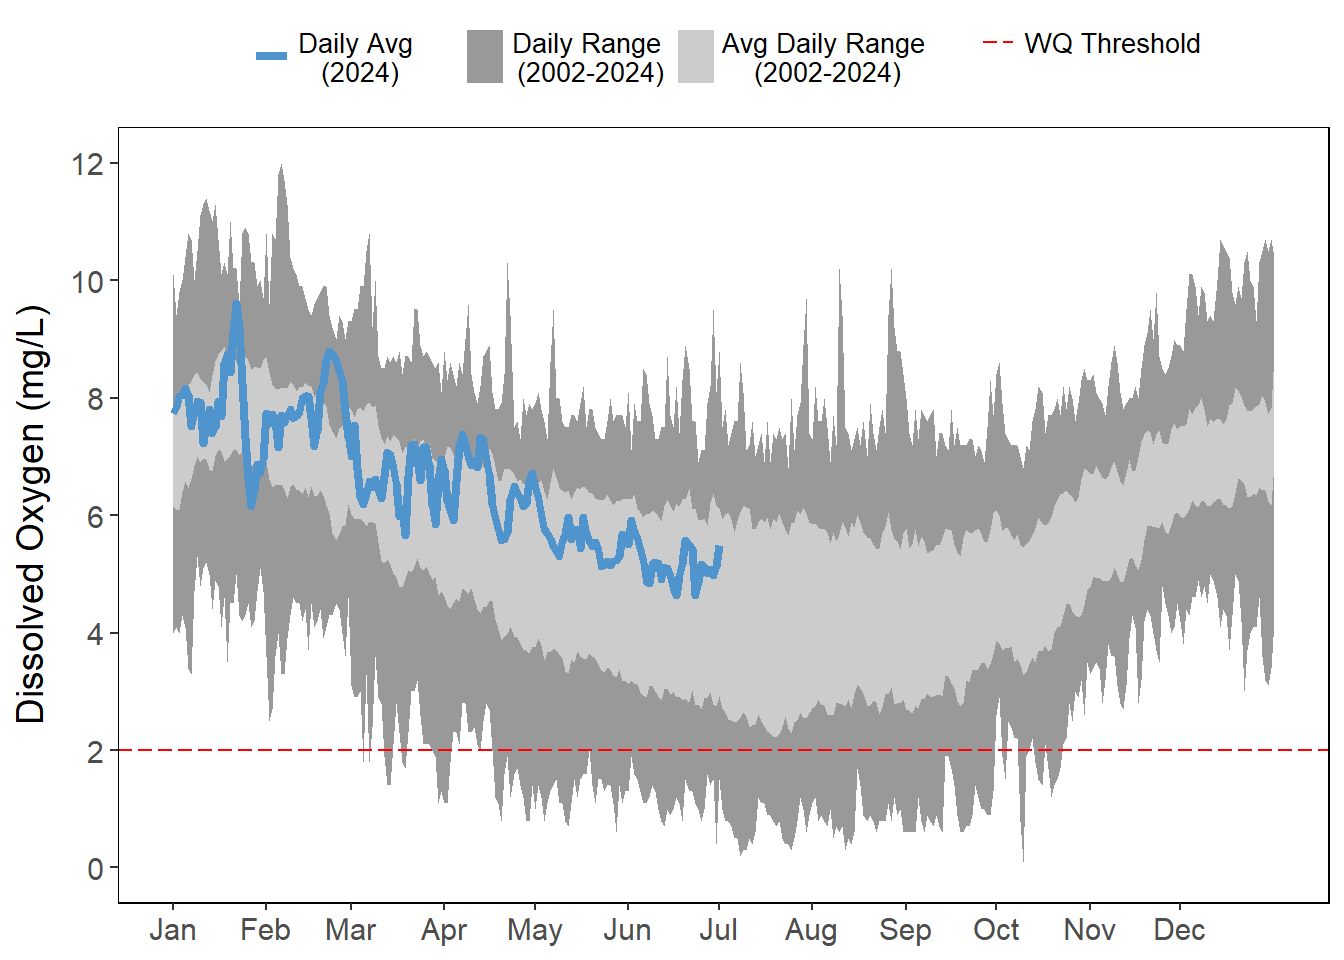
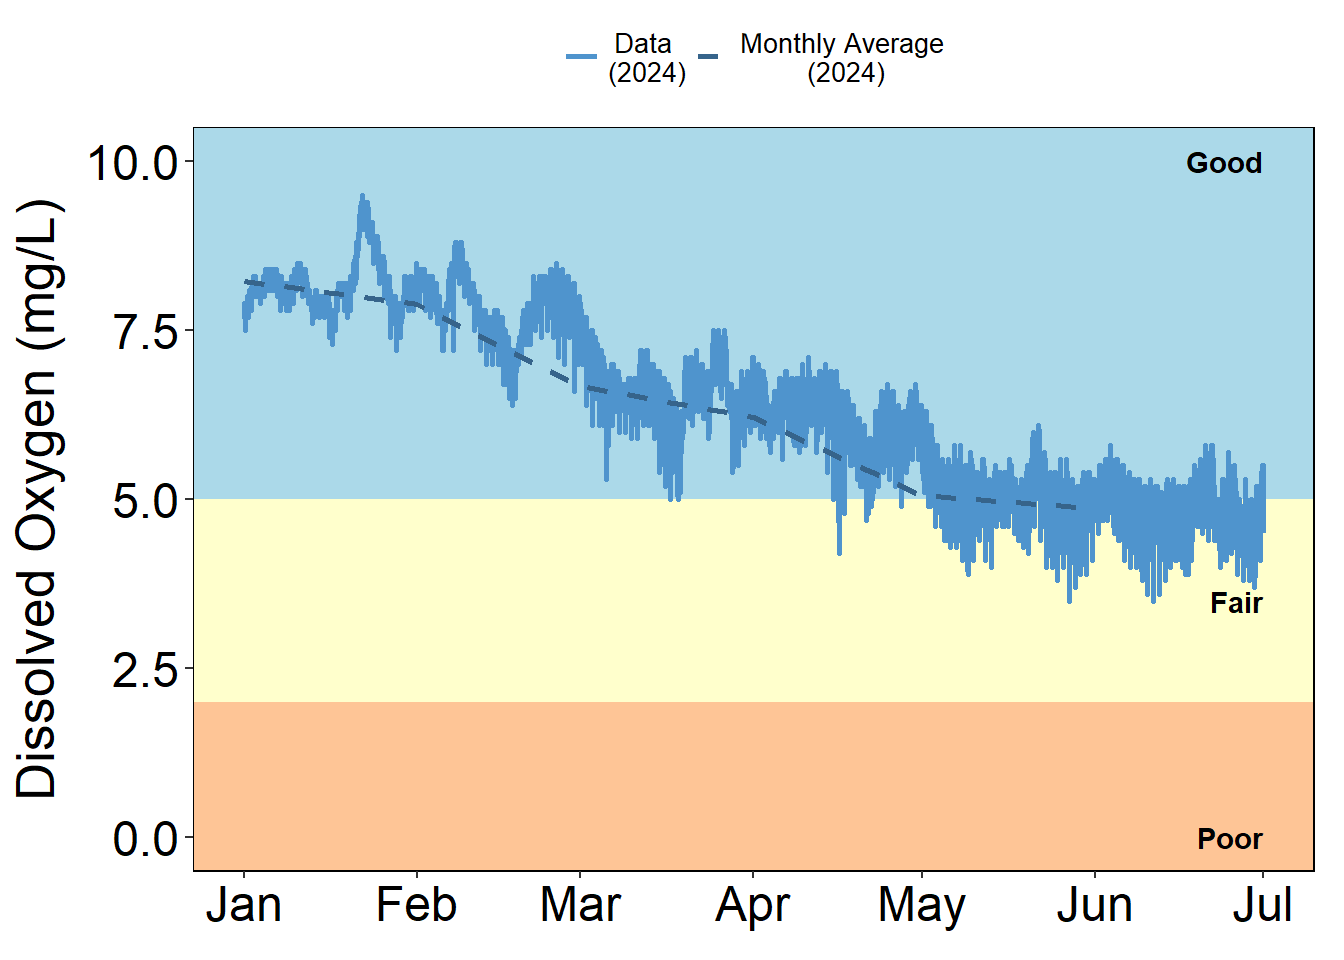
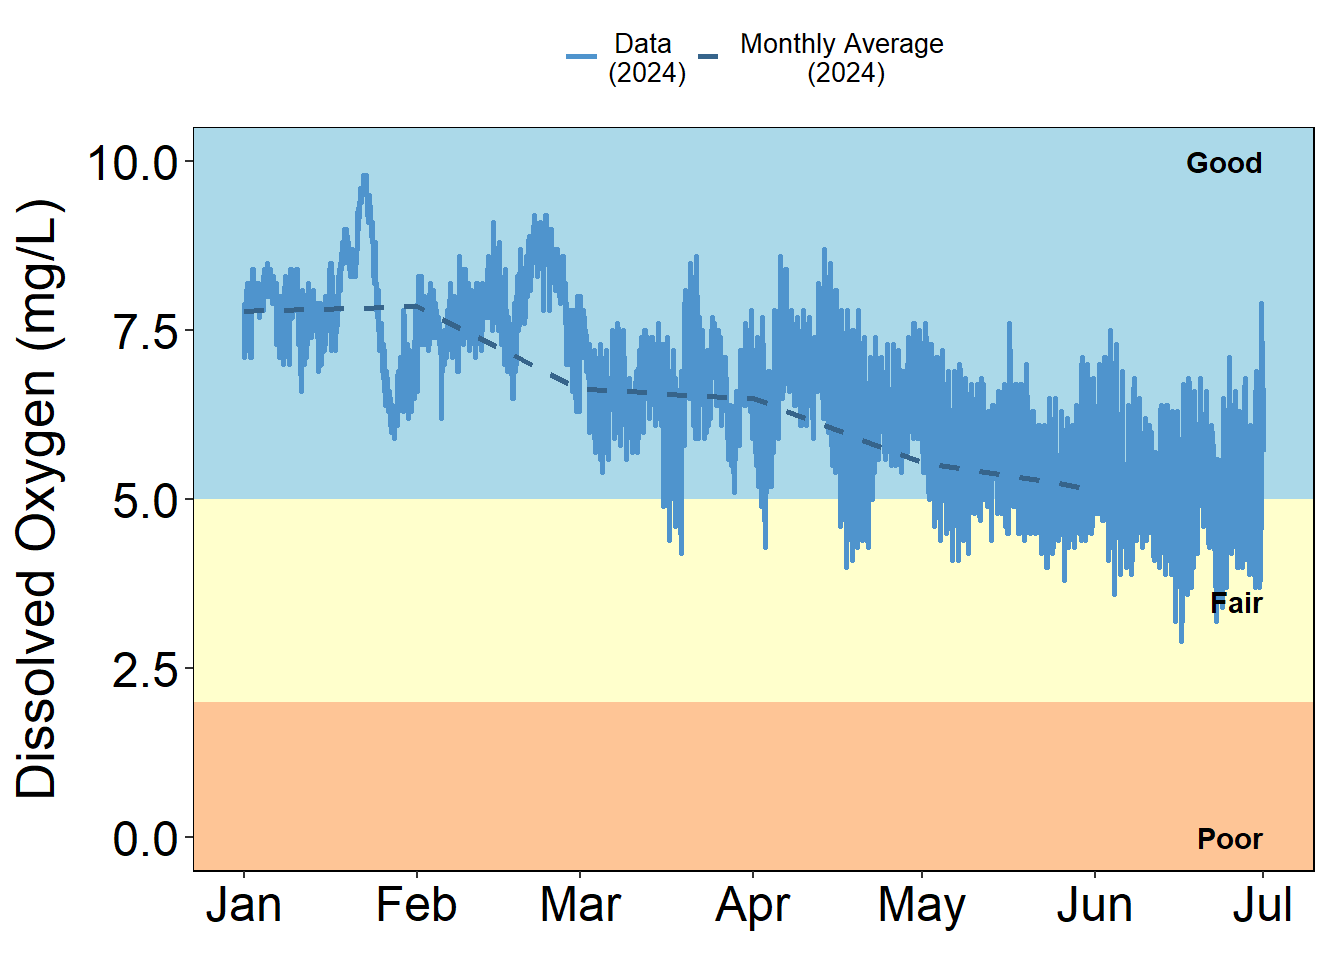
Daily average dissolved oxygen values were mostly within or above their average ranges so far in 2024 (Figure 5.1); however, Pine Island and Pellicer Creek (Figure 5.1; Figure 5.1 (d)) had above average and below daily average range. In previous years, dissolved oxygen values at Pine Island (Figure 5.2 (a)) and Pellicer Creek (Figure 5.3 (a)) frequently fell below the 2 mg/L hypoxia threshold, but so far in 2024, there have not been any dissolved oxygen readings below that threshold (Figure 5.2 (b), (Figure 5.3 (b)).
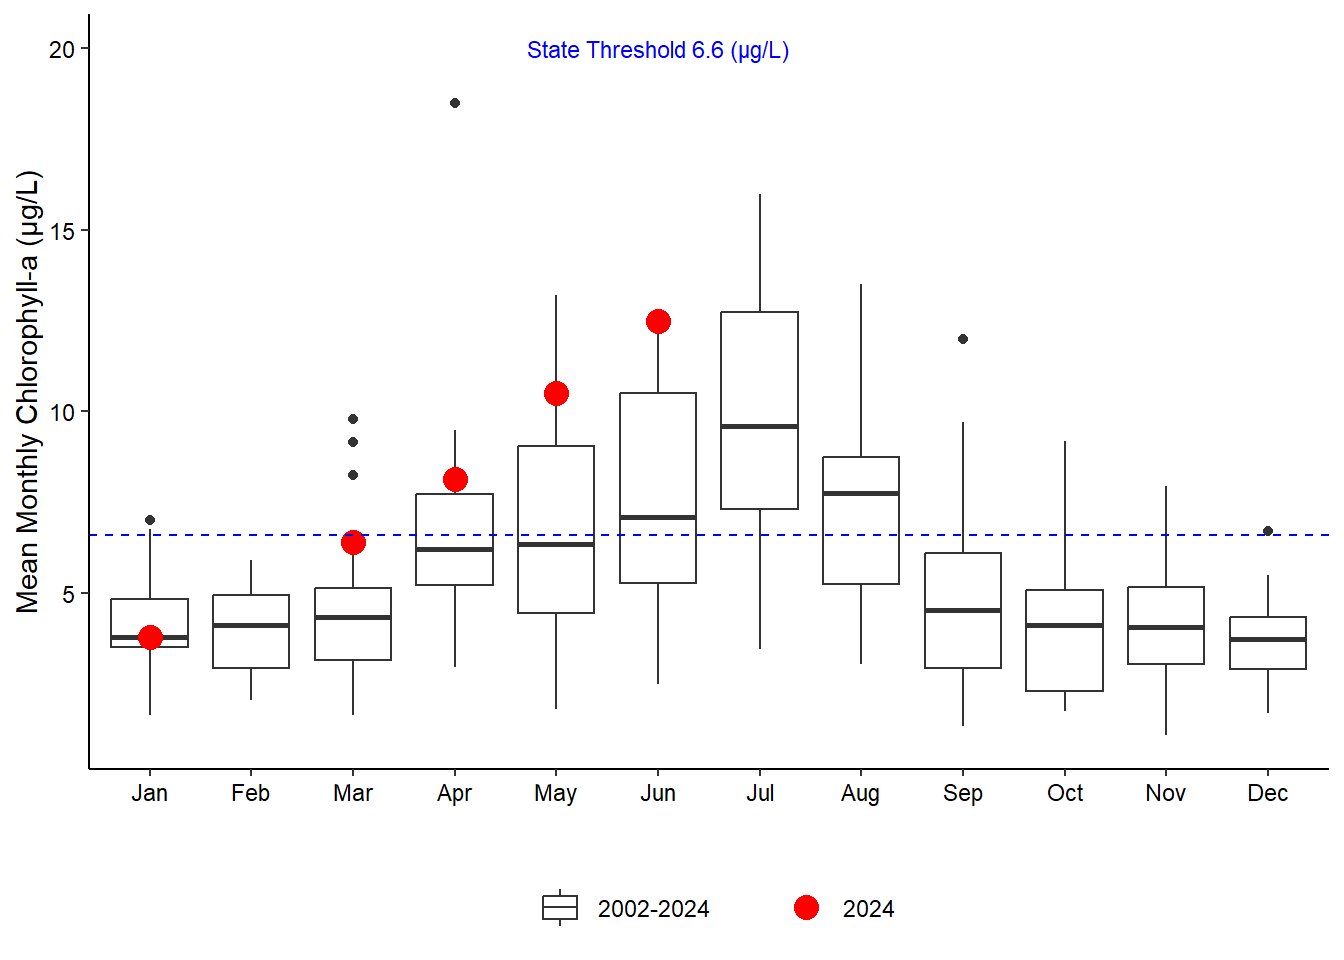
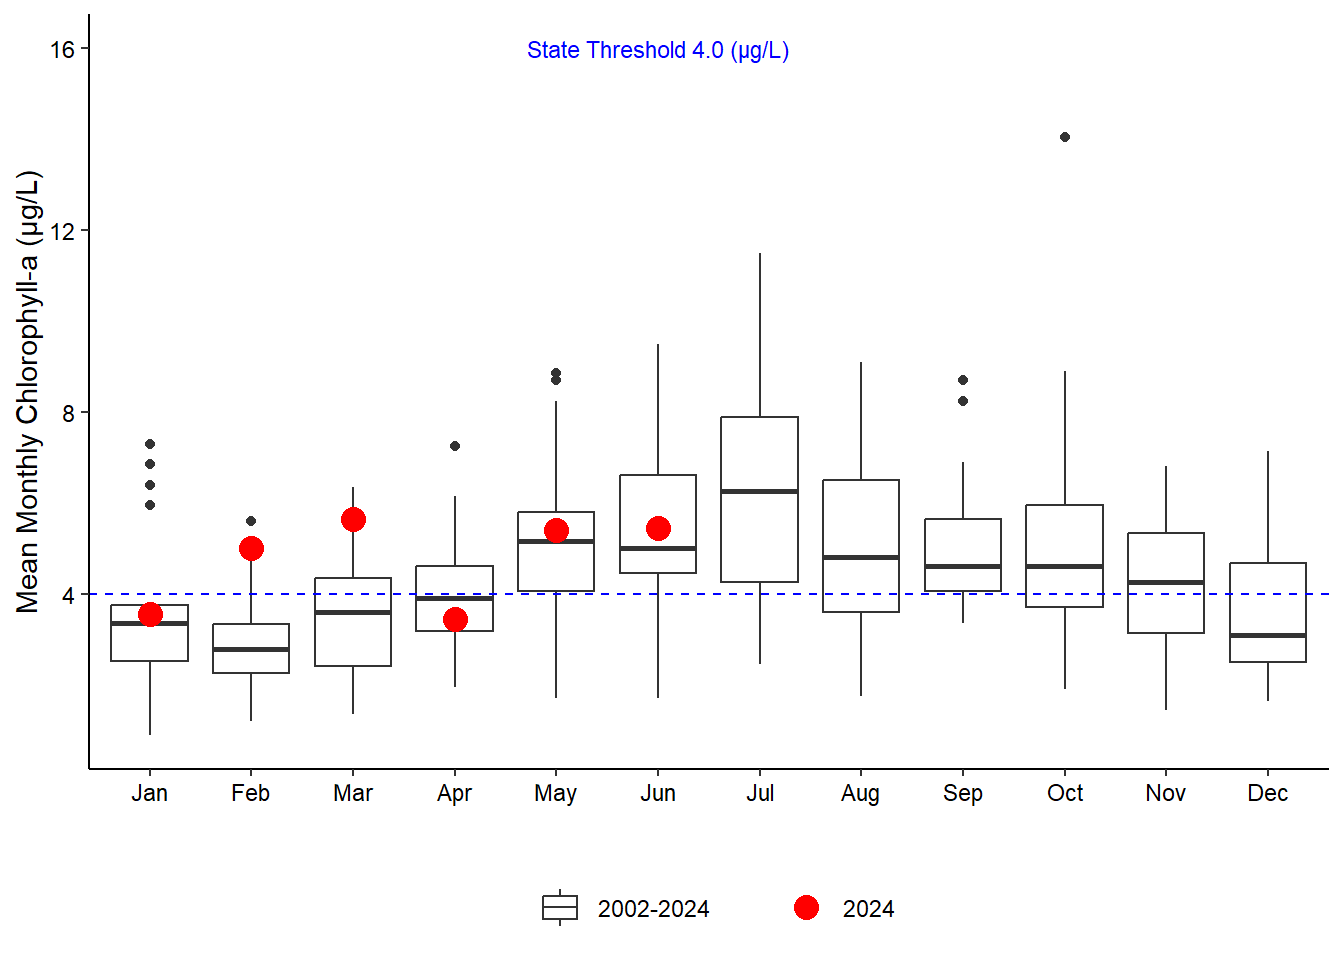
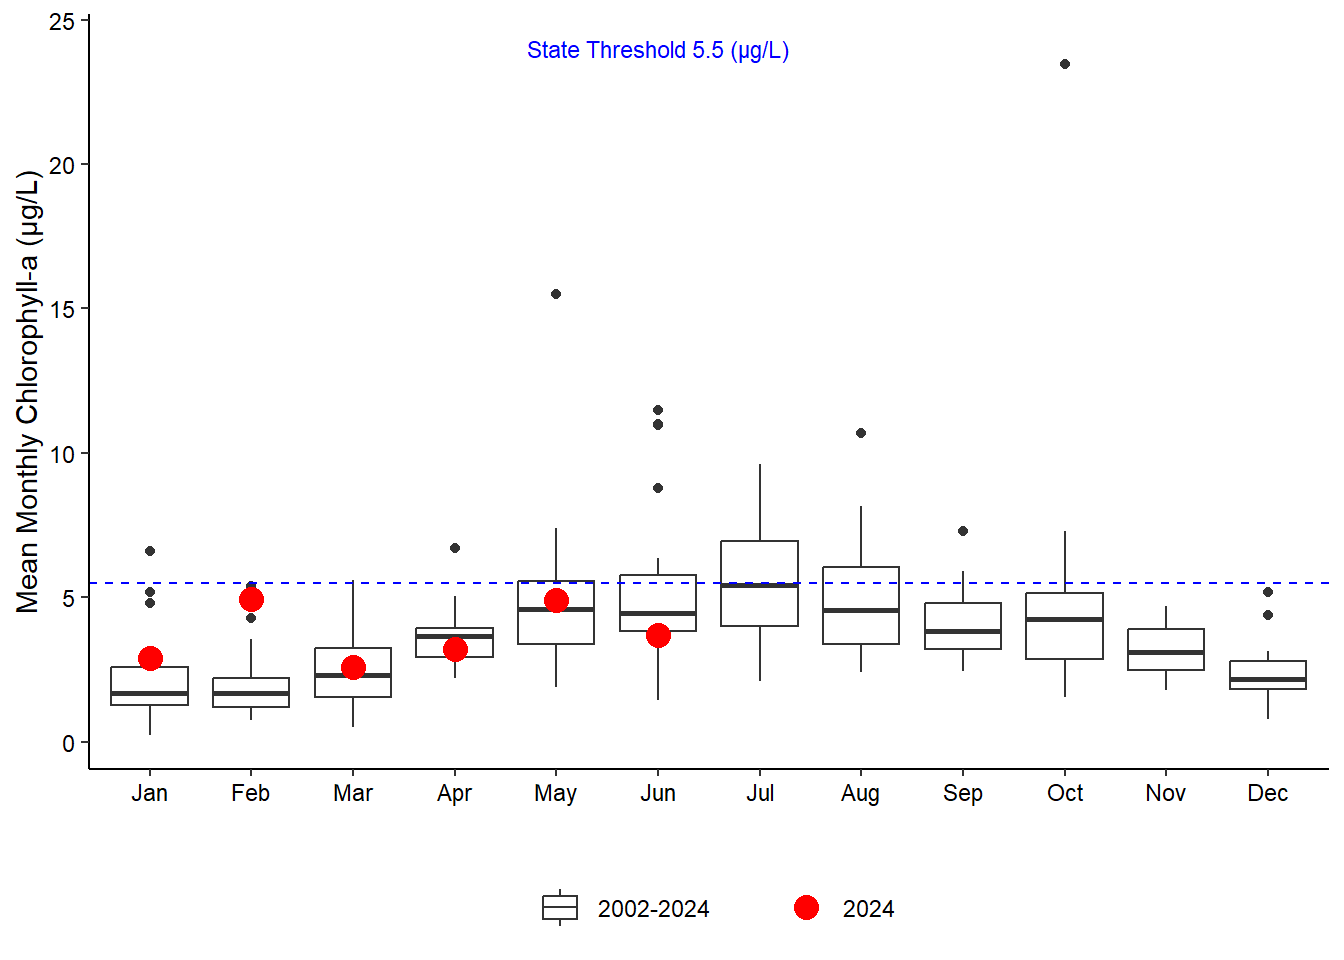
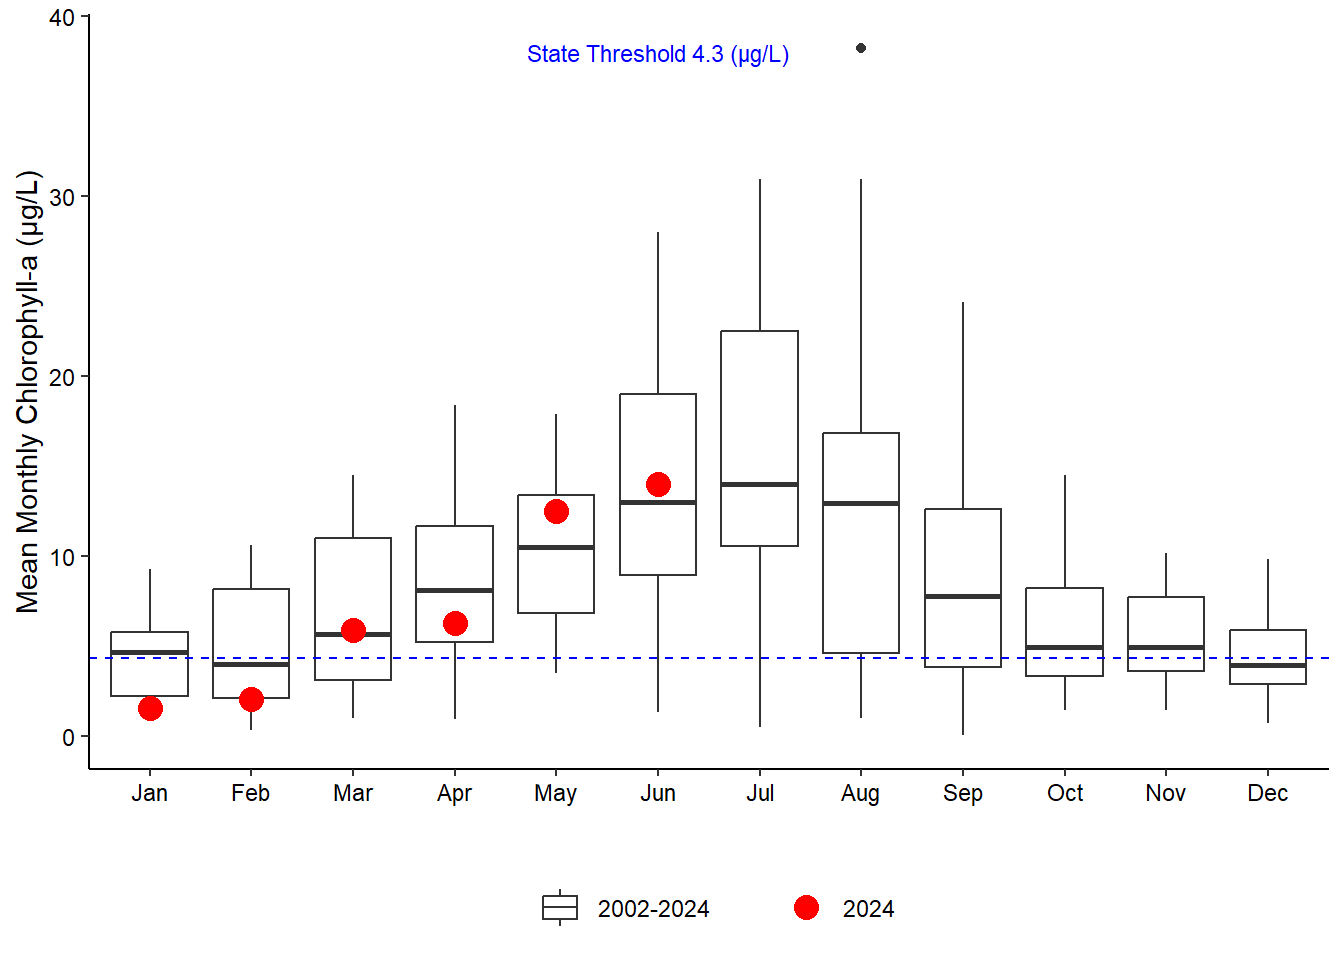
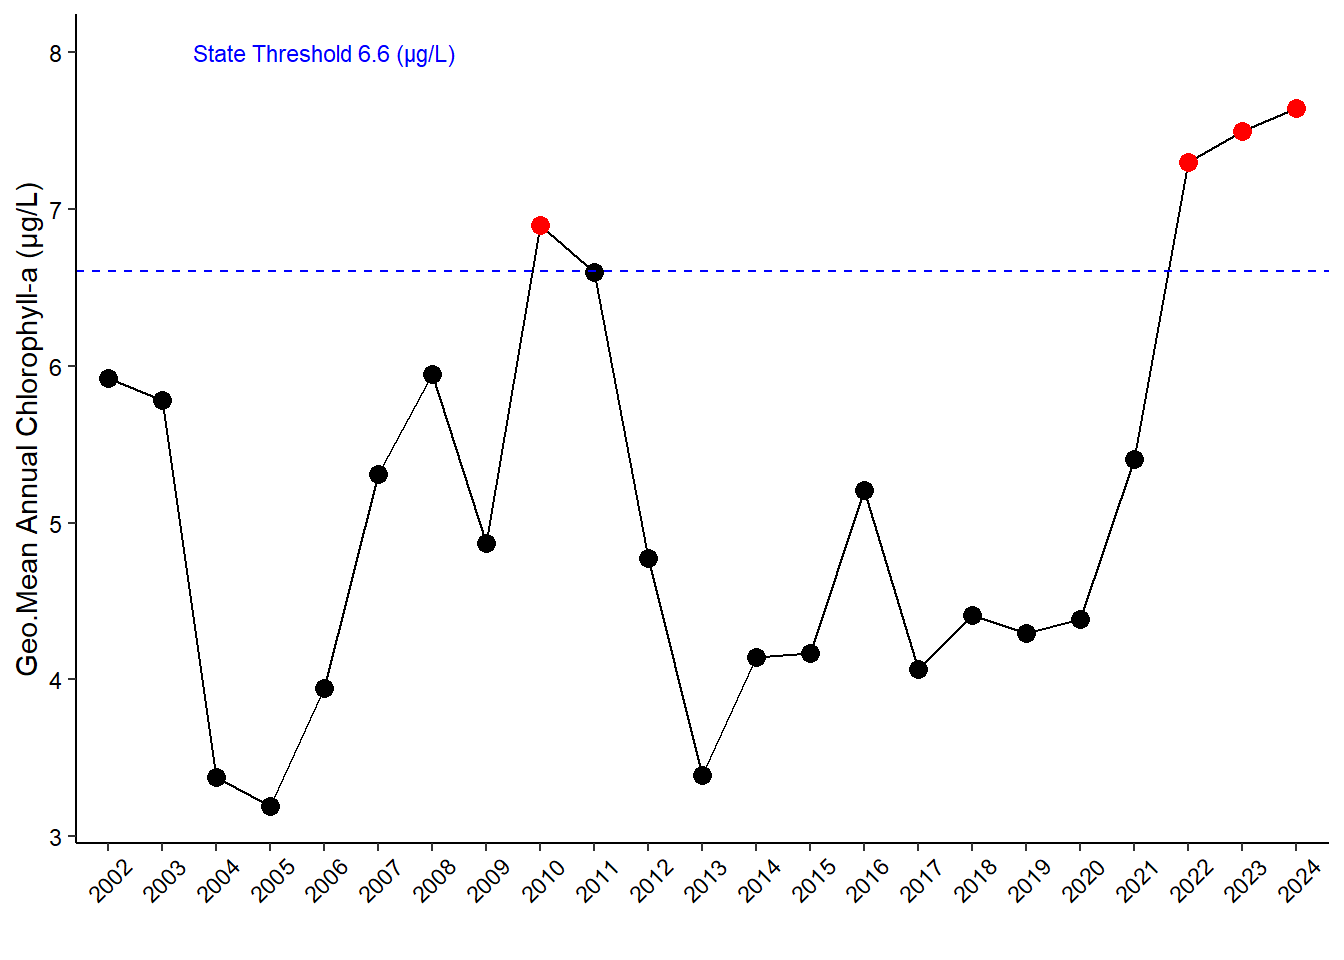
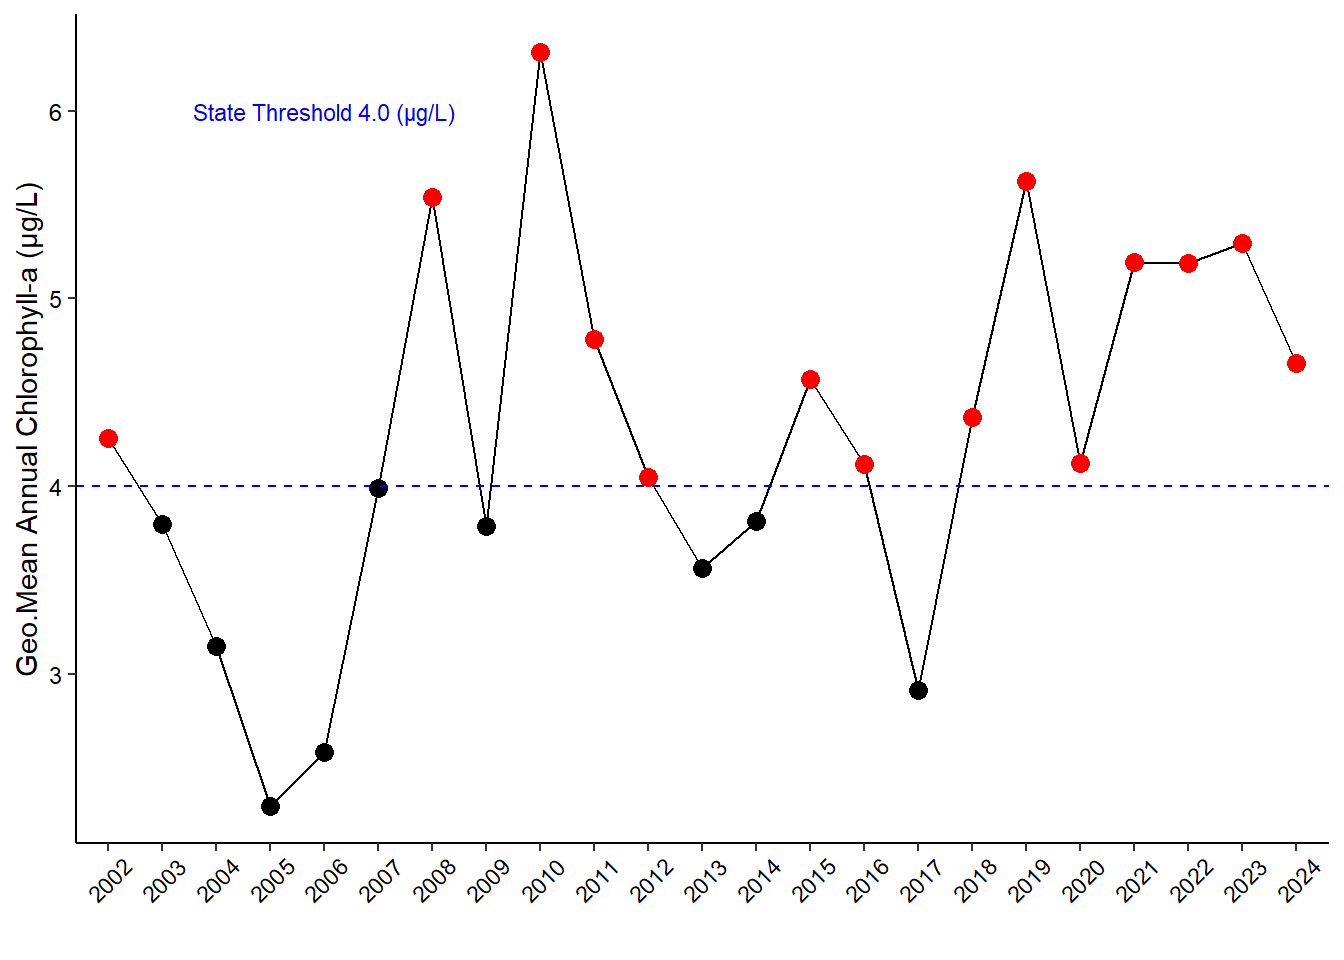
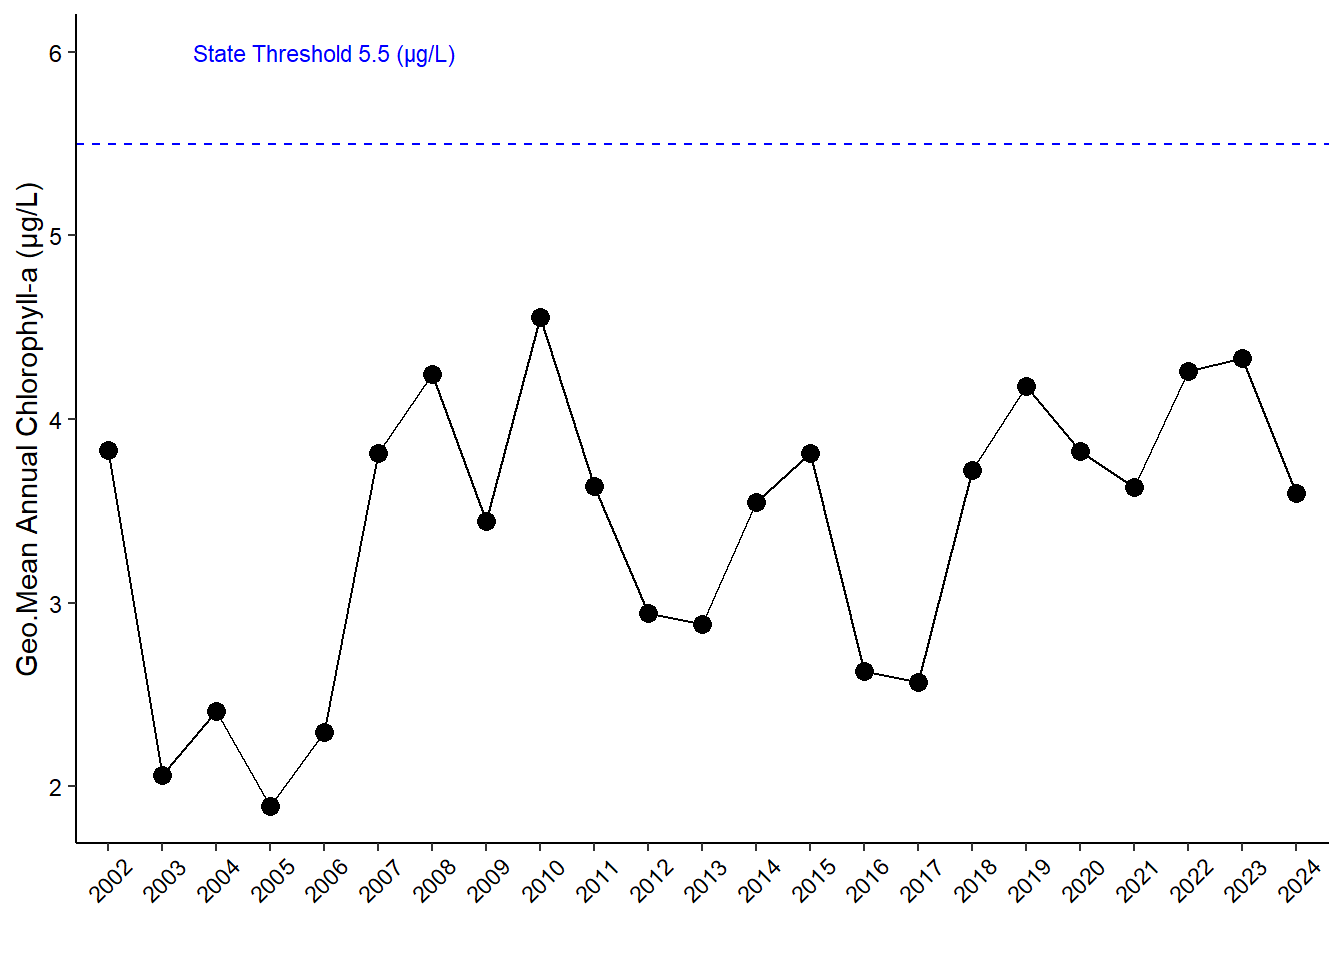
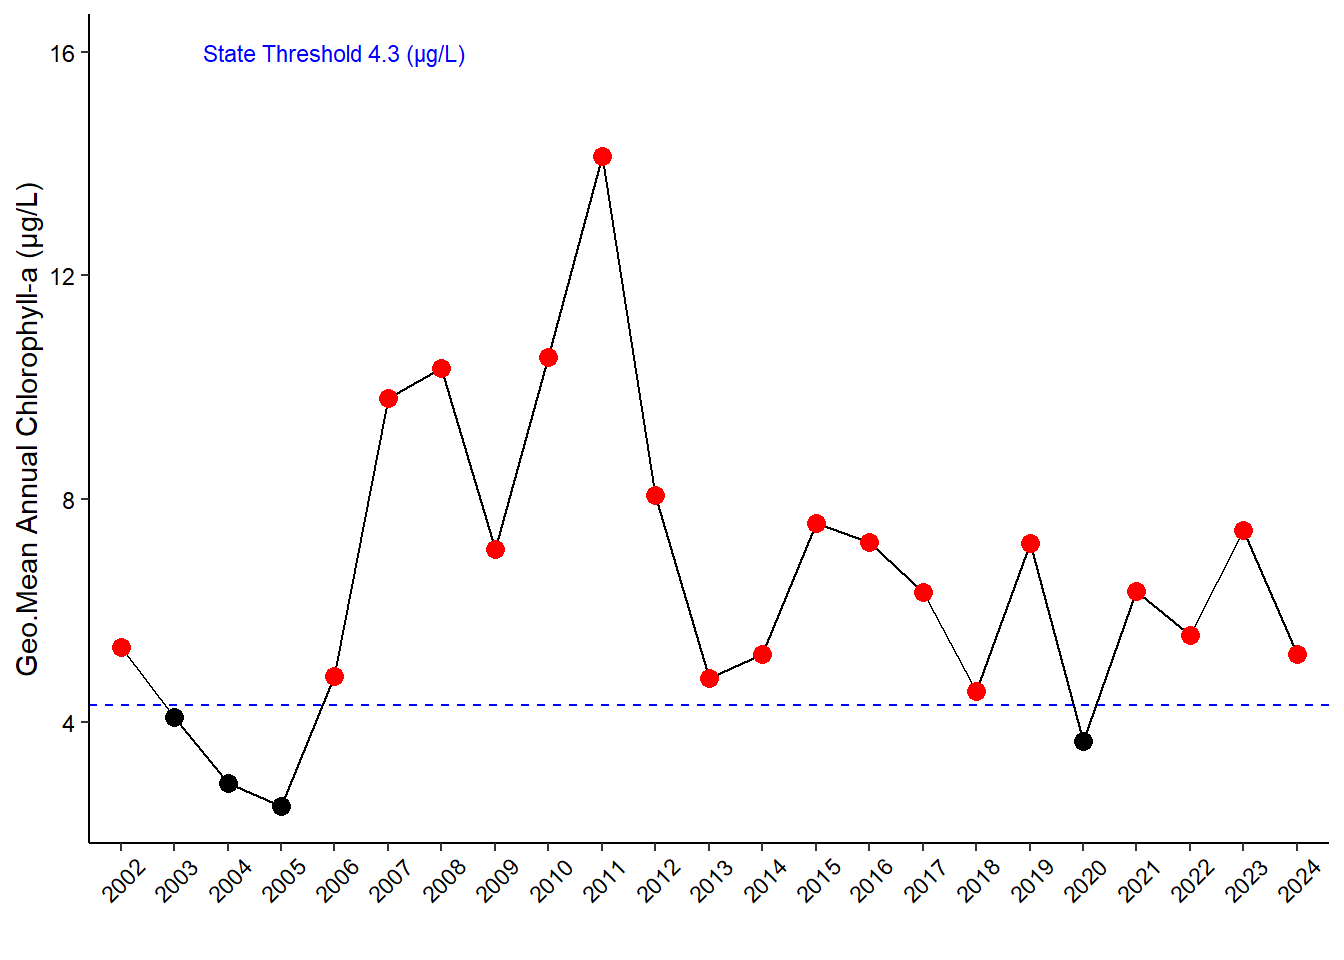
Chlorophyll a values were often higher than average at all stations this year, especially at Pine Island, San Sebastian, and Pellicer Creek (Figure 5.4). Annual geometric mean (AGM) chlorophyll a values were high and above the state threshold levels at all stations, except for Fort Matanzas (Figure 5.4). Annual geometric mean (AGM) chlorophyll a values were high and above the state threshold levels at all stations, except for Fort Matanzas (Figure 5.5), (Figure 5.5 (c)). The AGM will likely change for all stations as more data are added throughout the year.
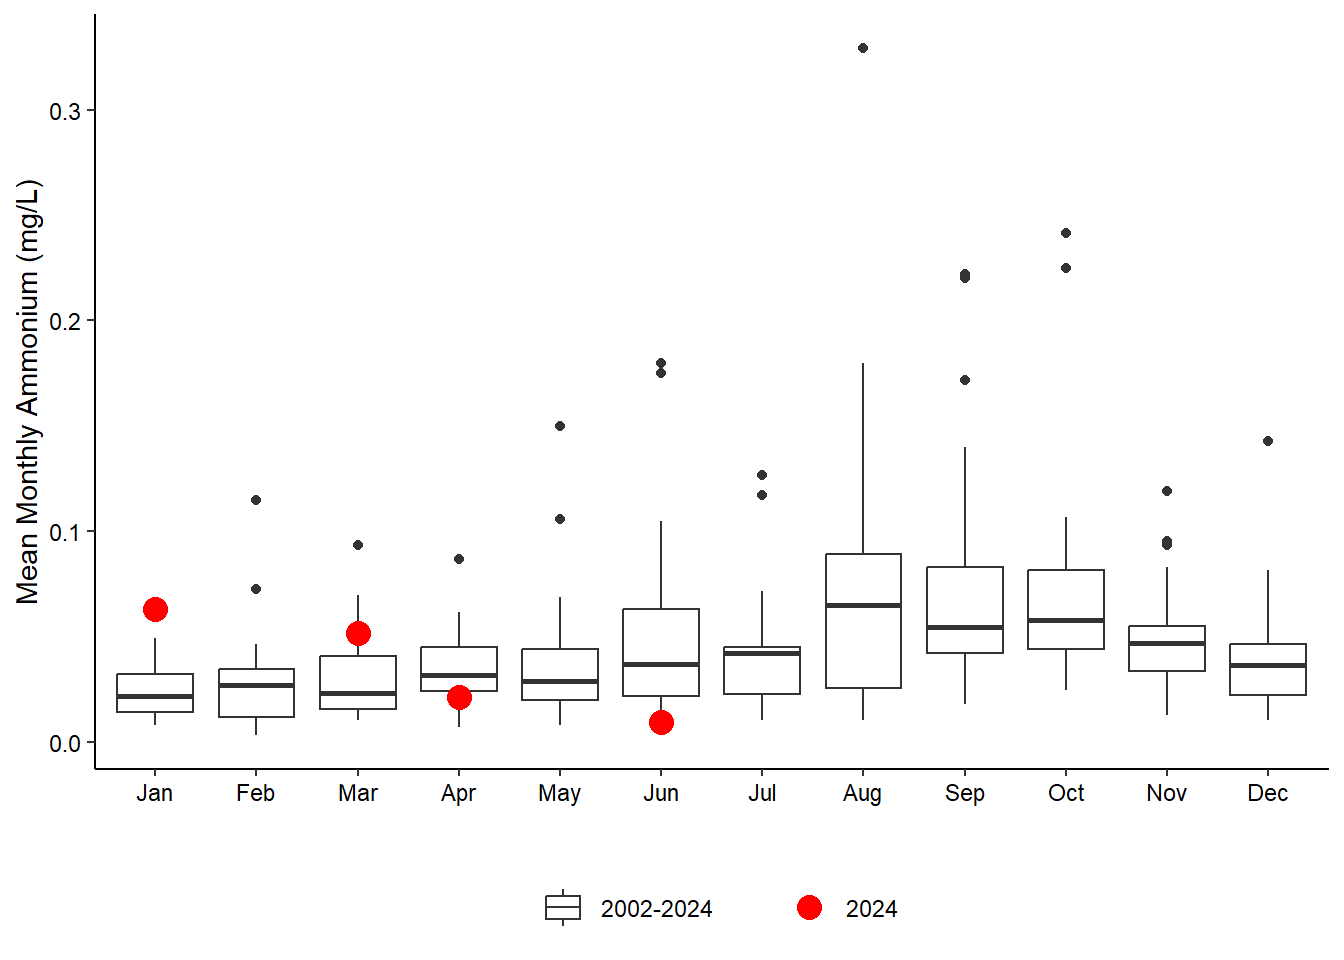
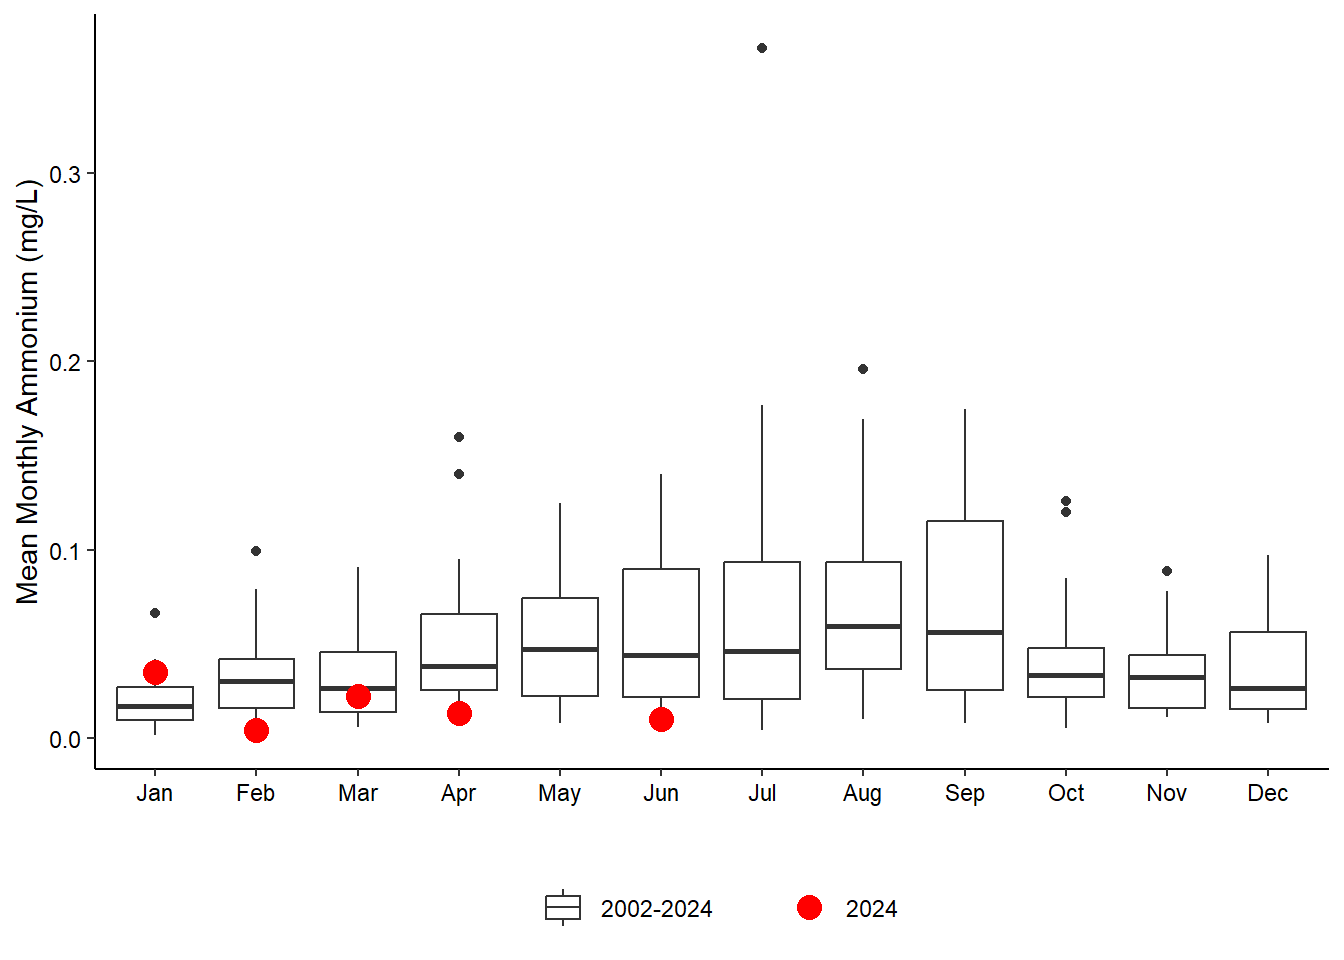
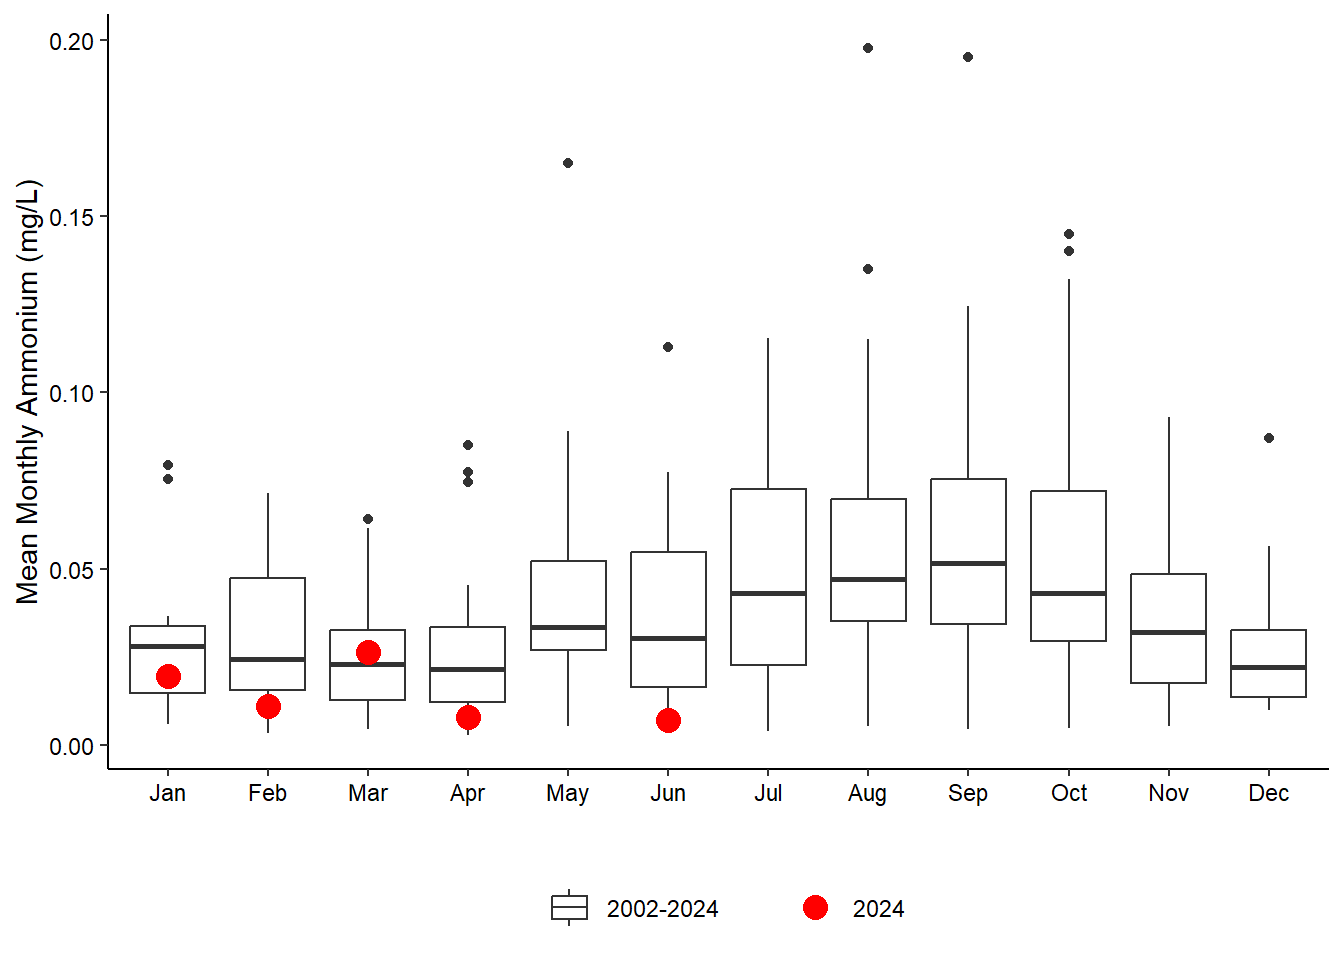
Ammonium (NH4) concentrations for 2024 were below monthly means most of year at all four stations (Figure 5.7). Concentrations were above average at the two southern sites, Fort Matanzas and Pellicer Creek in September (Figure 5.7 (c); Figure 5.7 (d)) but were below average at Pine Island and San Sebastian (Figure 5.7 (a); Figure 5.7 (b)).
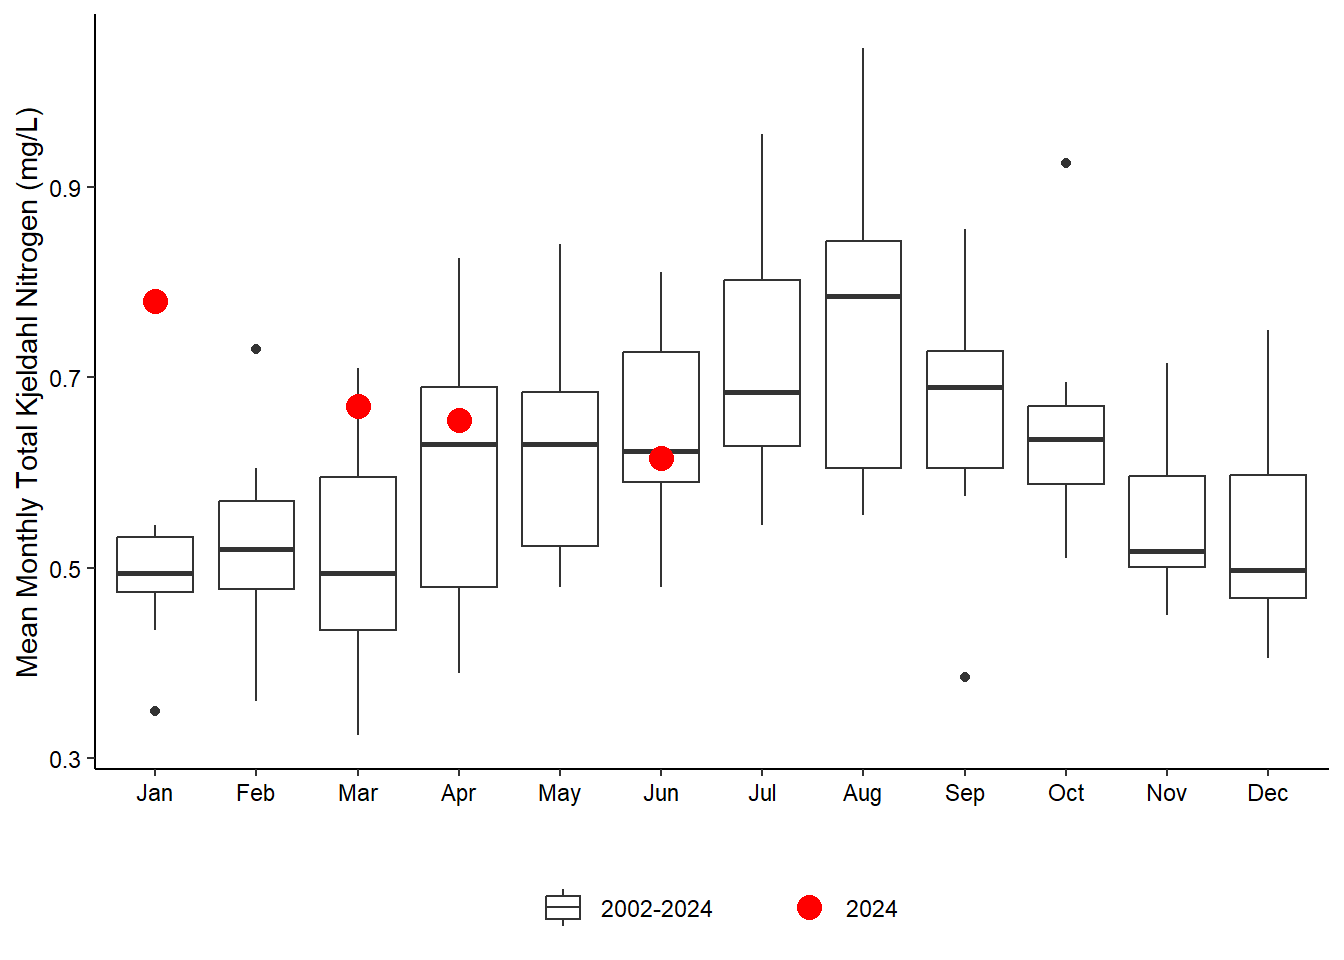
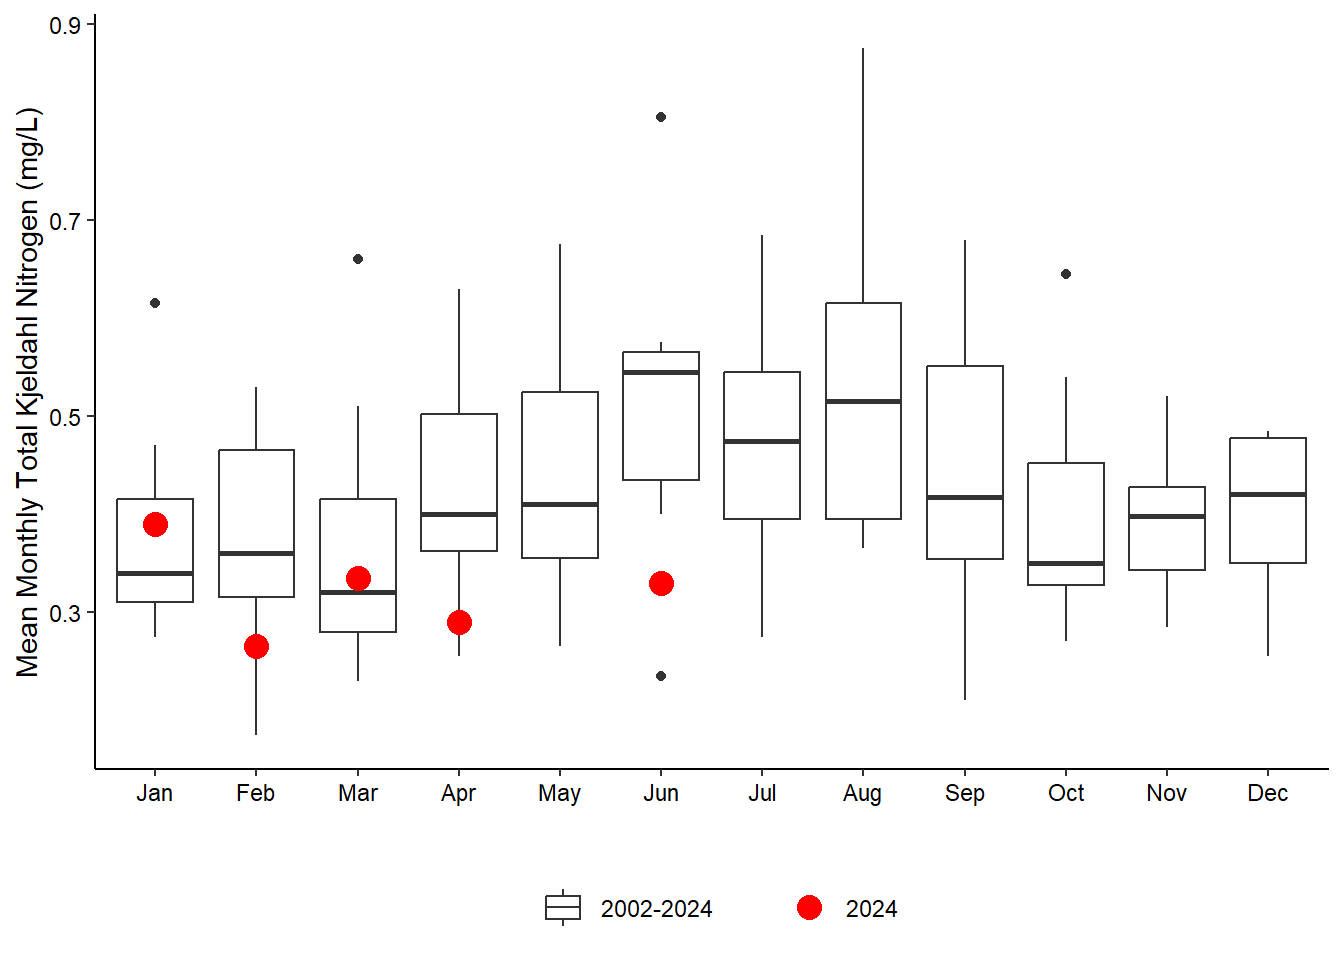
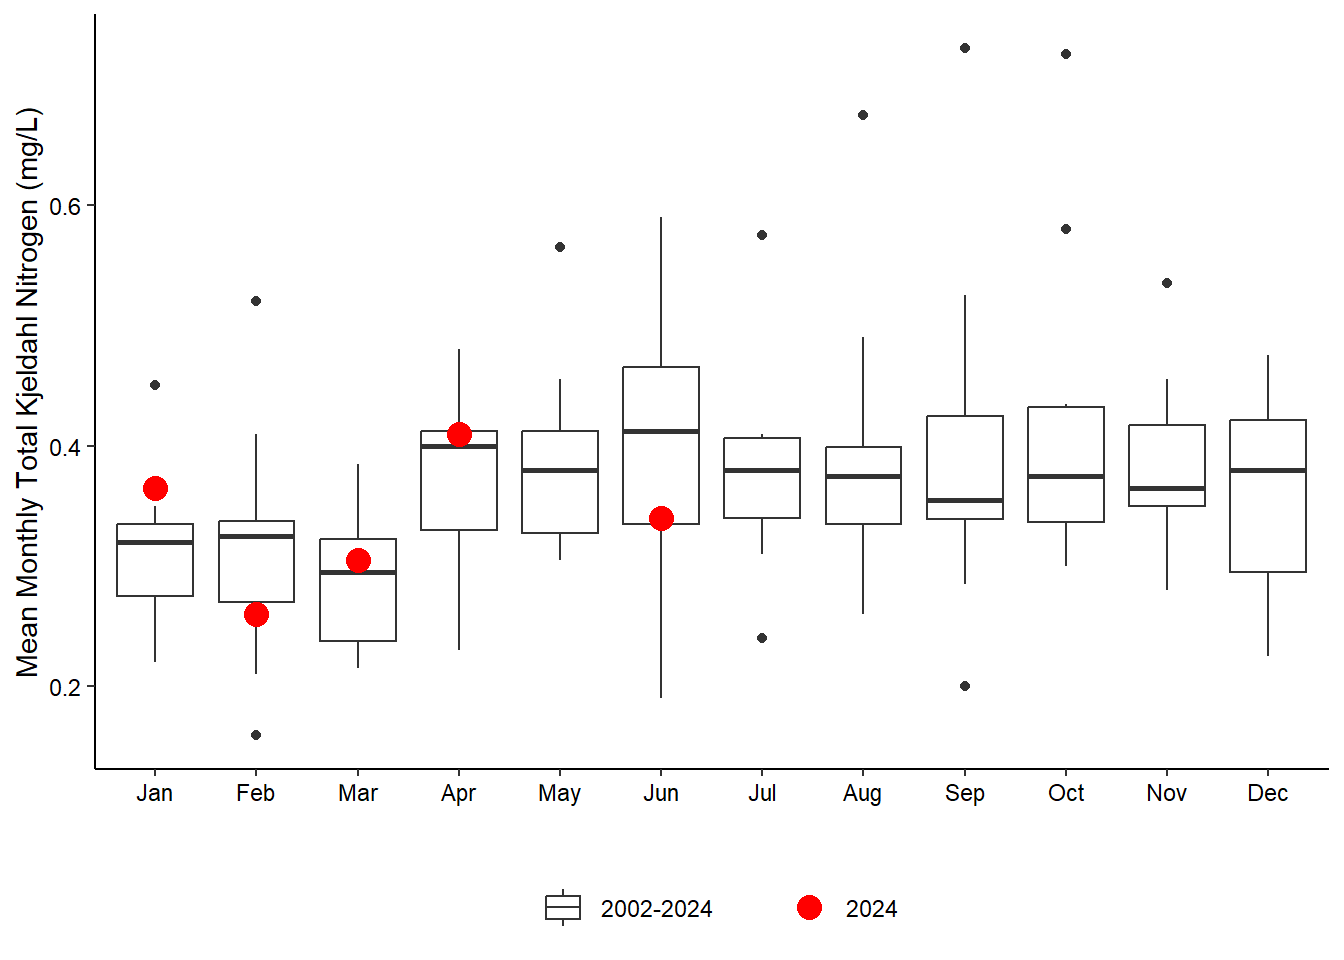
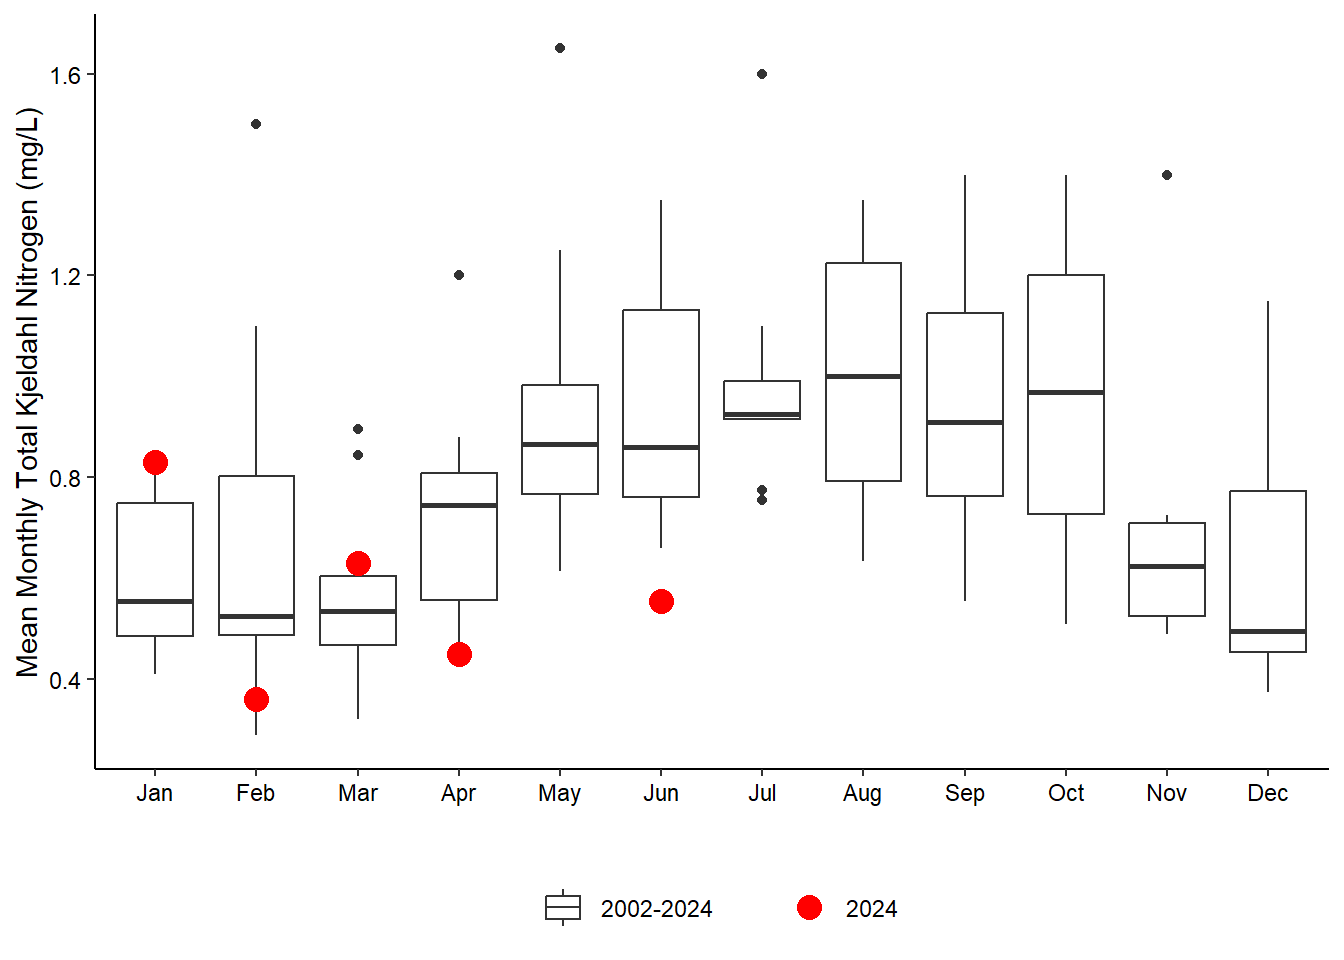
Total Kjeldahl Nitrogen (TKN) concentrations were higher than average at all stations in January and March, but concentrations were lower most of Q2 and Q3 (Figure 5.9). Concentrations in September were above average for Fort Matanzas and Pellicer Creek (Figure 5.9 (c); Figure 5.9 (d))
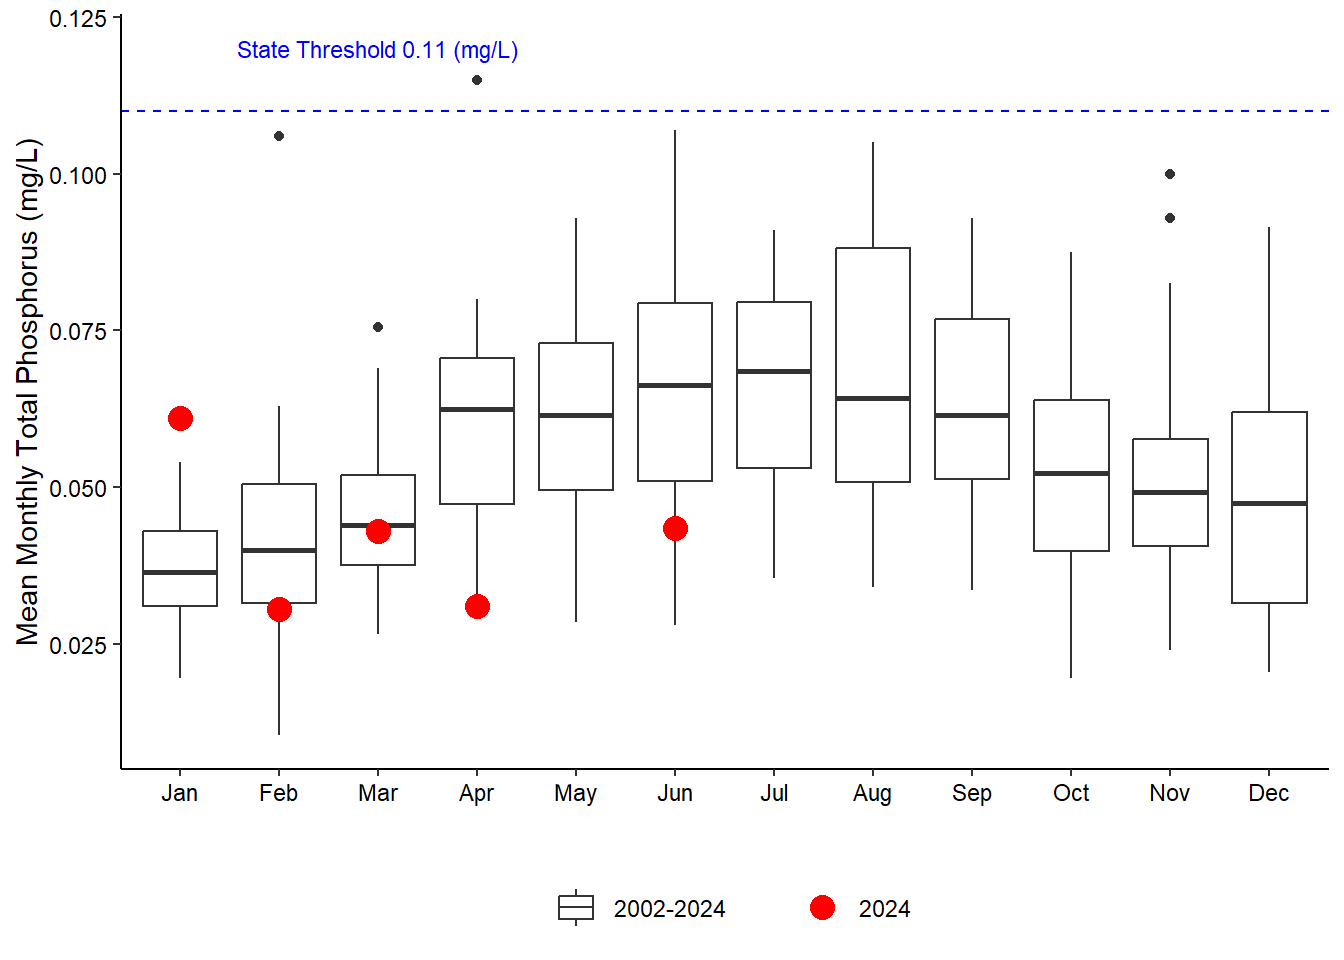
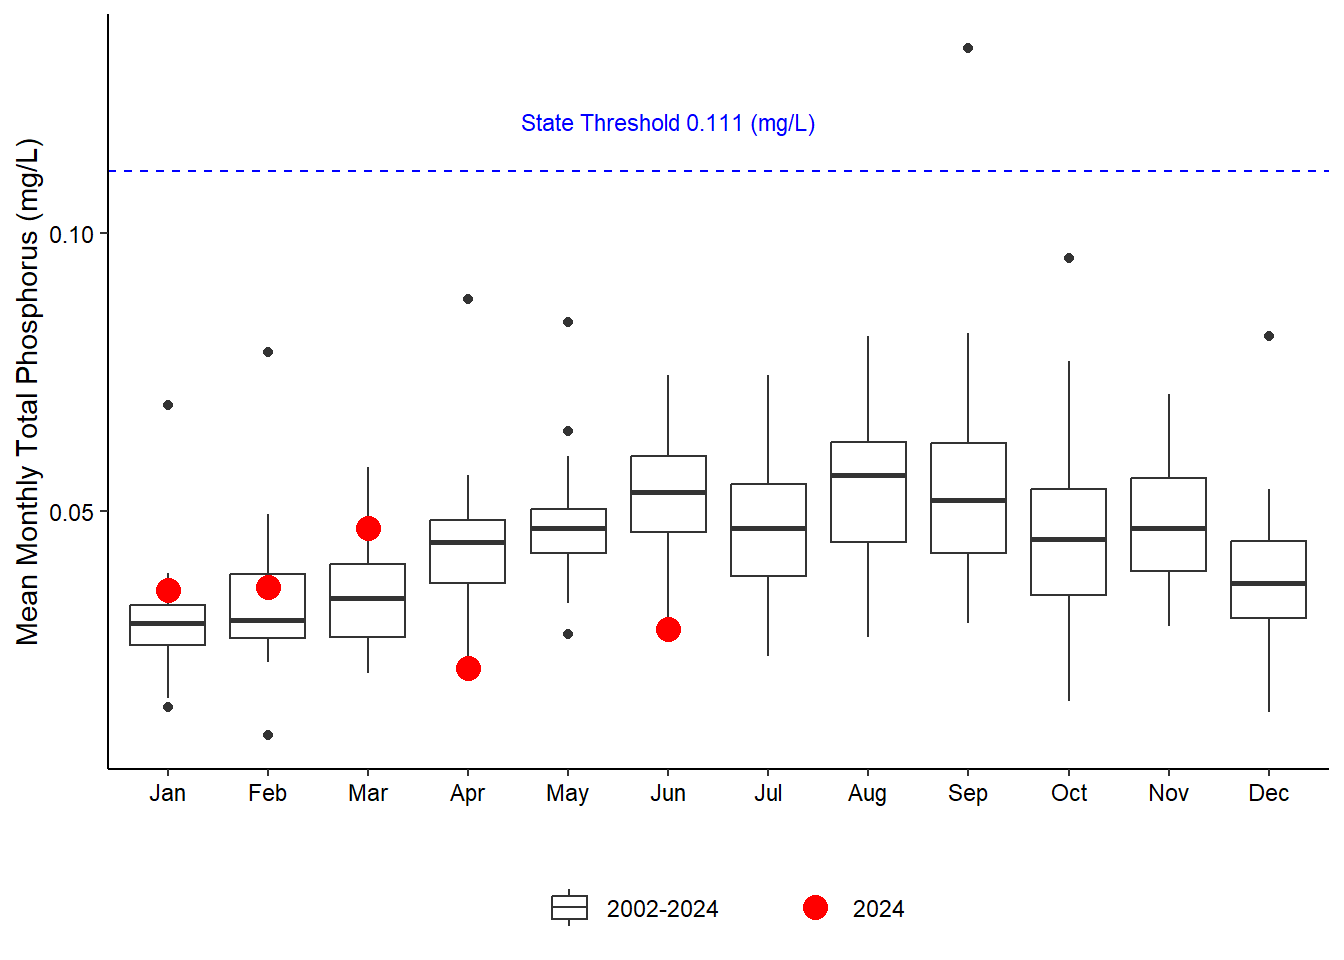
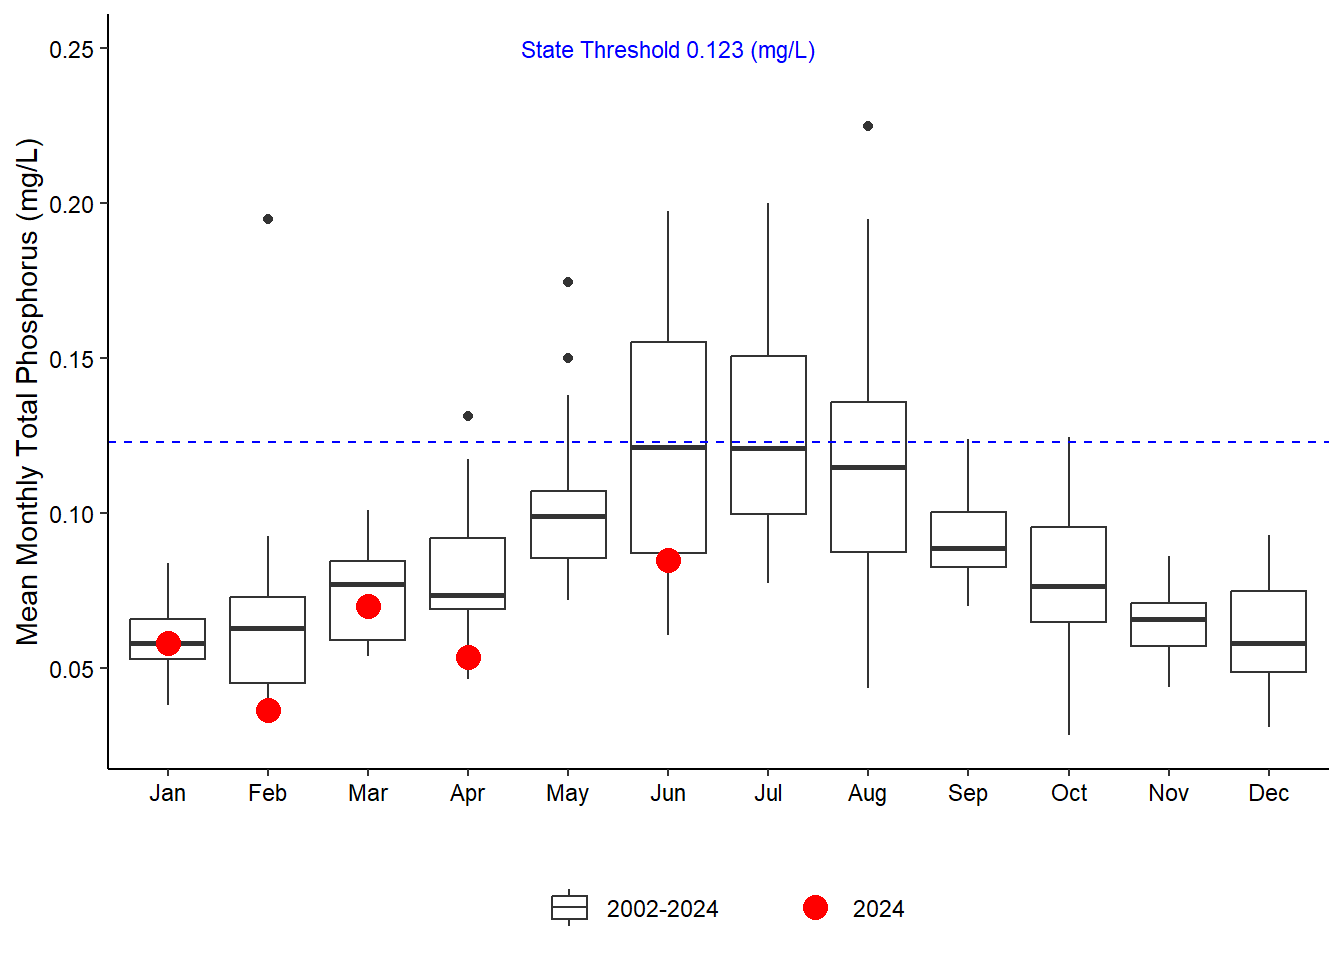
Total phosphorus concentrations were below the state threshold at all stations in 2024 with the exception of February at Pine Island which was missing data (Figure 5.10). Fort Matanzas experienced higher than average TP values for January – March and July (Figure 5.10 (c)) and San Sebastian had lower than average TP values for February – September.
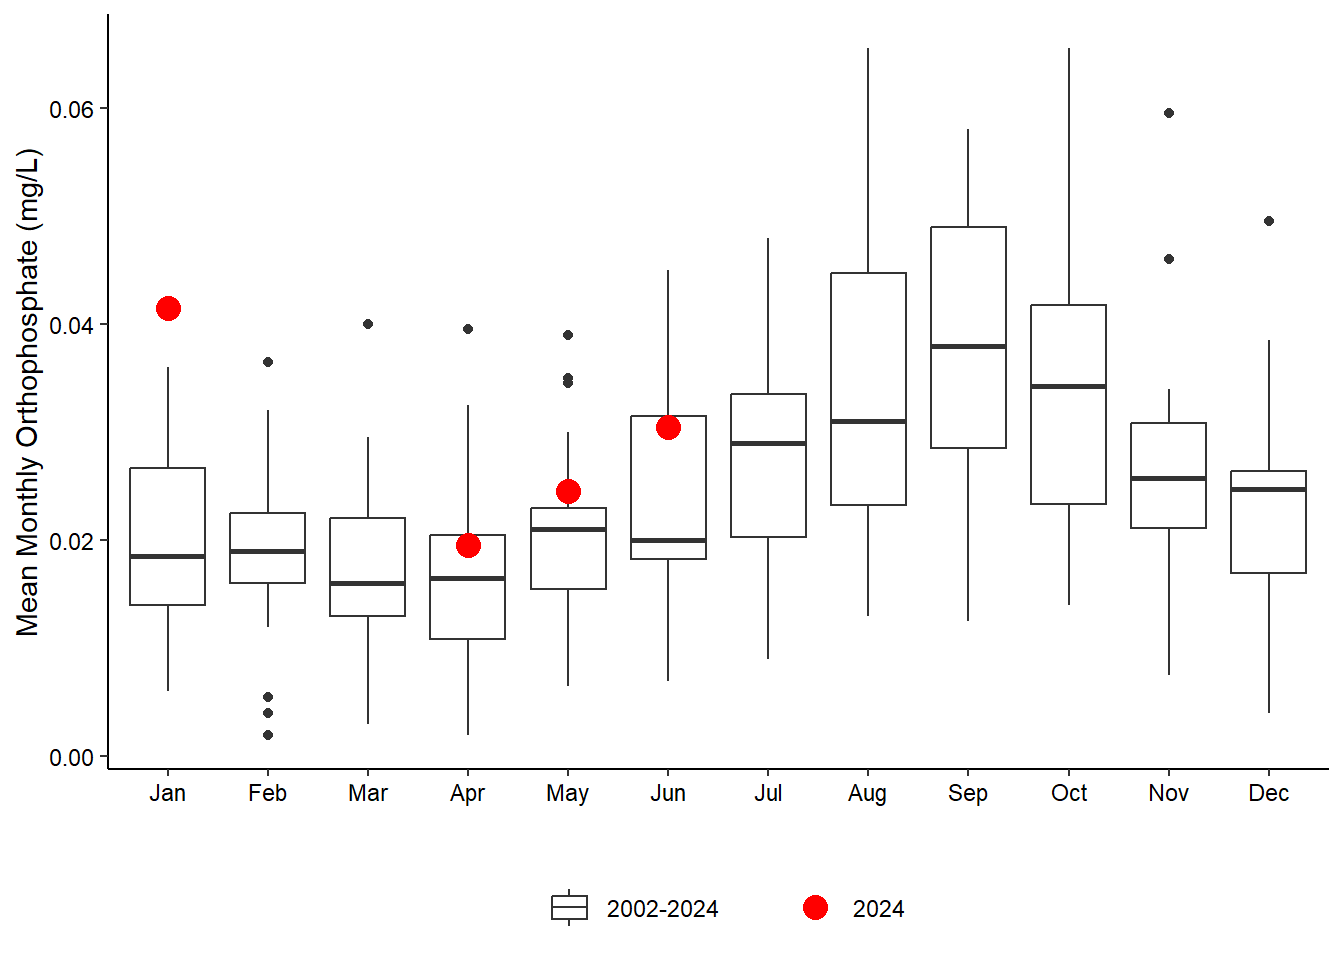
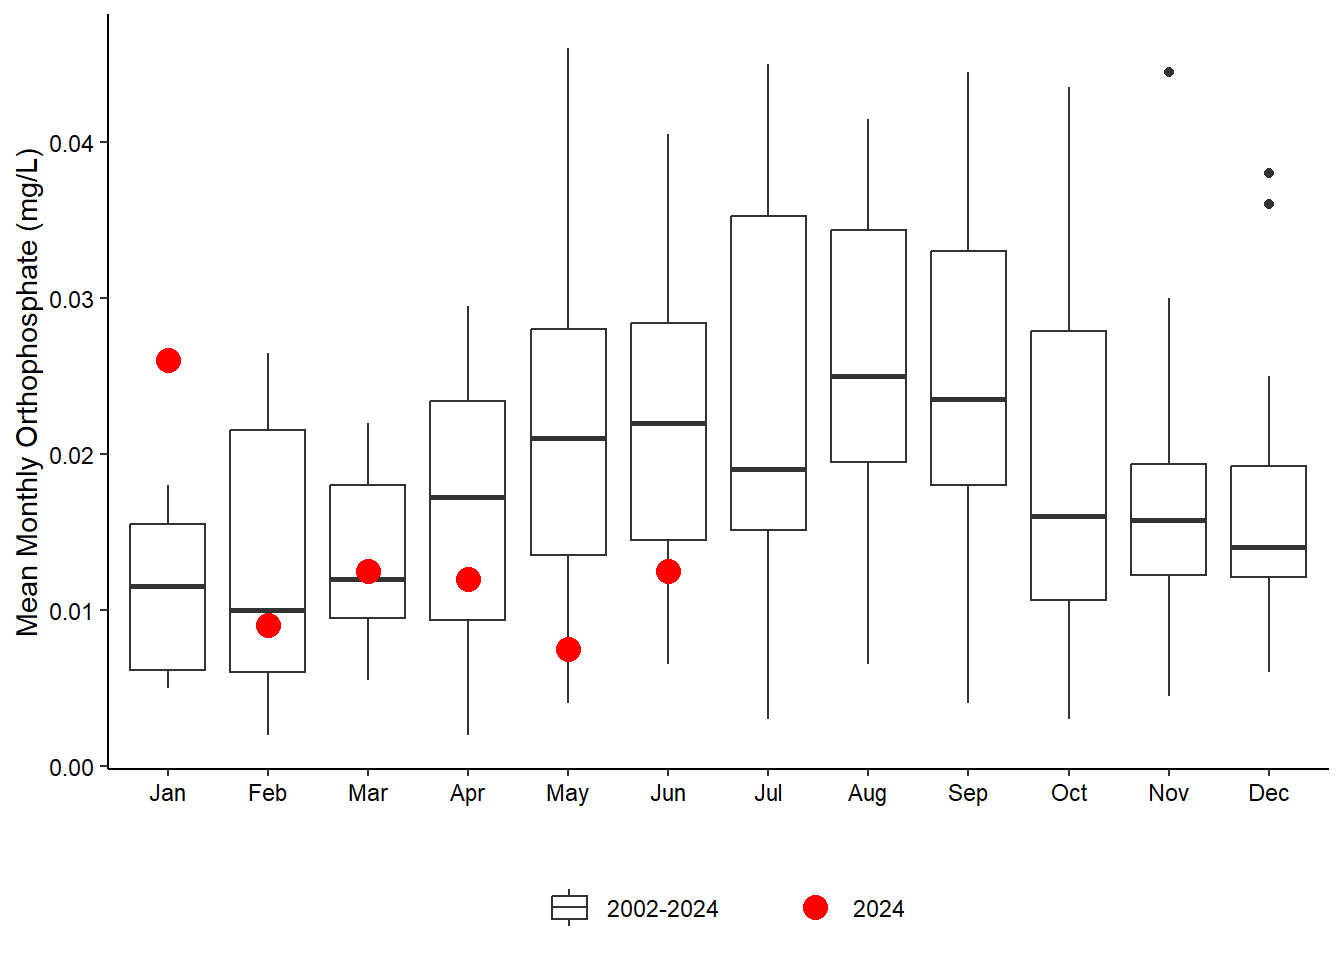
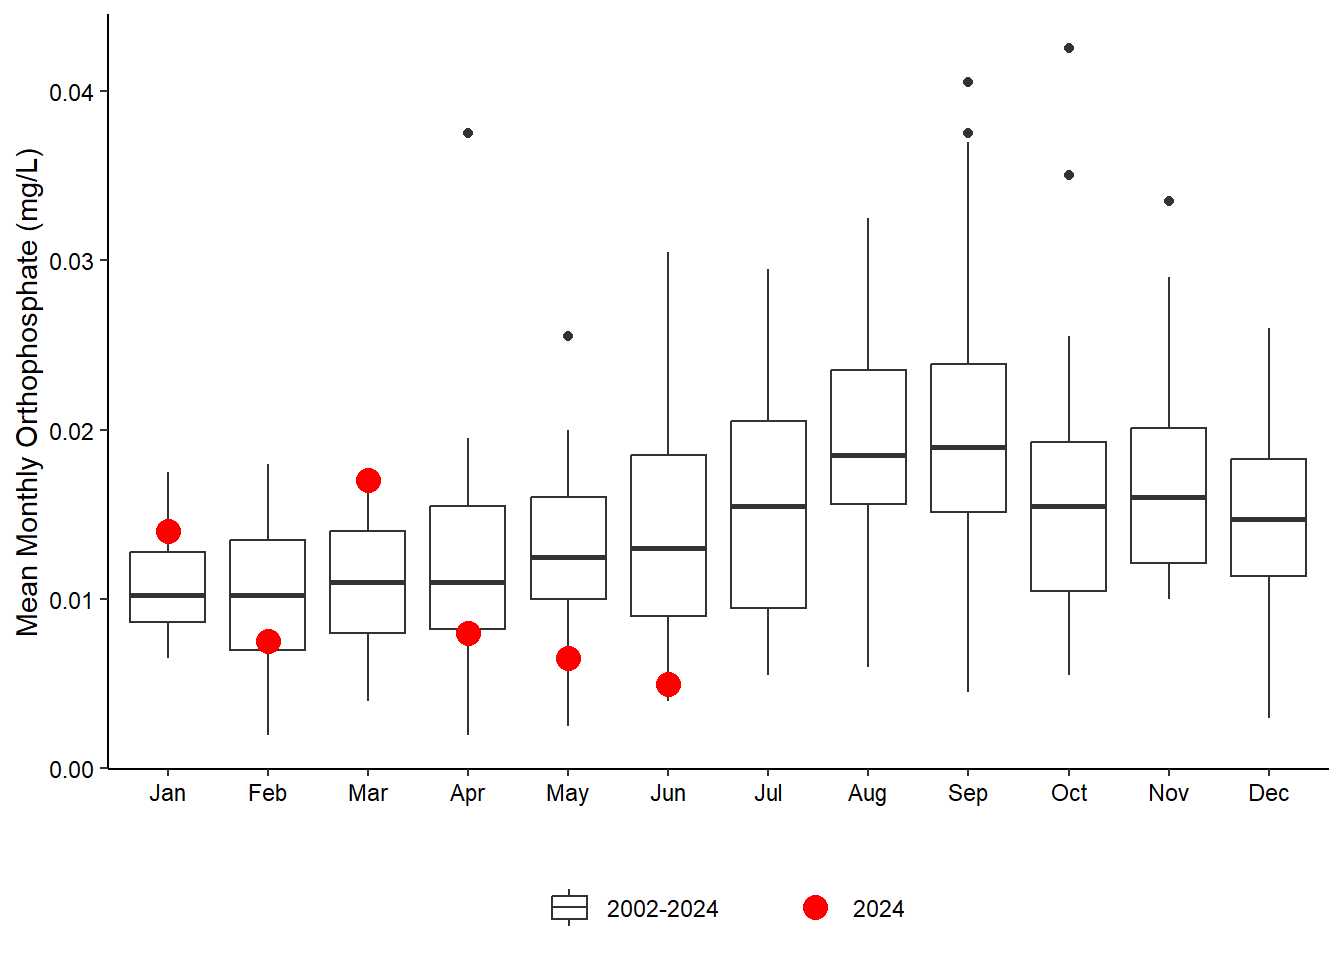
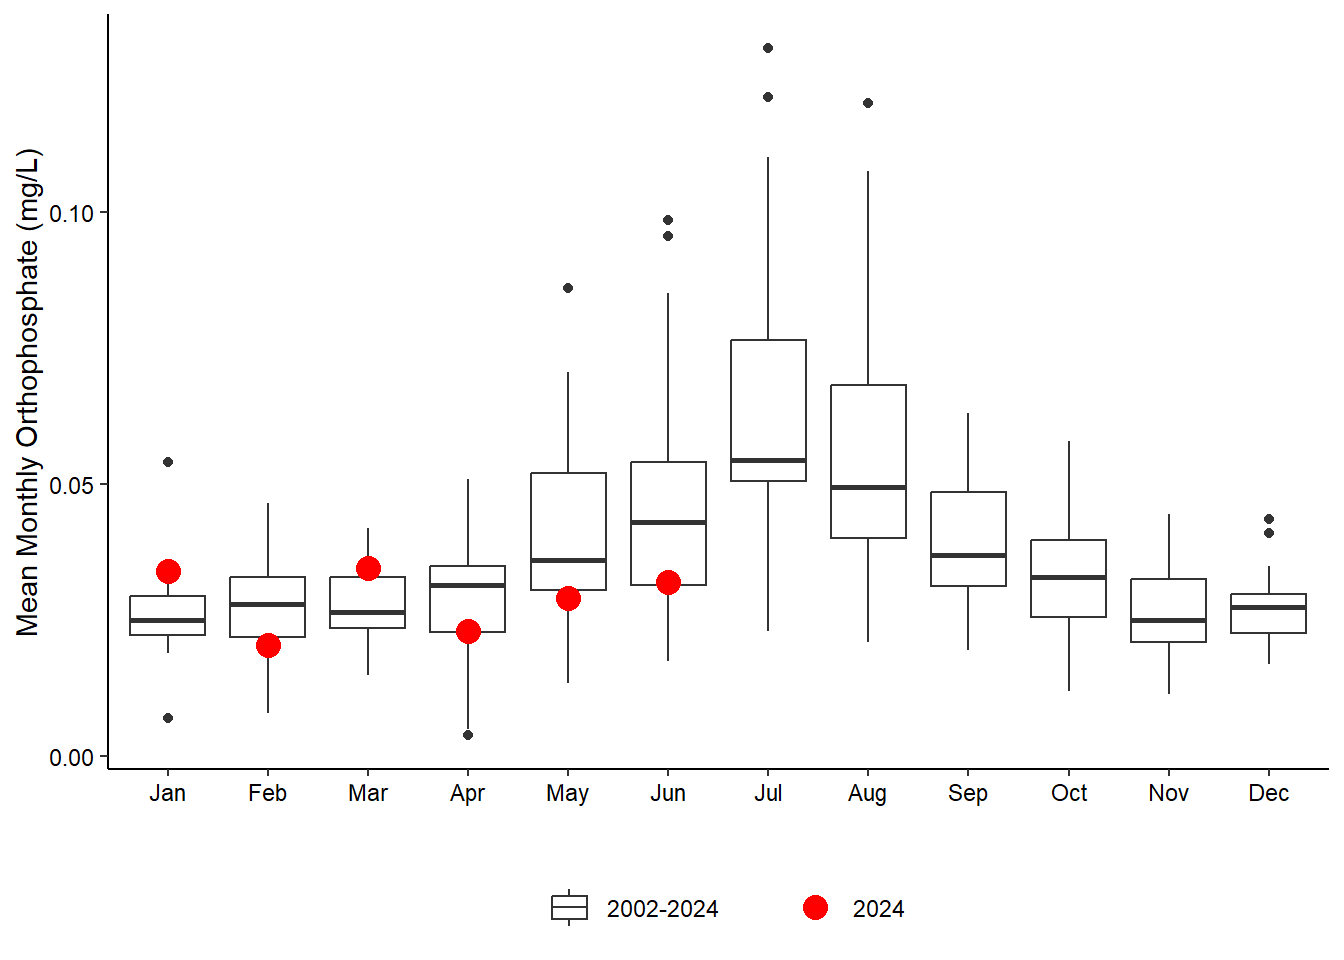
Relatively high levels of orthophosphate were observed at Pine Island and San Sebastian in January (Figure 5.10 (a), Figure 5.10 (b)) and below average levels were found in April – June for San Sebastian, Fort Matanzas, and Pellicer Creek (Figure 5.10 (b), (Figure 5.10 (c)).
5.2 Data
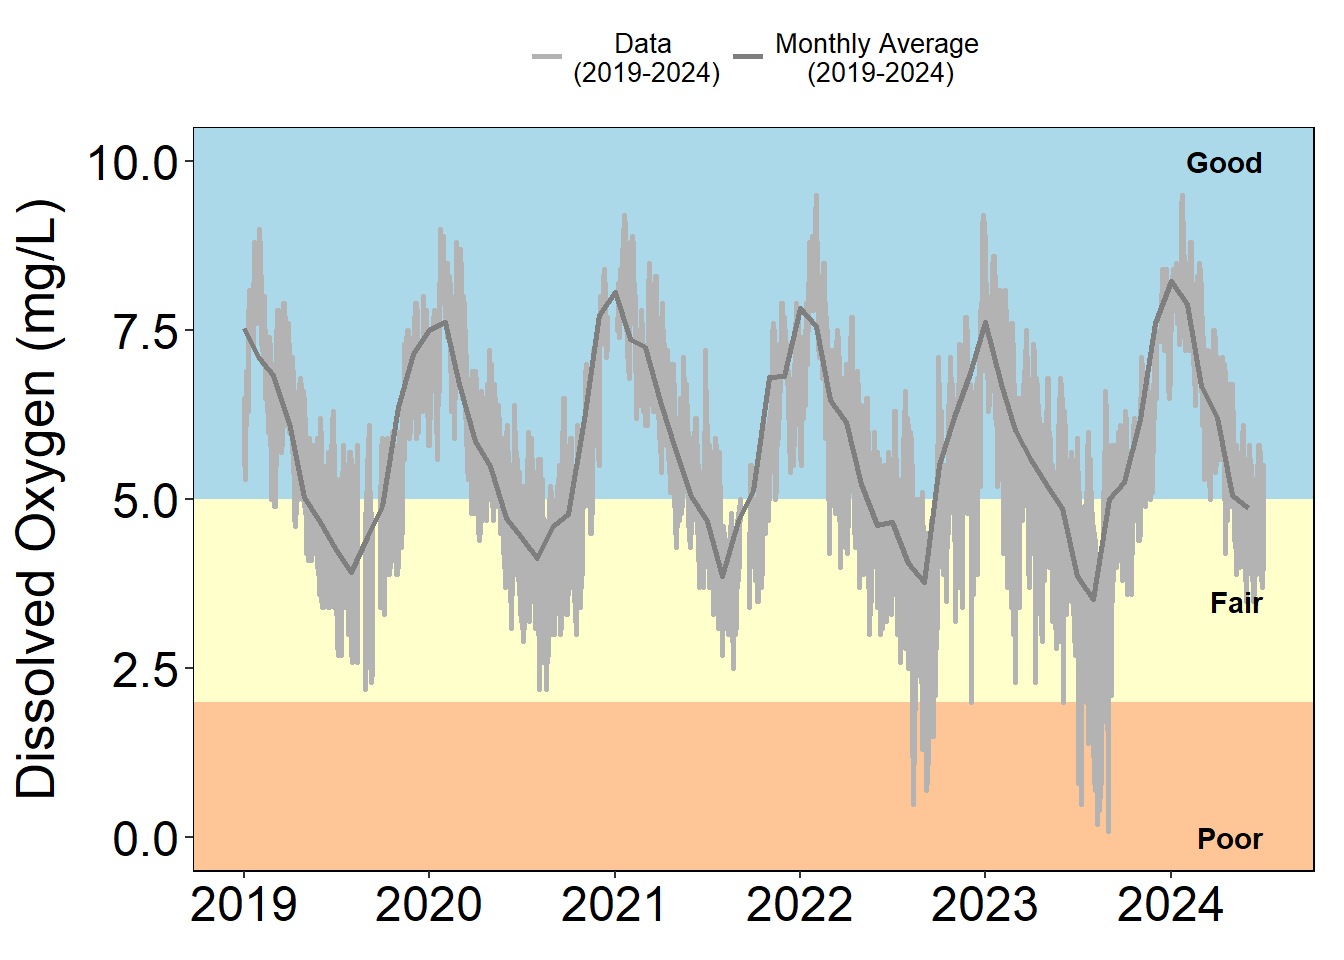
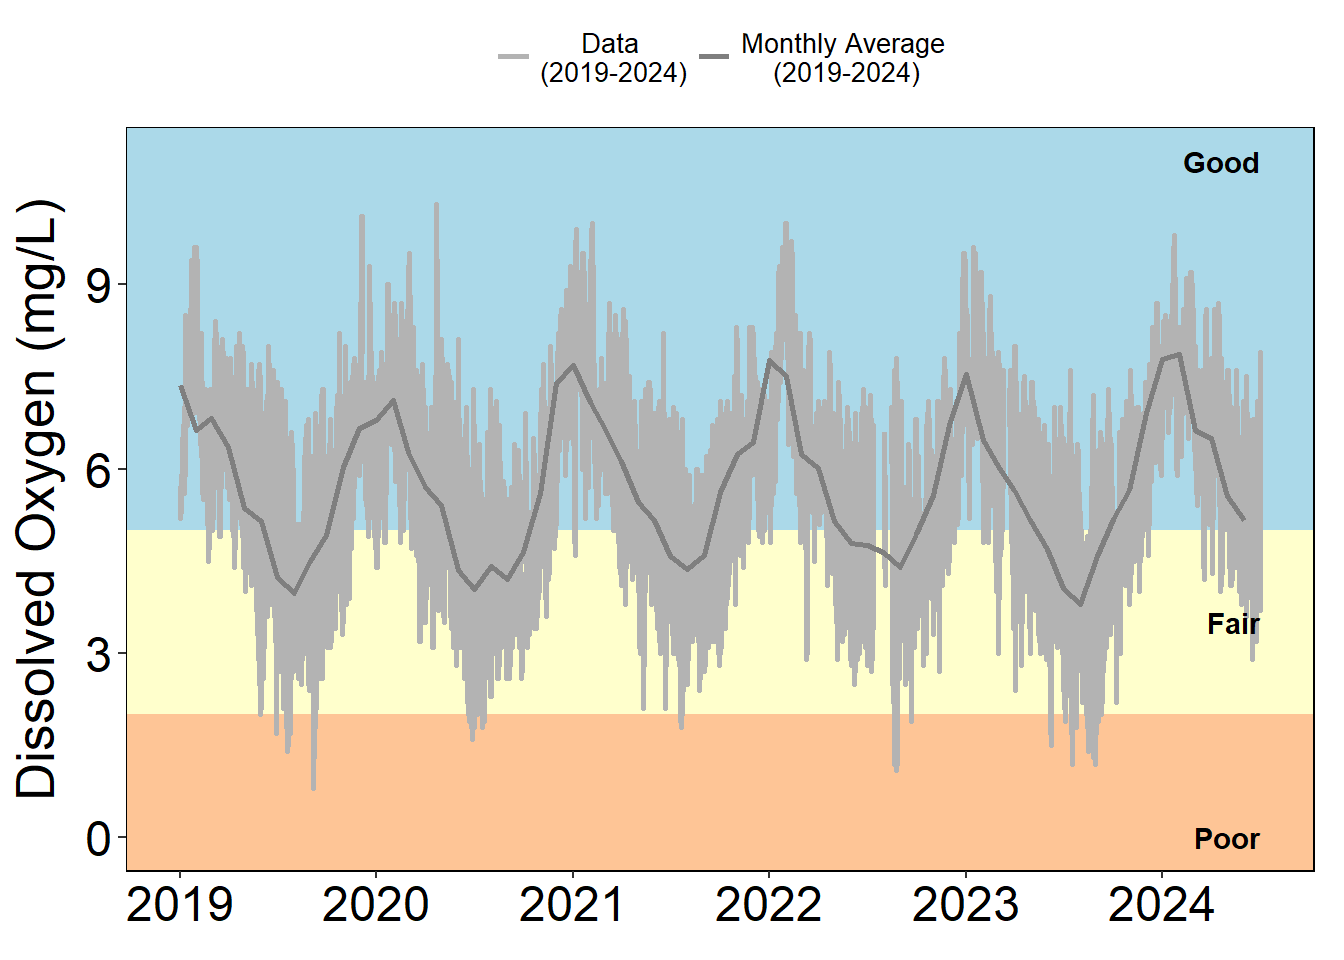
5.2.1 Dissolved Oxygen
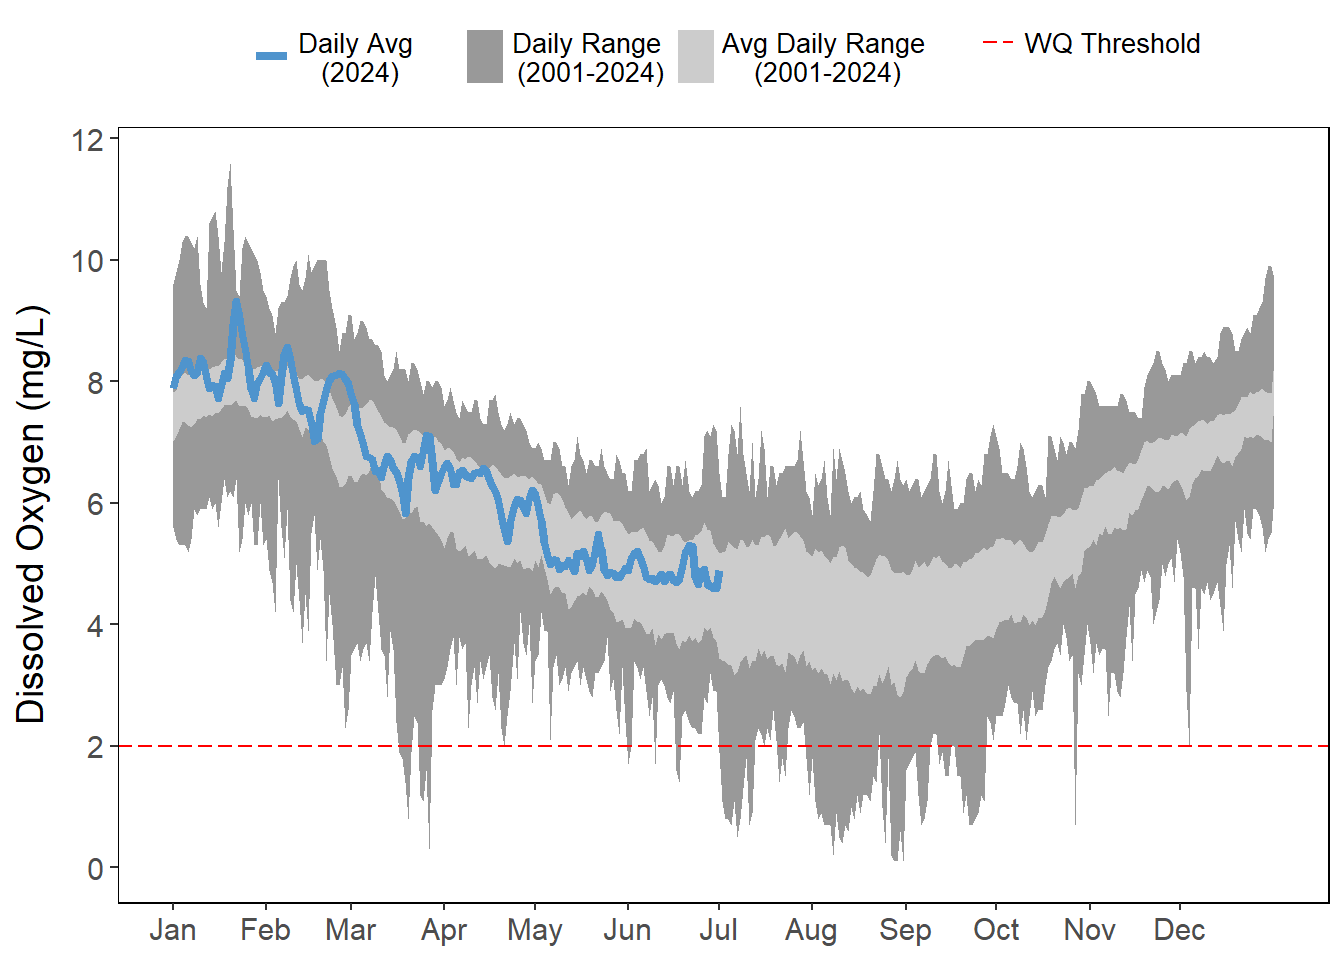
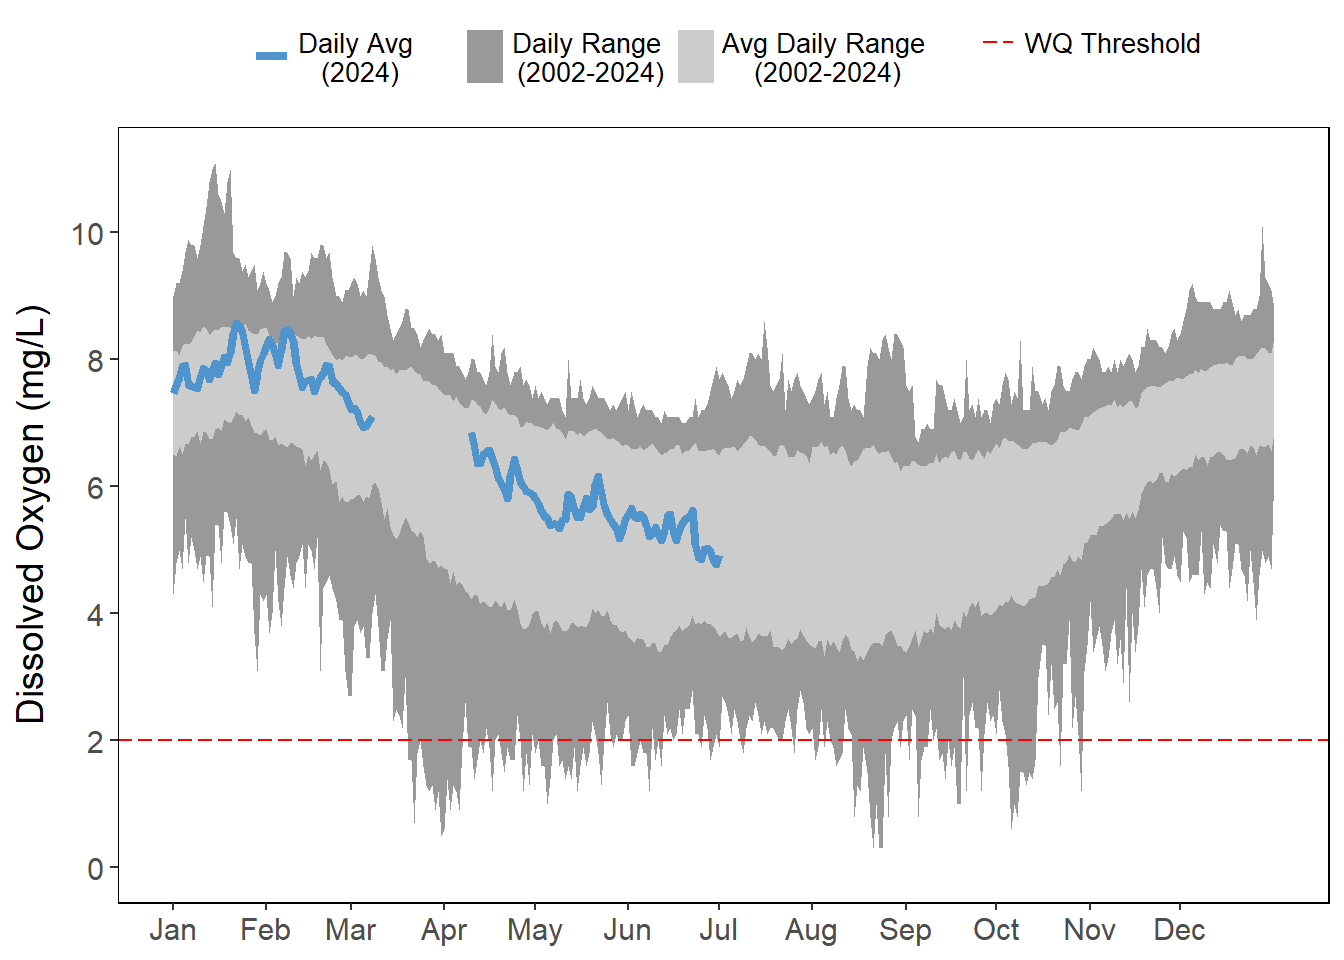
Dissolved oxygen at Pine Island has been uncharacteristically low in the past two years.
Pellicer Creek is located within a waterbody with known impairments for dissolved oxygen, chlorophyll a, and fecal coliform bacteria. As such, this station frequently experiences low dissolved oxygen values, particularly in the summer months (Figure 5.3).
5.2.2 Chlorophyll a
5.2.3 Nitrogen
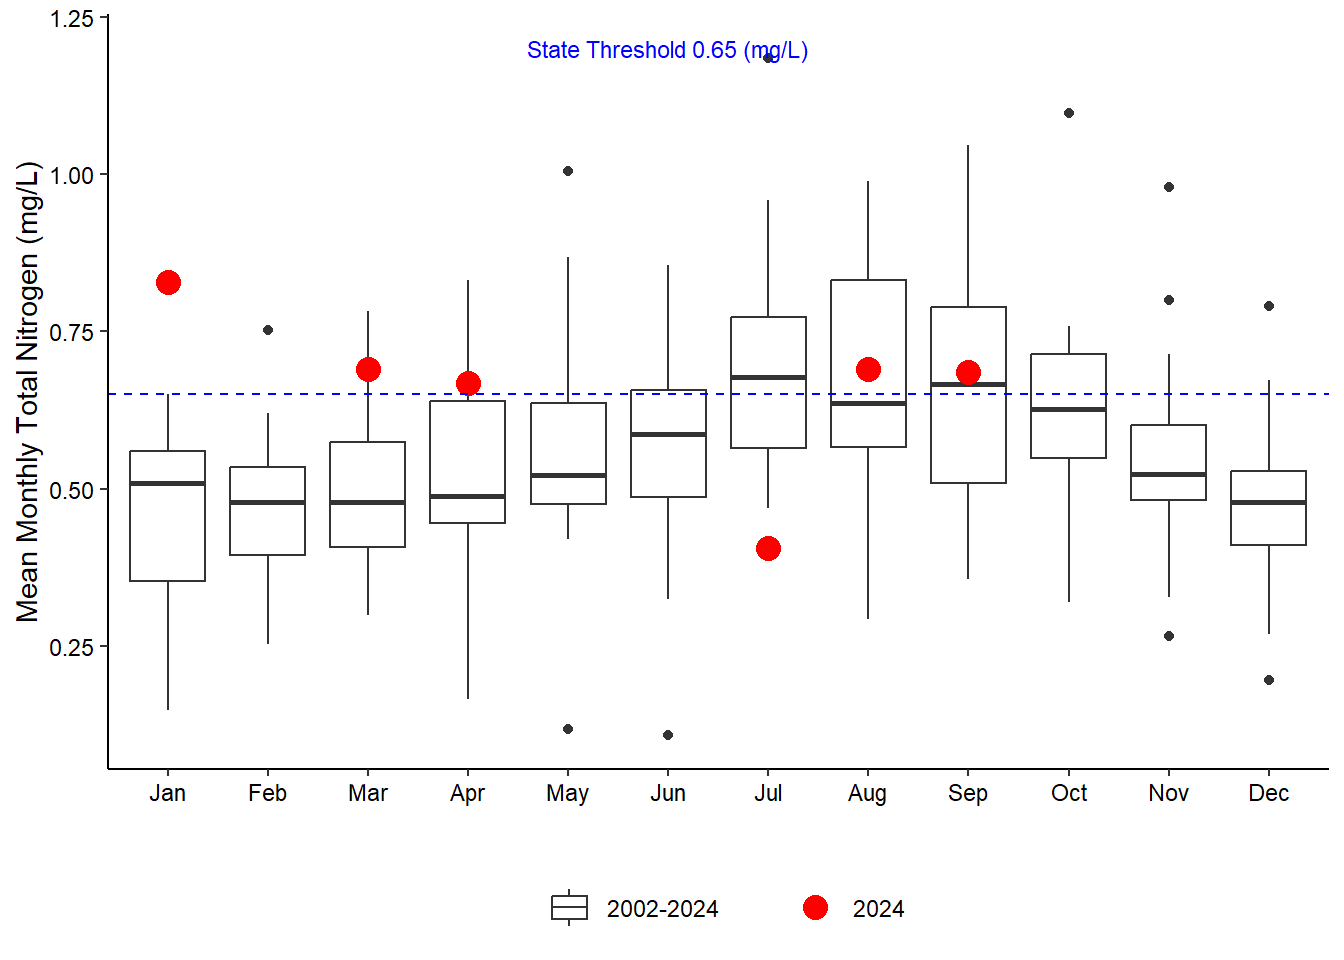
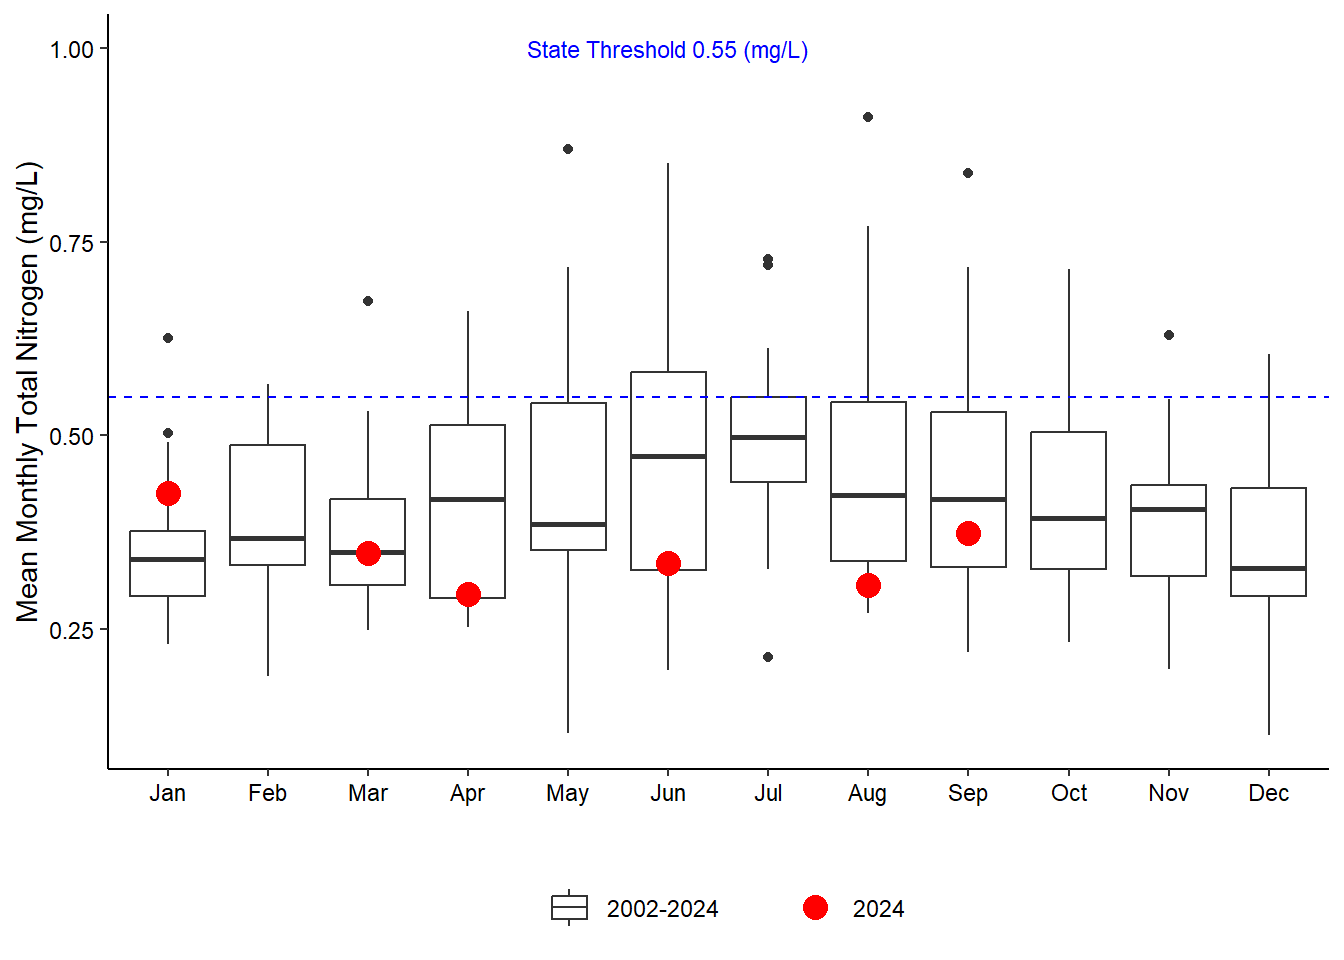
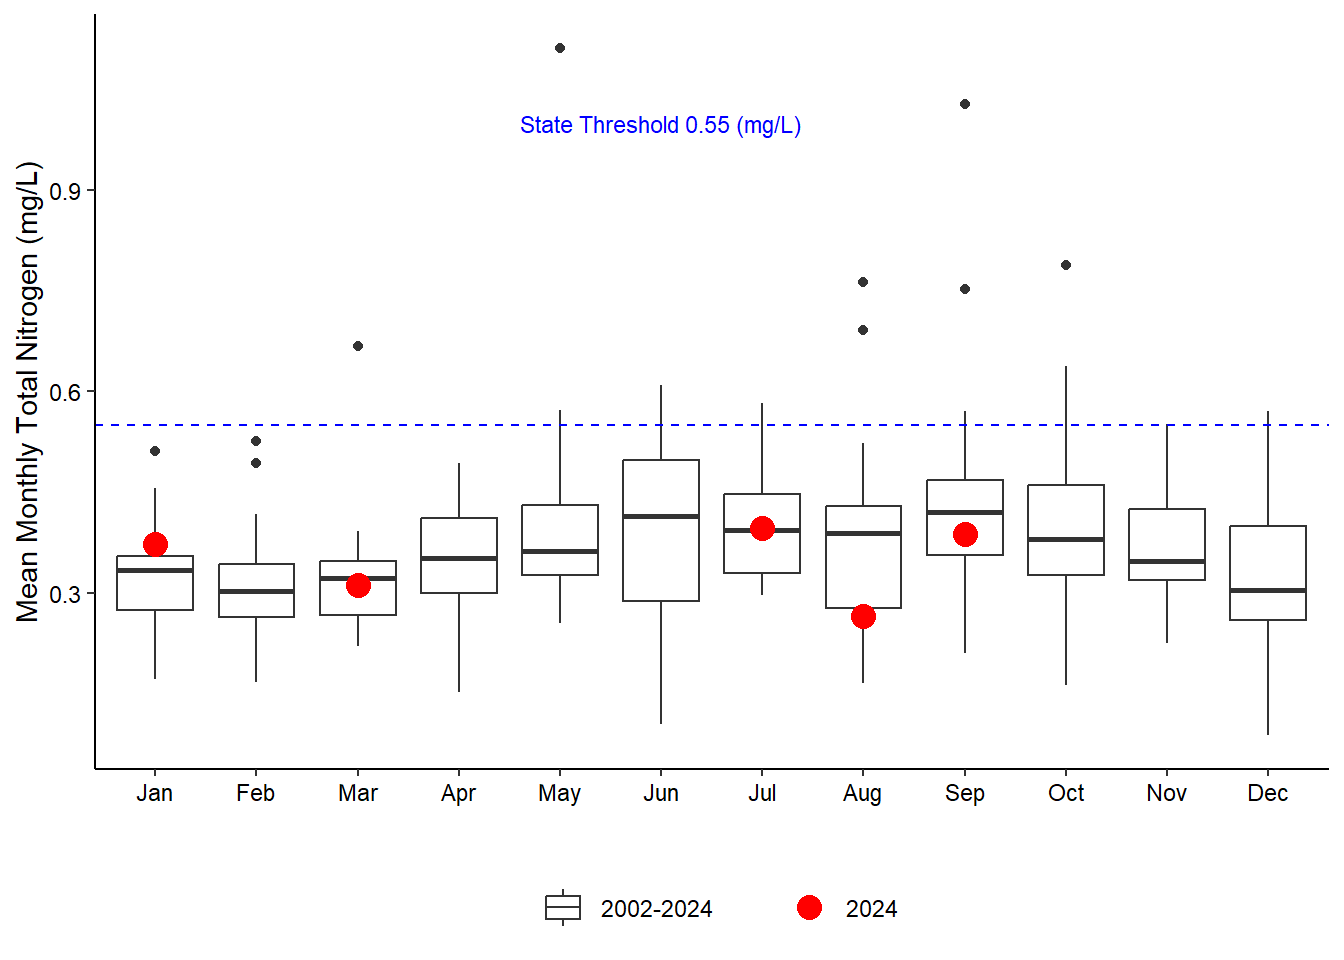
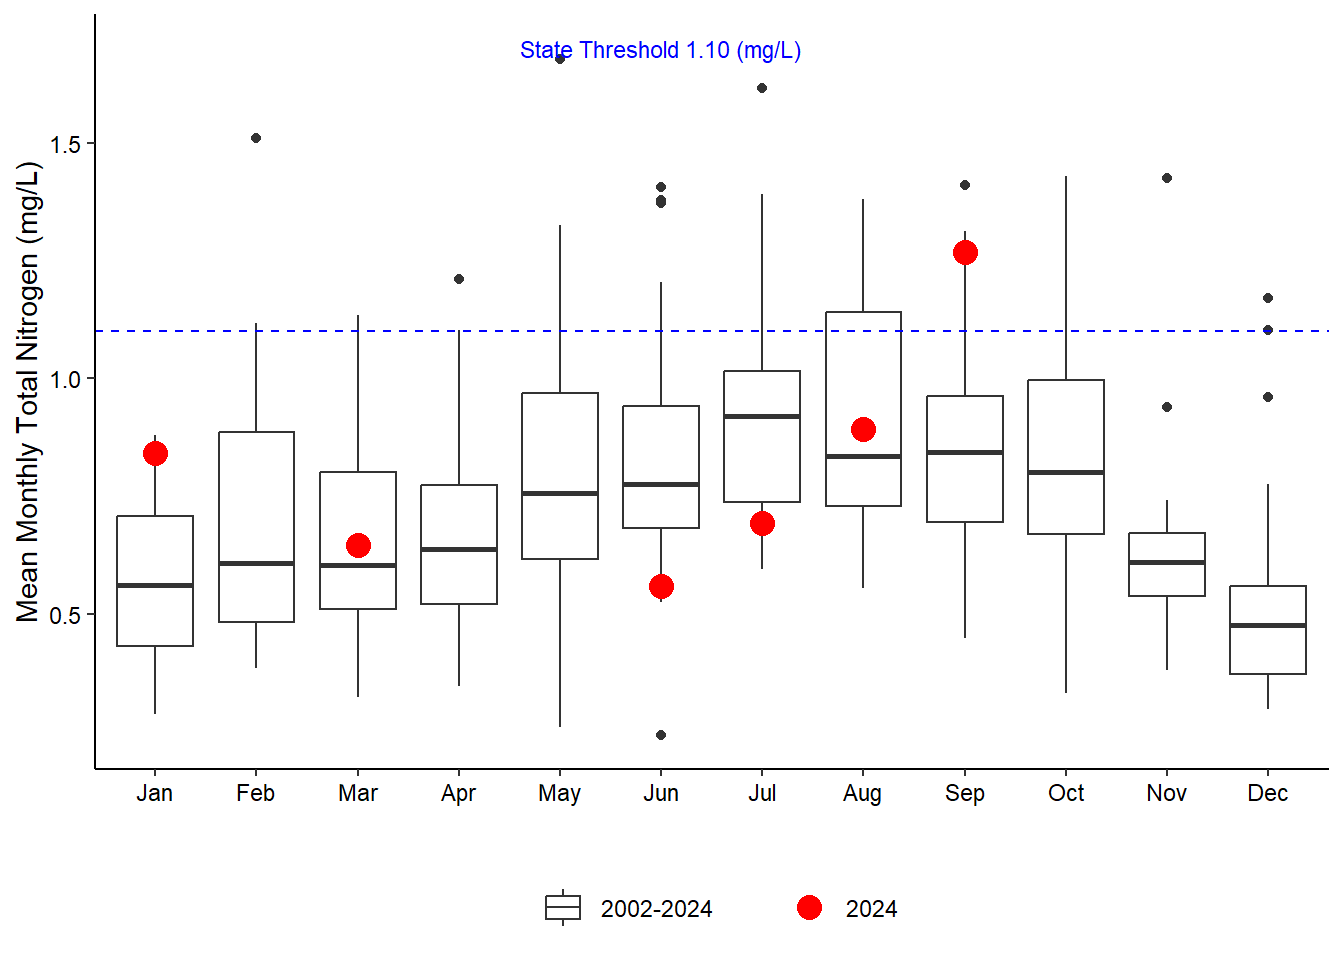
5.2.3.1 Total Nitrogen
TN is calculated by adding TKN and NO23. It accounts for the inorganic nitrogen fraction as well as larger pools of organic bioavailable forms.
Several of the NO23 values fell below the Florida Department of Environmental Protection Central Lab’s minimum detection limit and therefore TN was not able to be calculated and is missing for quite a few months at all the stations (Figure 5.6). This was especially true at Fort Matanzas which has the least amount of TN data (Figure 5.6 (c)).
5.2.3.2 Ammonium
Ammonium is directly measured in our samples and is a key inorganic nutrient assimilated by phytoplankton in primary production.

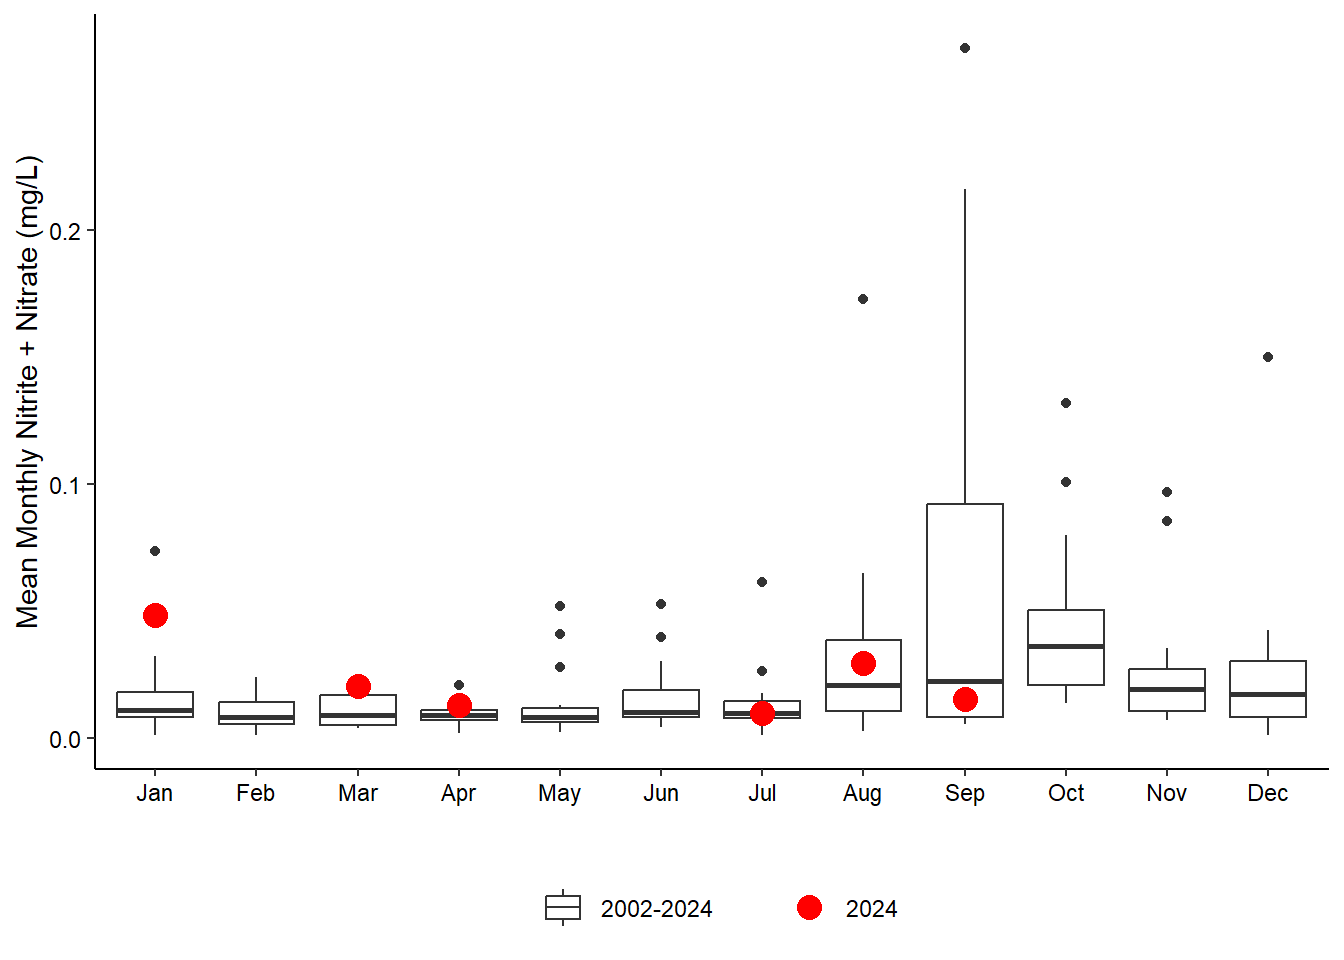
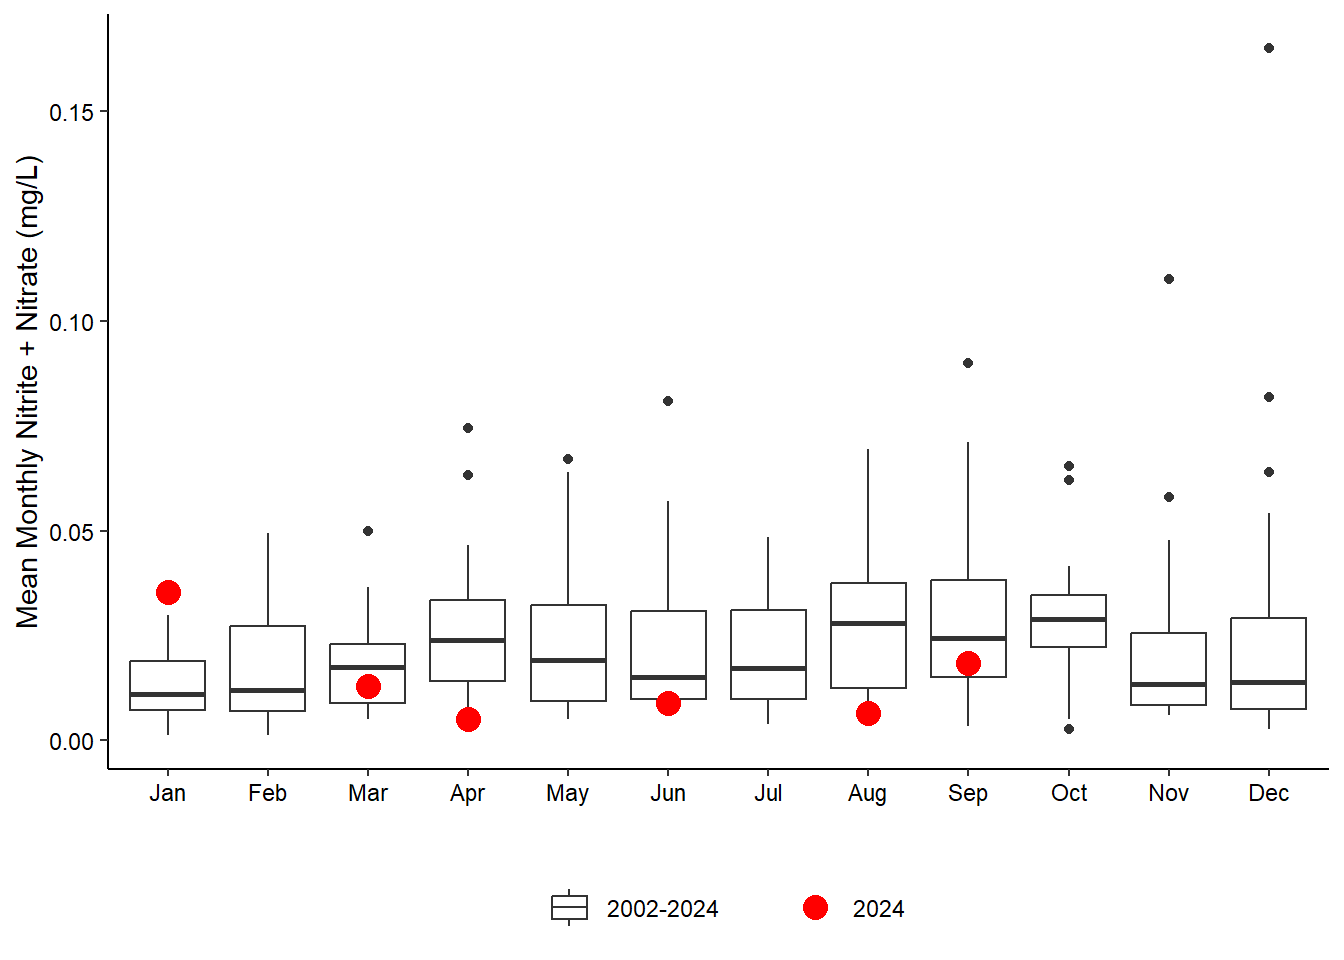
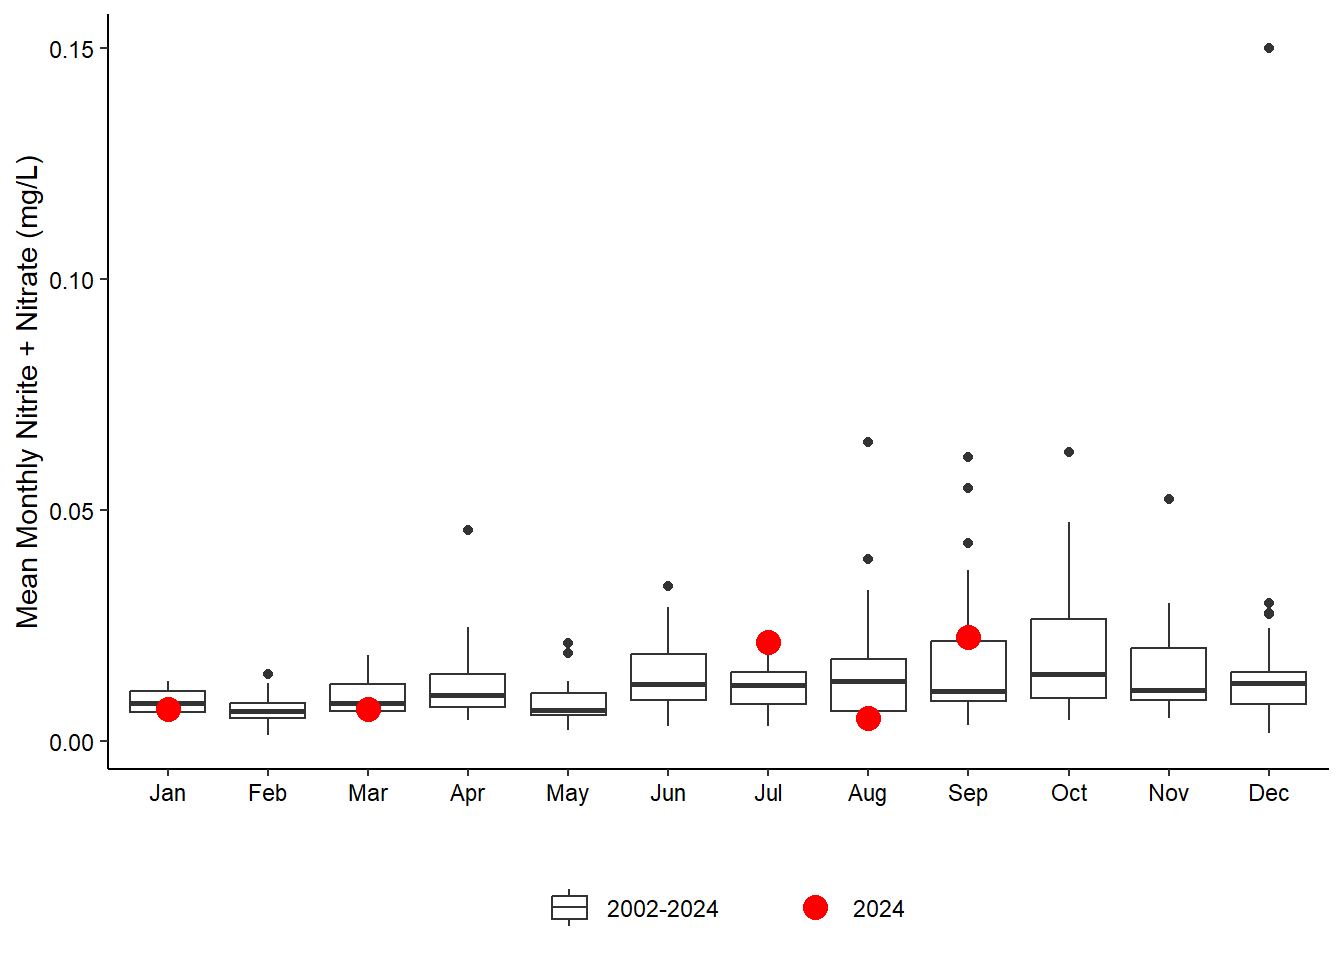
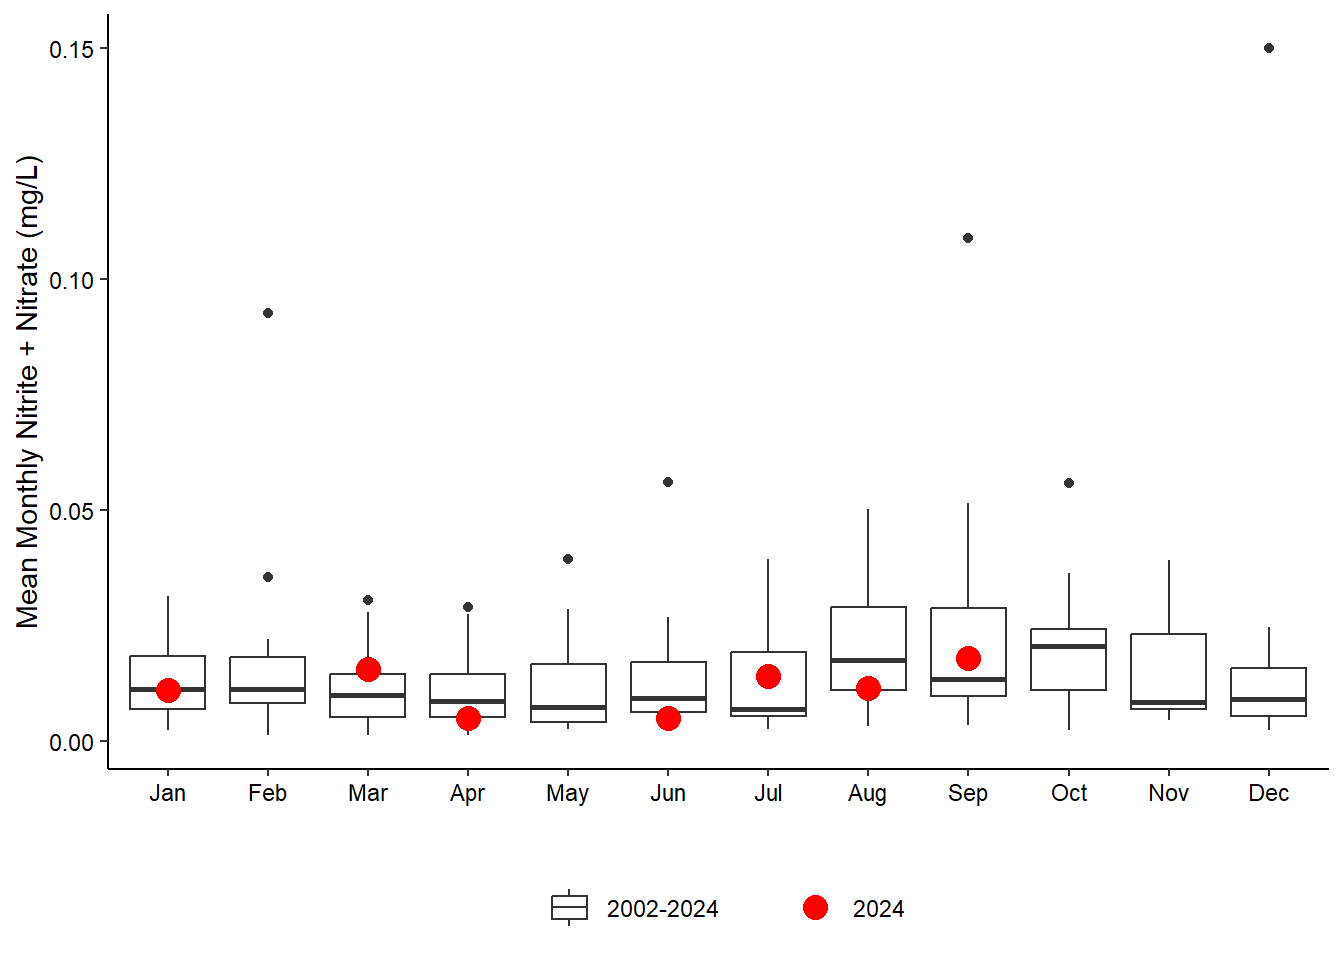
5.2.3.3 Nitrite + Nitrate
5.2.3.4 Total Kjeldahl Nitrogen
TKN is the total concentration of organic nitrogen and ammonia. It is directly measured in our samples.
5.2.4 Phosphorus
5.2.4.1 Total Phosphorus
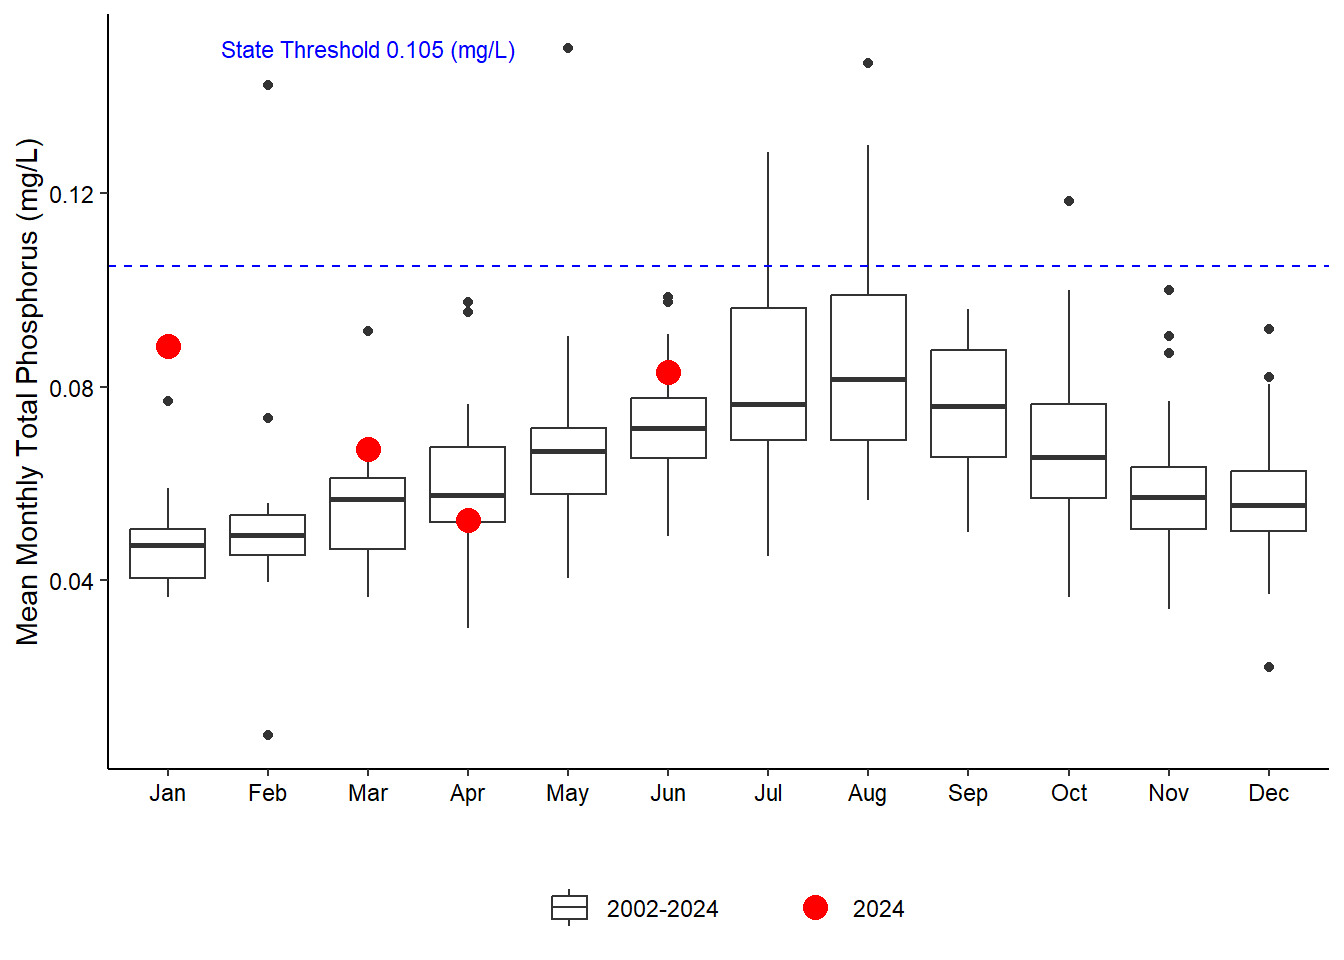
5.2.4.2 Orthophosphate