4 Environmental
The following includes variables that establish the estuarine setting: rainfall, light intensity, water temperature, and salinity. These variables are driven primarily by climatic patterns and largely influence water quality condition.
4.1 Summary
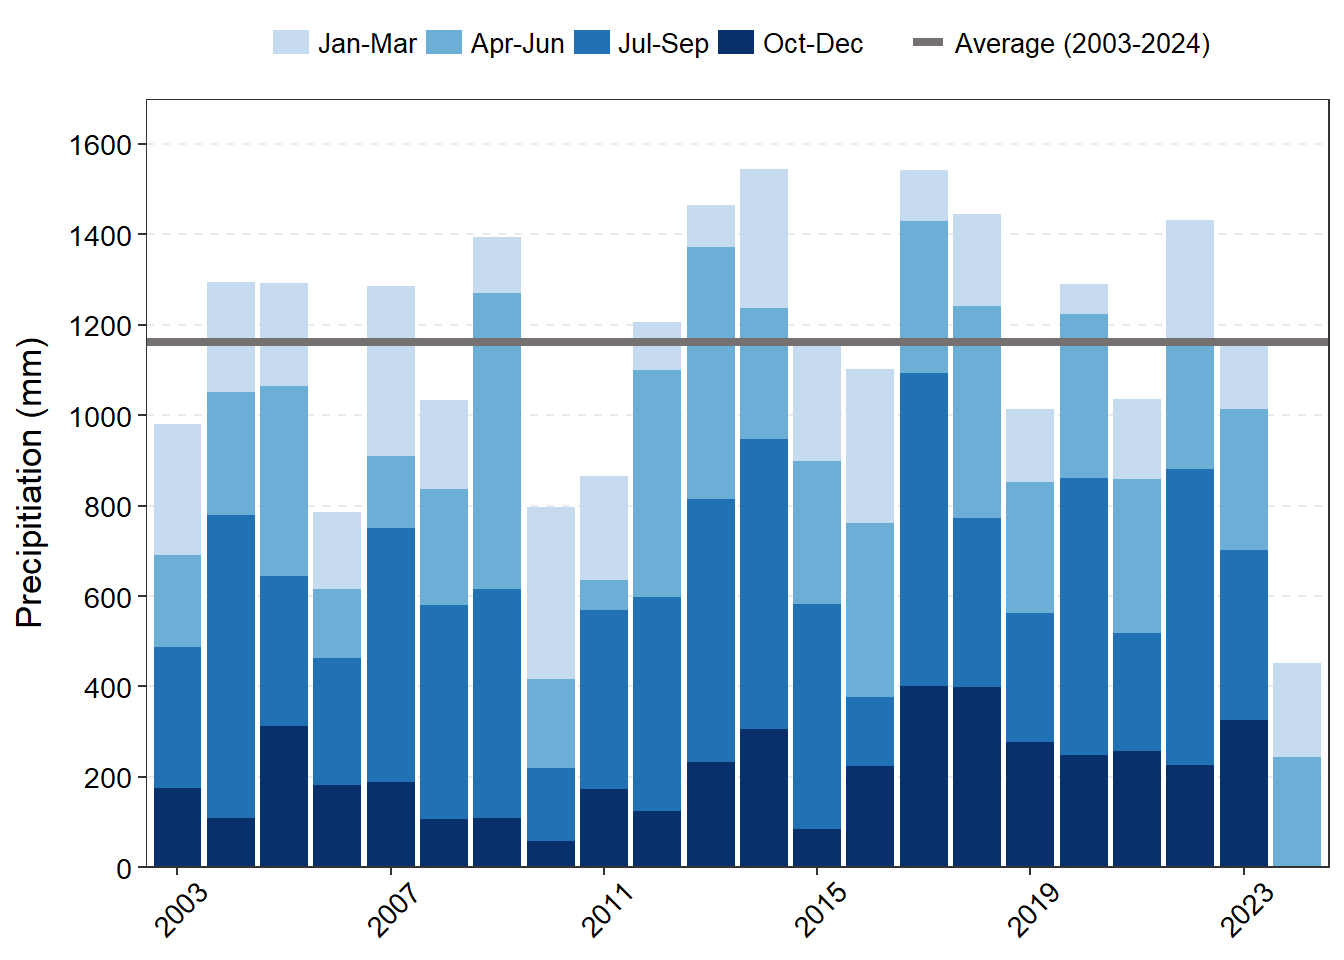
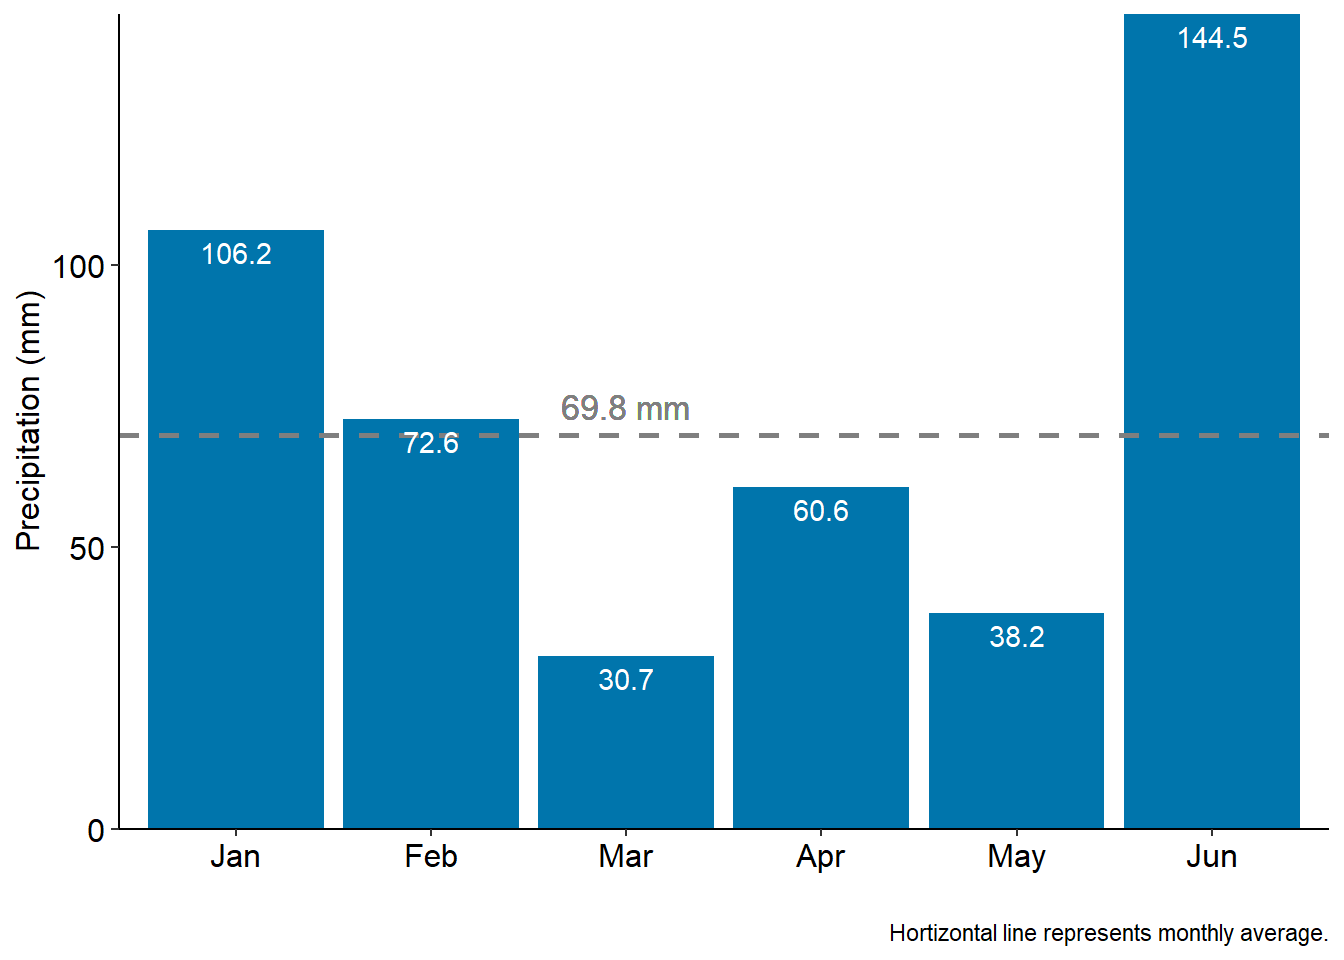
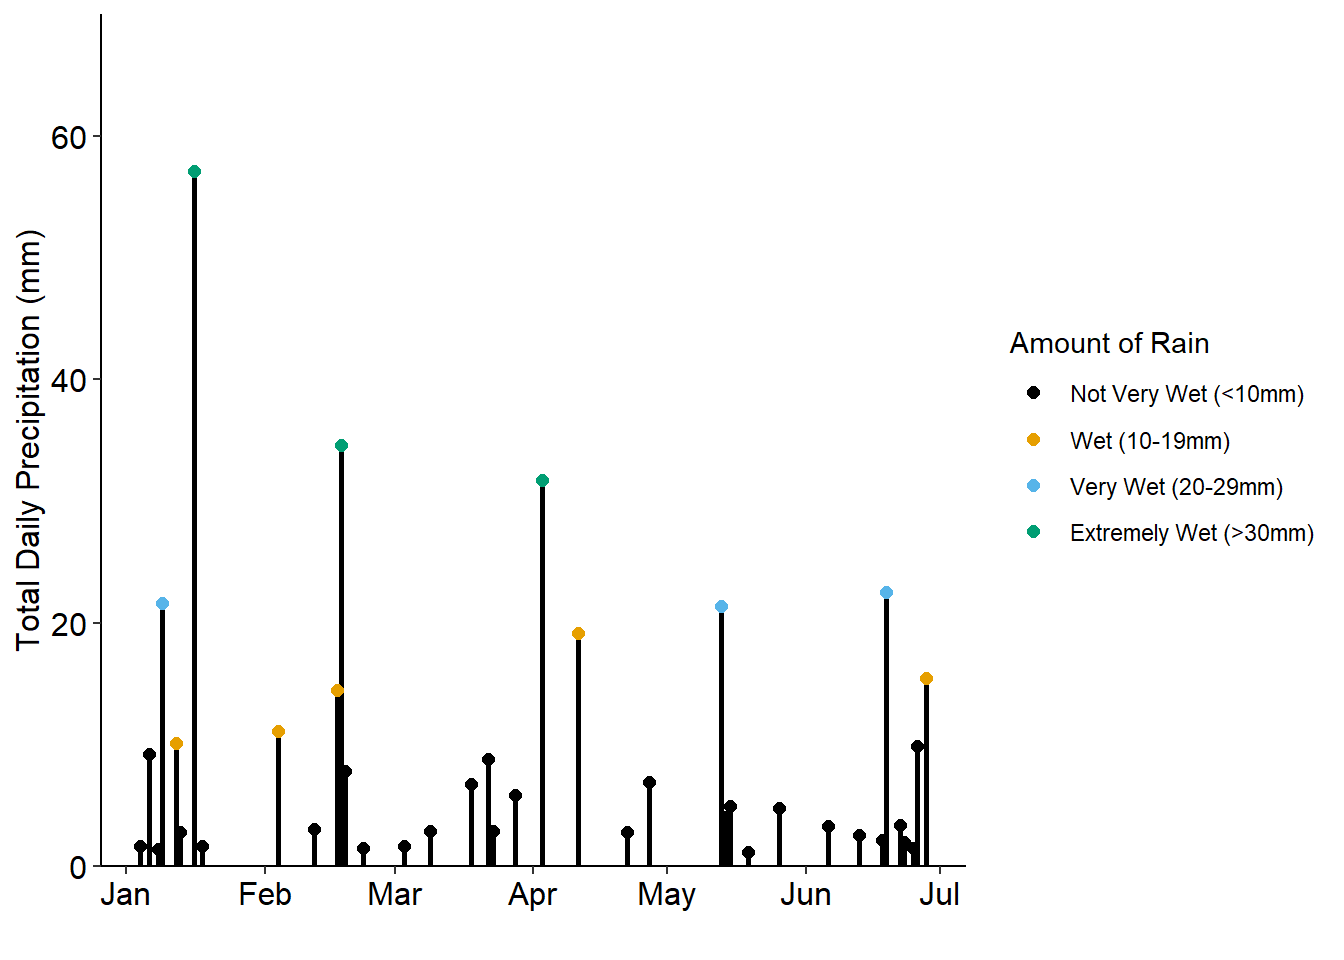
Rainfall totals for the second quarter of 2024 exceeded the totals for the first quarter (Figure 4.1). June had the greatest monthly total rainfall for 2024 so far (Figure 4.1 (b)), but both January and February had the greatest number of rain days exceeding 10 mm/day (Figure 4.1 (c)).
The start of Quarter 2 was dry with little to no rain, except for the one day in April with over 30 mm of rain and May 13-15 when the area received heavy rains and strong winds. As the drought conditions continued into June, the light intensity was high, especially mid-day (Figure 4.2).
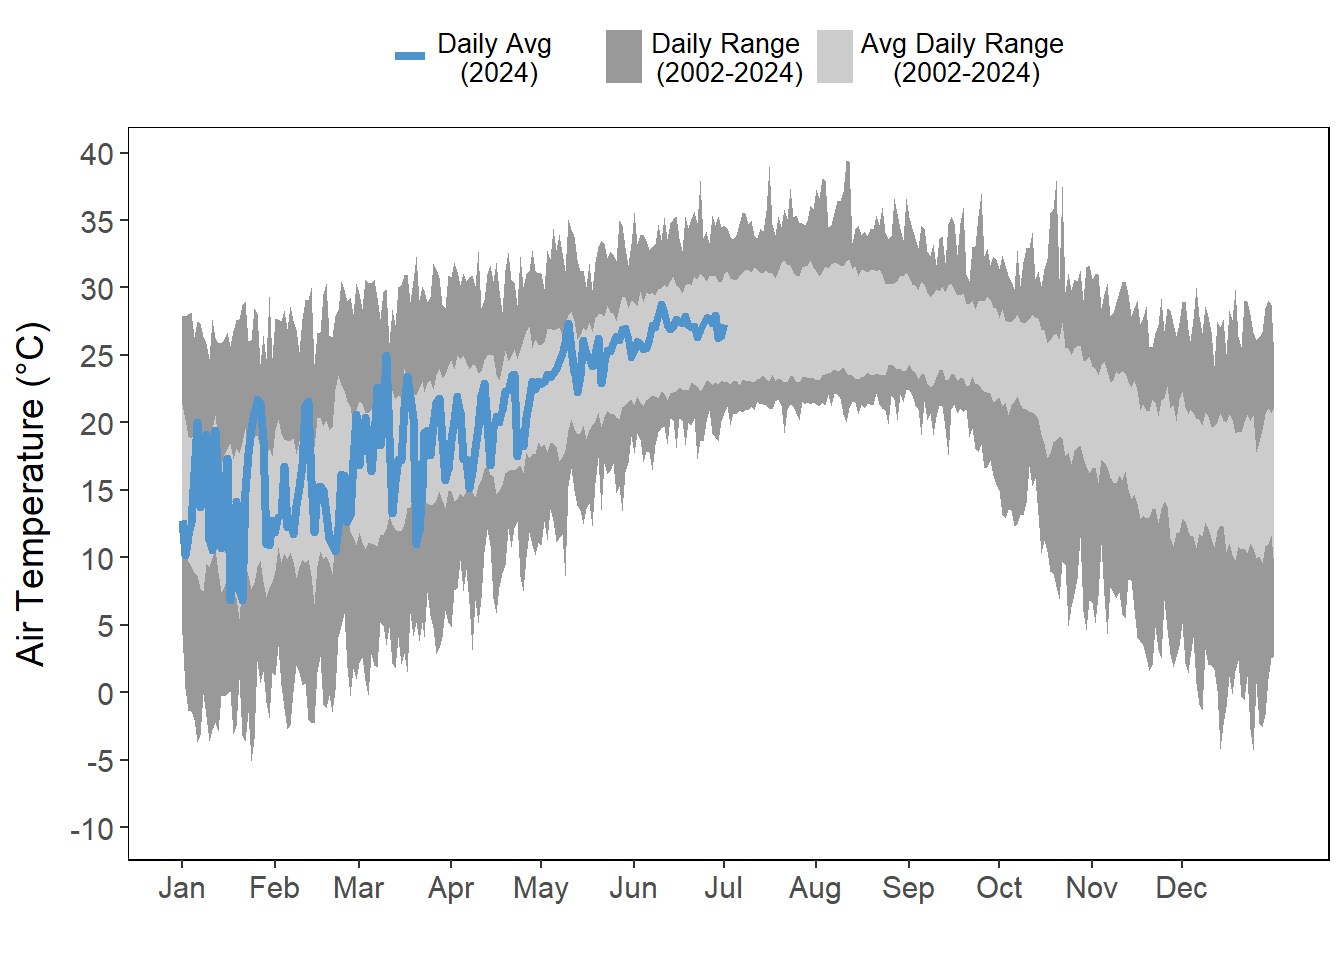
Daily average air temperatures were variable during the first part of the year but surprisingly fell within the historical range for the GTMNERR station through June (Figure 4.3). January and March experienced a few daily average air temperature extremes below and above the average range (Figure 4.3).
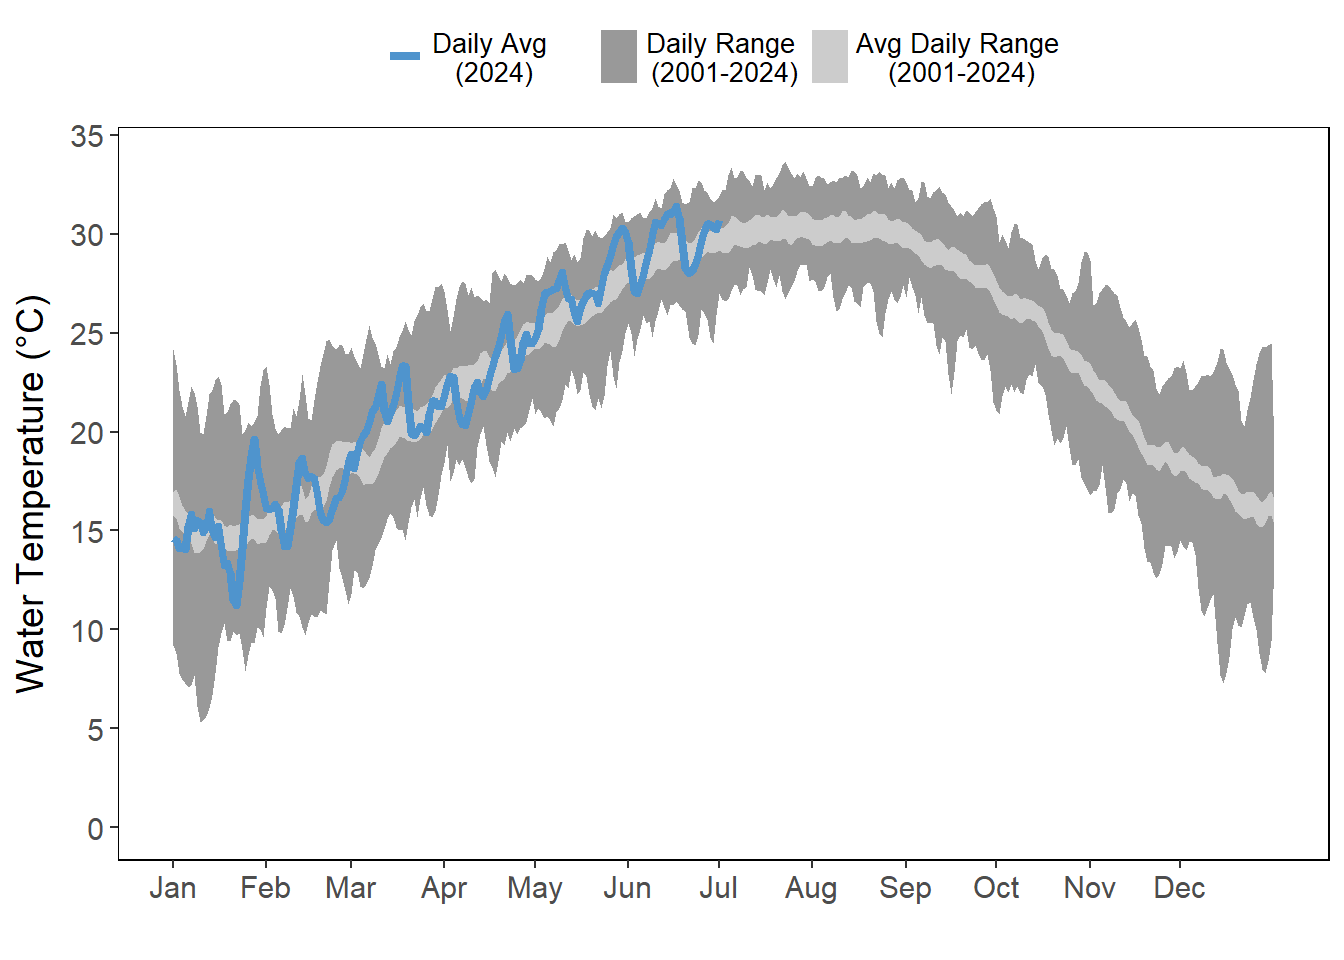
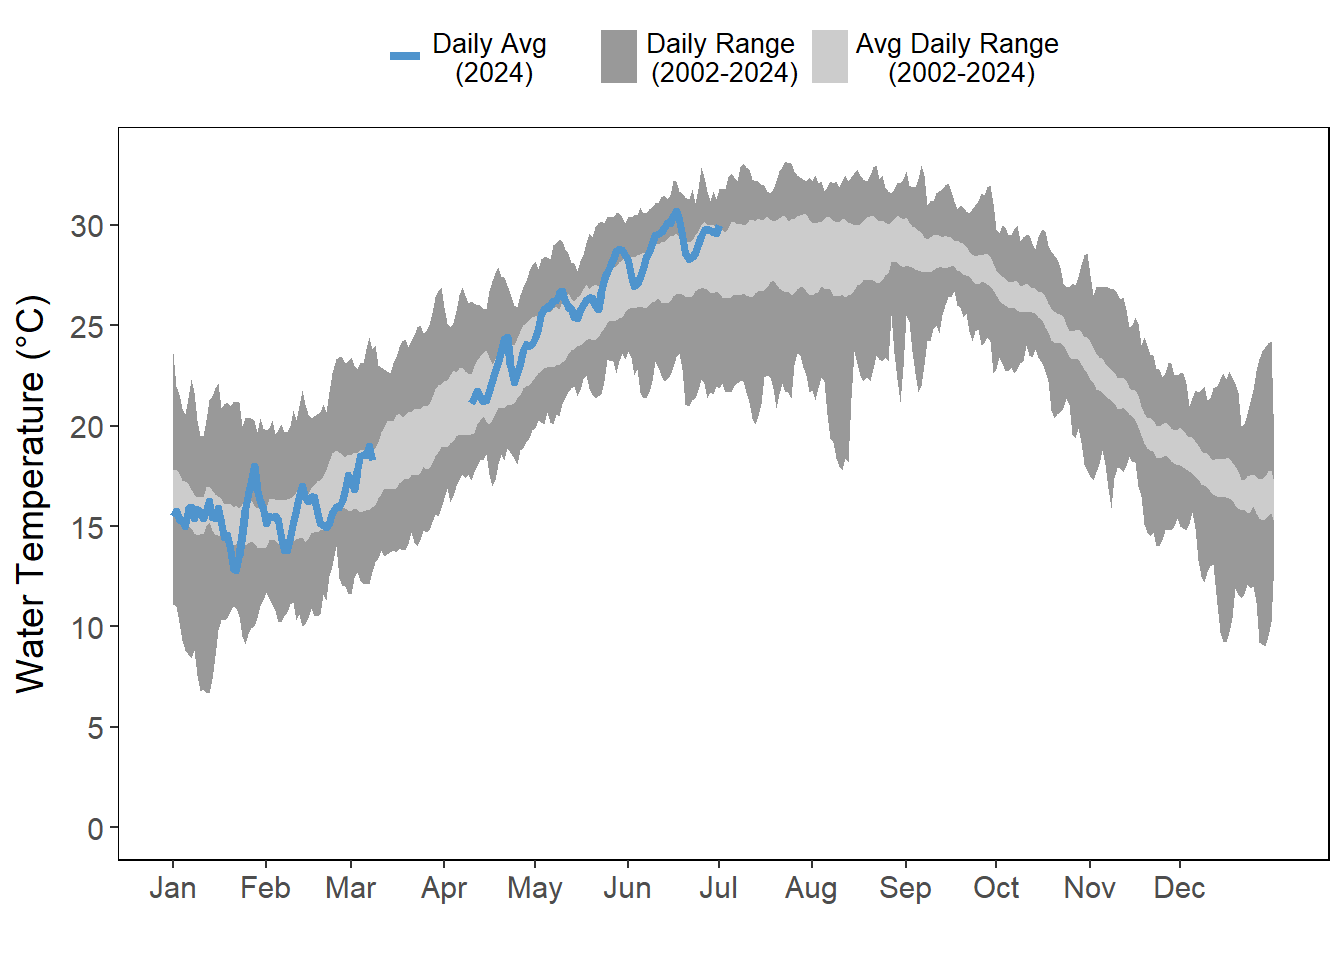
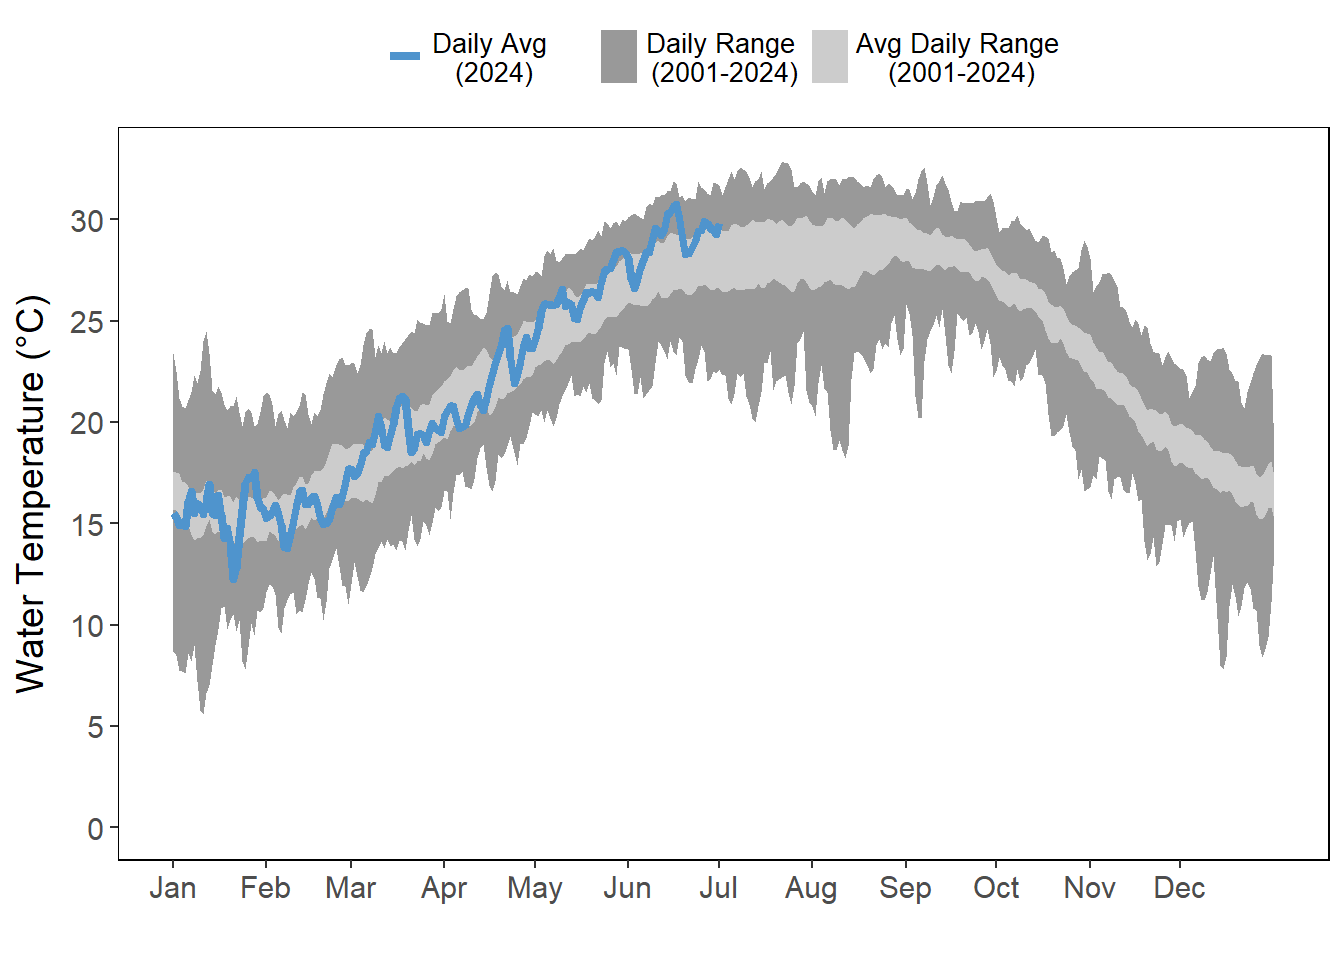
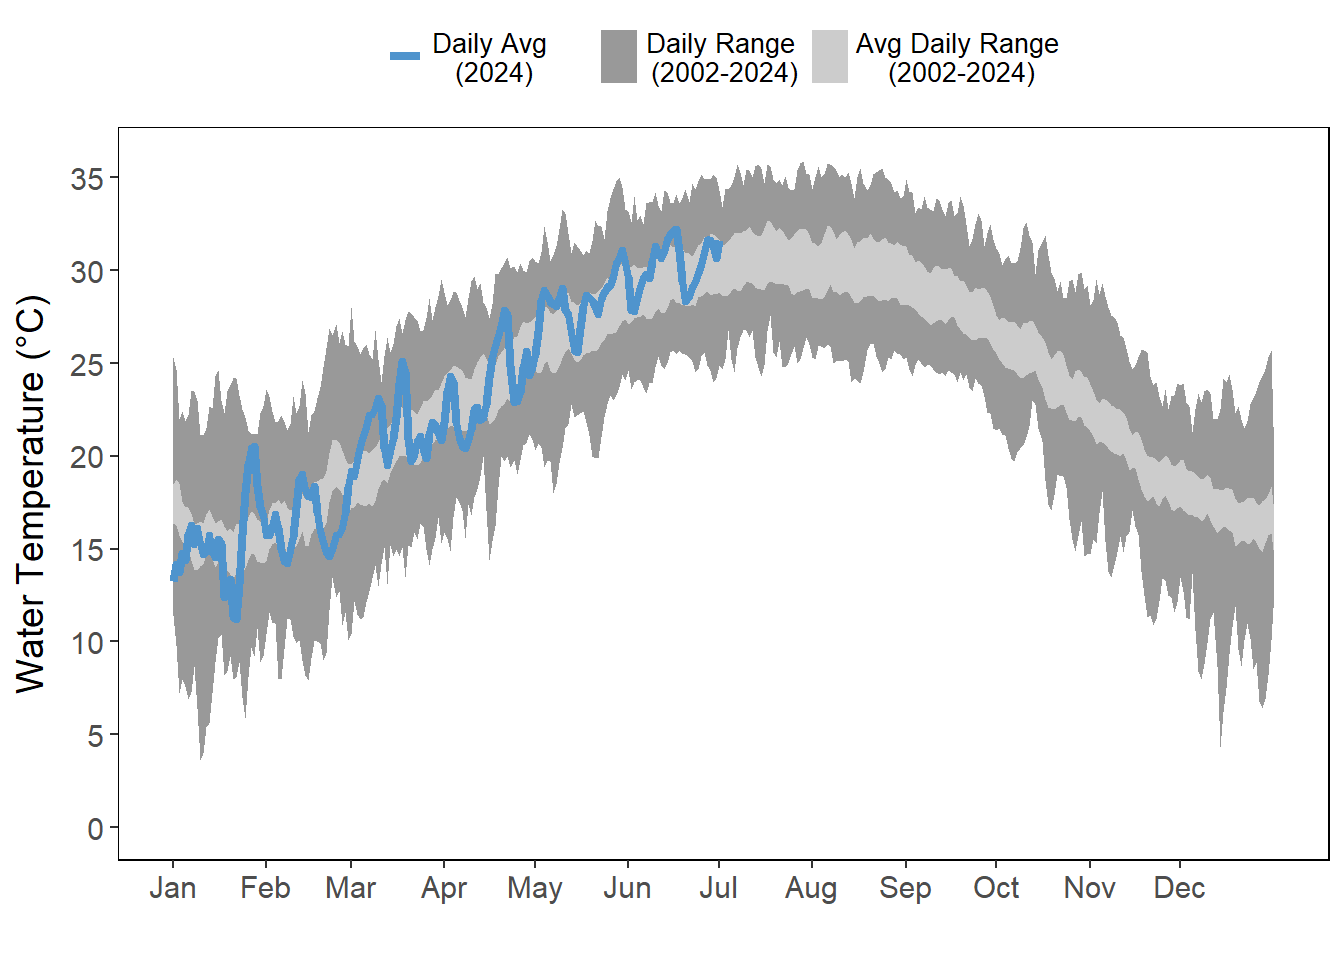
While there were some low water temperatures in January, daily water temperature averages were generally higher than average throughout the spring and early summer (Figure 4.4). The changes in daily averages were observed at all four stations, though more pronounced at San Sebastian and Fort Matanzas, the stations close to inlets (Figure 4.4 (b); Figure 4.4 (c)).
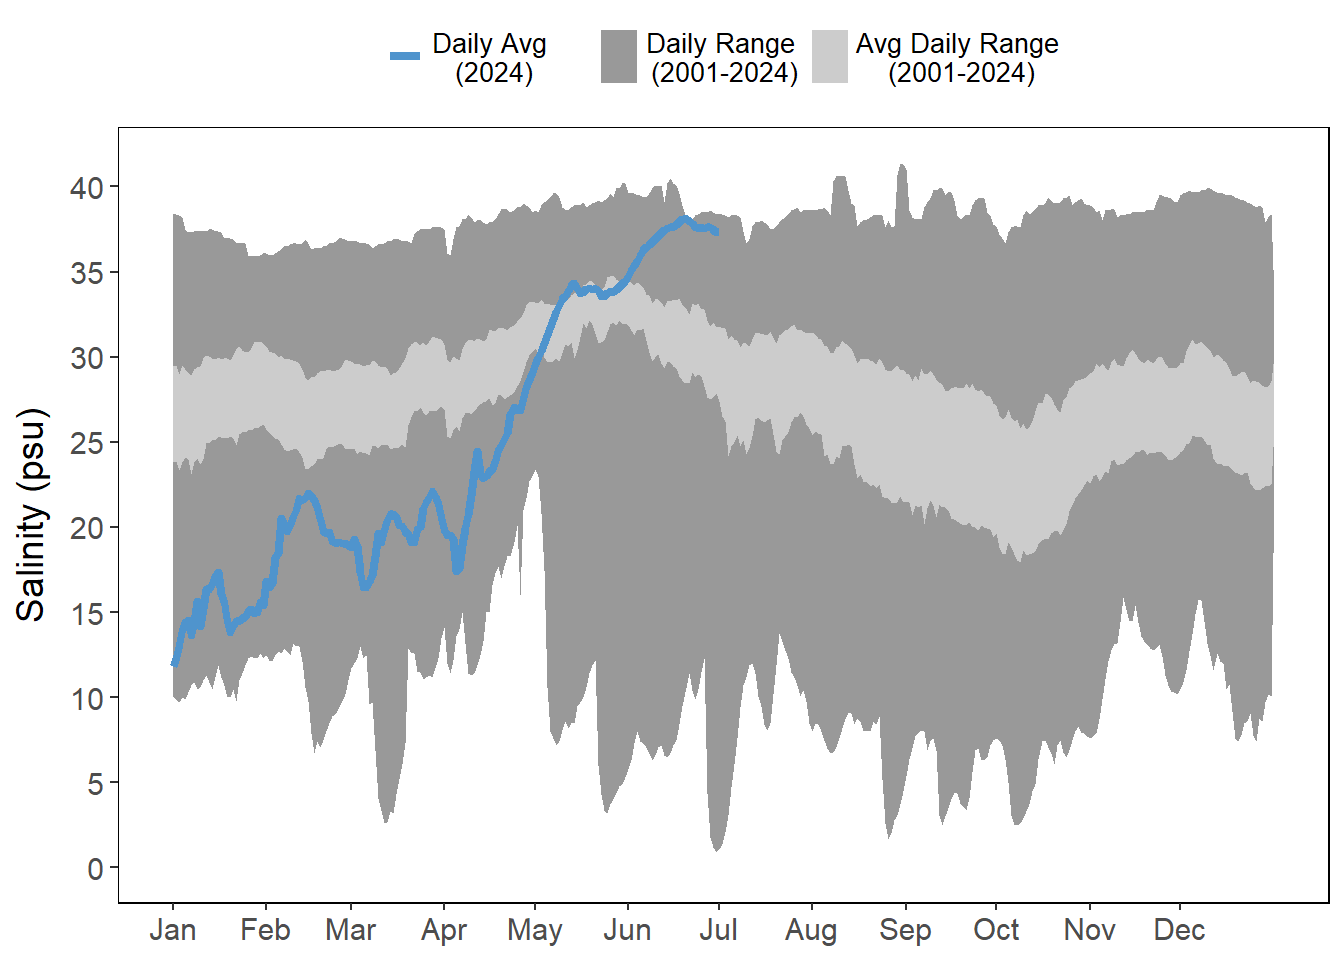
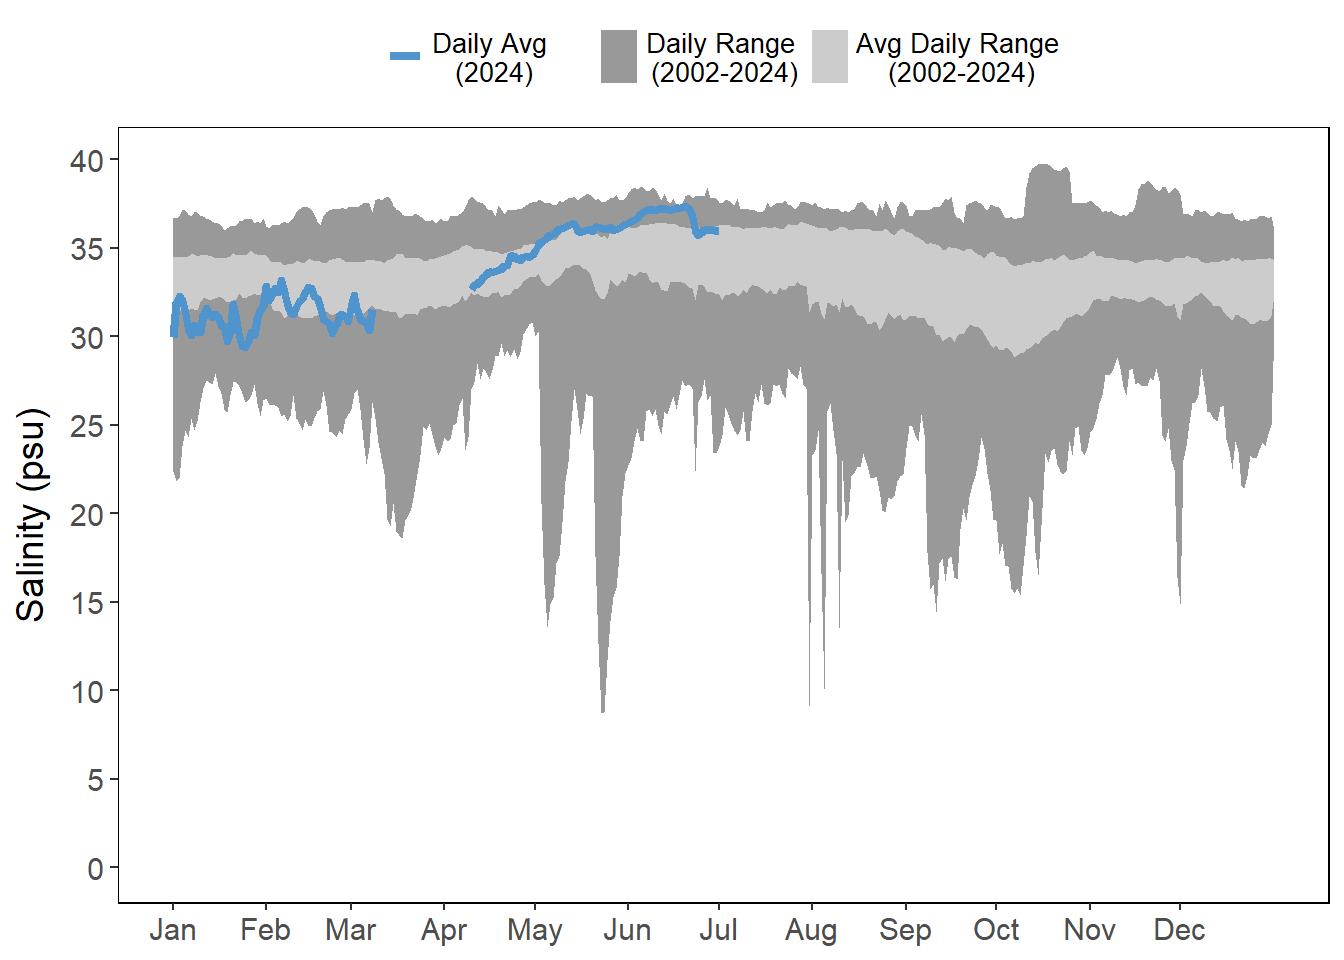
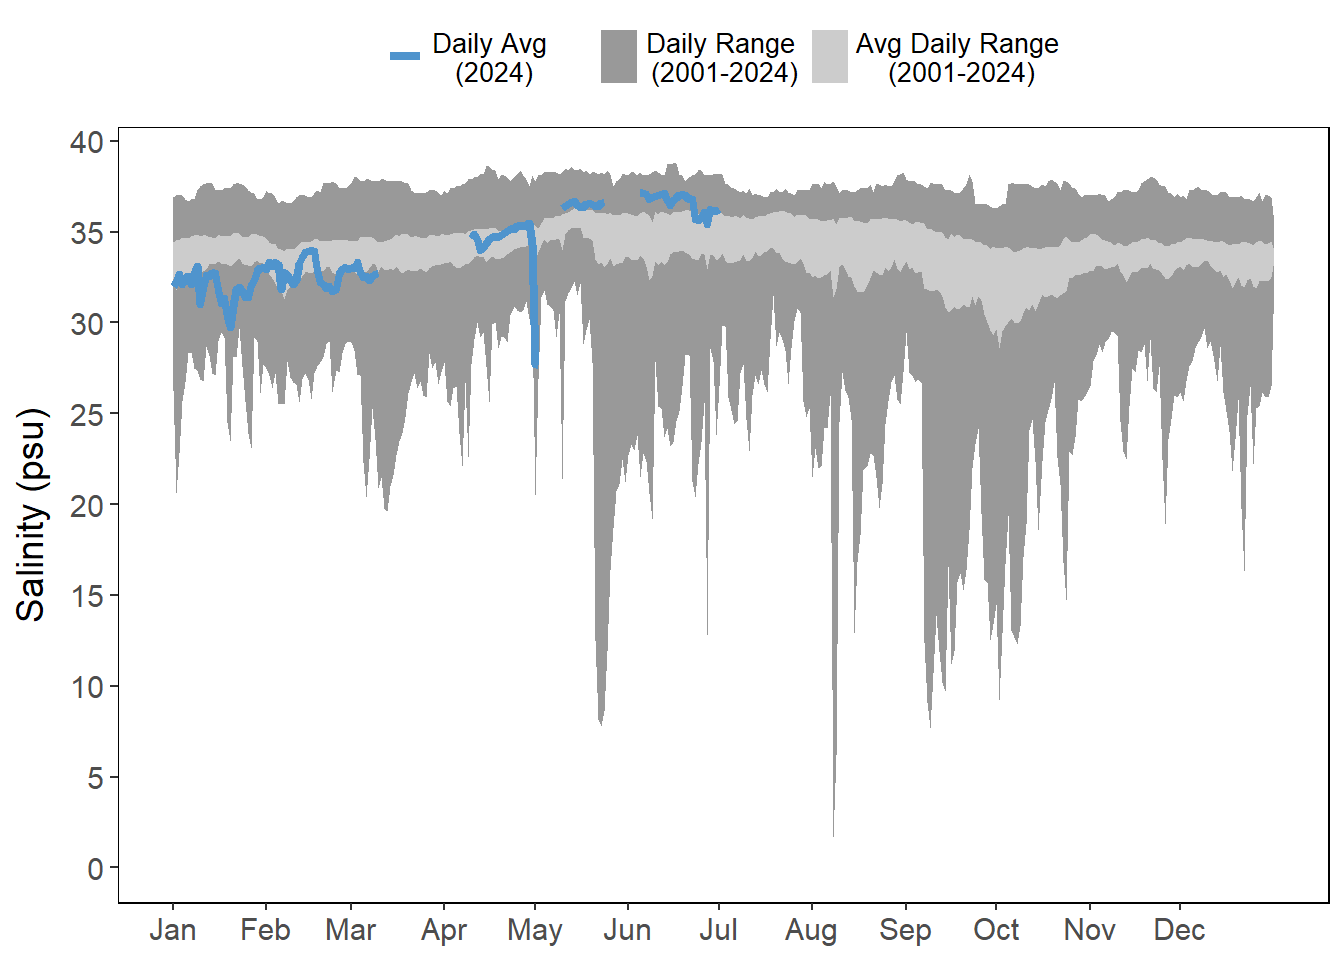
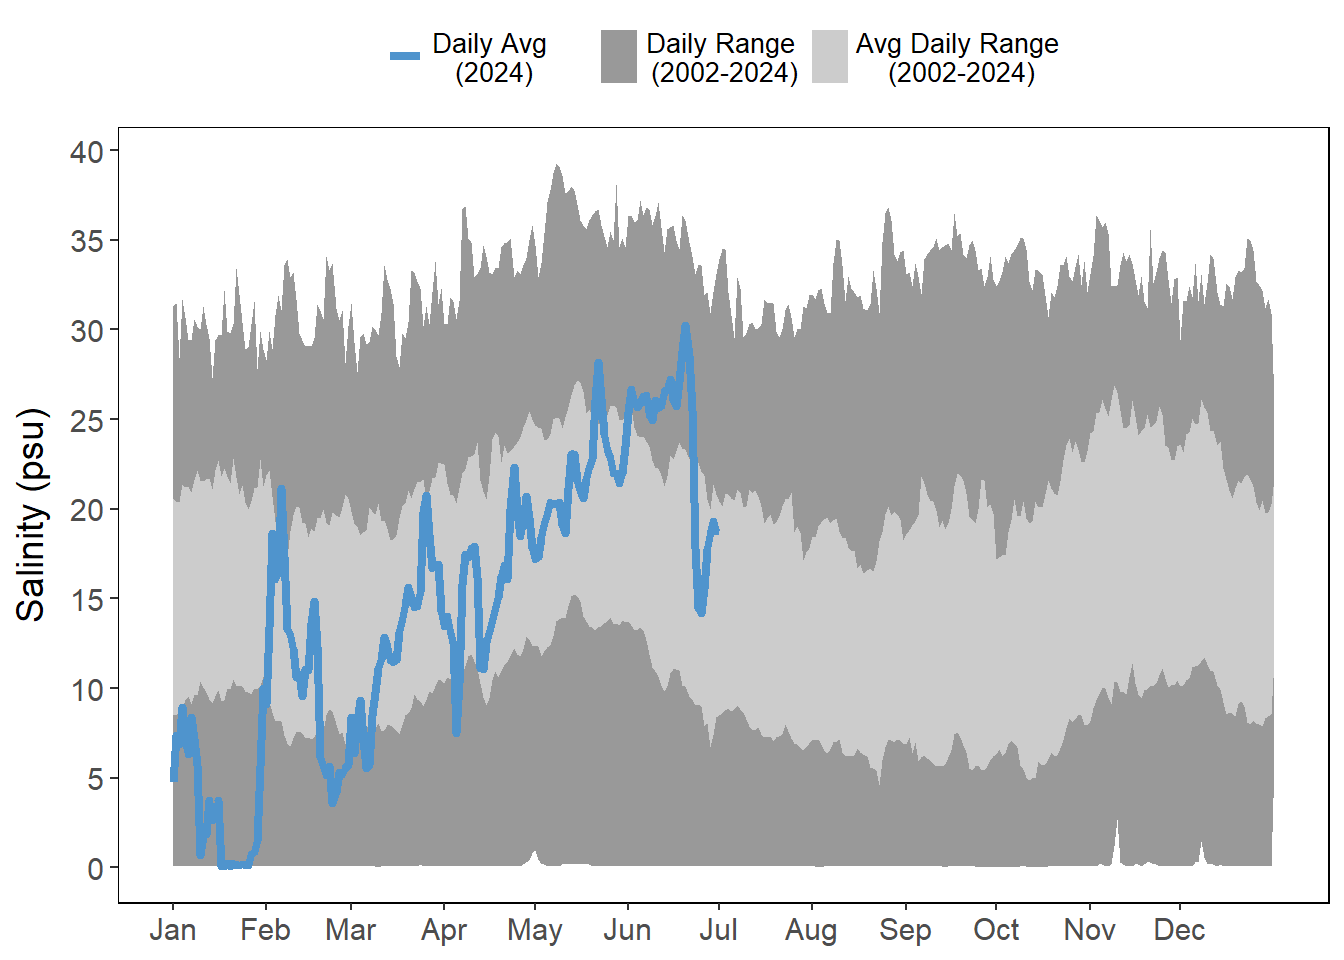
Rainfall in January brought salinities lower than their average daily ranges (Figure 4.5), particularly at the stations farthest from the inlets (Figure 4.5 (a); Figure 4.5 (d)). However, the drought conditions in spring made salinity levels rise. Salinities stayed above the average daily range at all stations in June but was most pronounced at Pine Island (Figure 4.5 (a)).
4.2 Data
4.2.1 Rainfall
Data is presented as quarterly totals, then monthly, and then daily totals as “rain days” which are categorized into Wet (<10 mm), Very Wet (20-29 mm), and Extremely Wet (>30 mm) days.
4.2.2 Light Intensity
The plot below is interactive. Clicking on elements in the legend (months) will select or deselect months of interest. Additionally, the axis can be adjusted by selecting portions of the plot to isolate.
4.2.3 Temperature
Air and water temperatures are presented as daily averages (blue line) with historic ranges (daily range and average daily range) provided in shades of gray.
4.2.4 Salinity